

Systematic review of Buzhong Yiqi method in alleviating cancer-related fatigue: a meta-analysis and exploratory network pharmacology approach
- PMID: 39564104
- PMCID: PMC11573511
- DOI: 10.3389/fphar.2024.1451773
Systematic review of Buzhong Yiqi method in alleviating cancer-related fatigue: a meta-analysis and exploratory network pharmacology approach
Abstract
Objectives: Cancer-related fatigue (CRF) is a prevalent and distressing symptom experienced by many cancer patients, necessitating effective treatments. This study utilizes meta-analysis and network pharmacology to comprehensively assess the efficacy of the Buzhong Yiqi prescription in alleviating cancer-related fatigue and to preliminarily explore the mechanism of its core drugs.
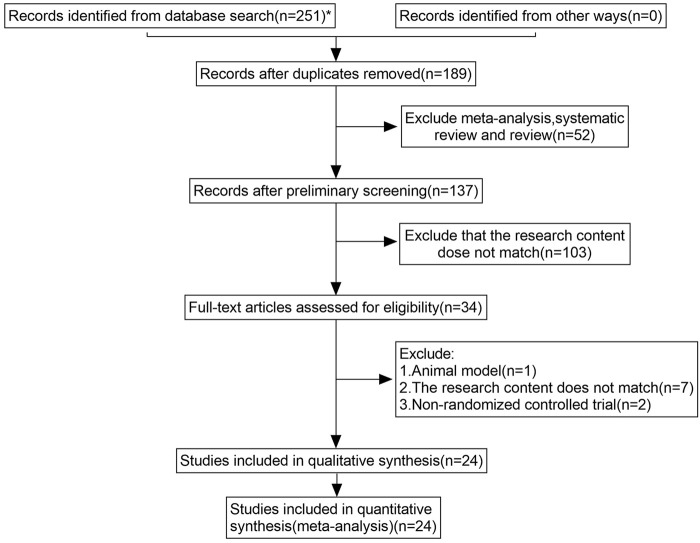
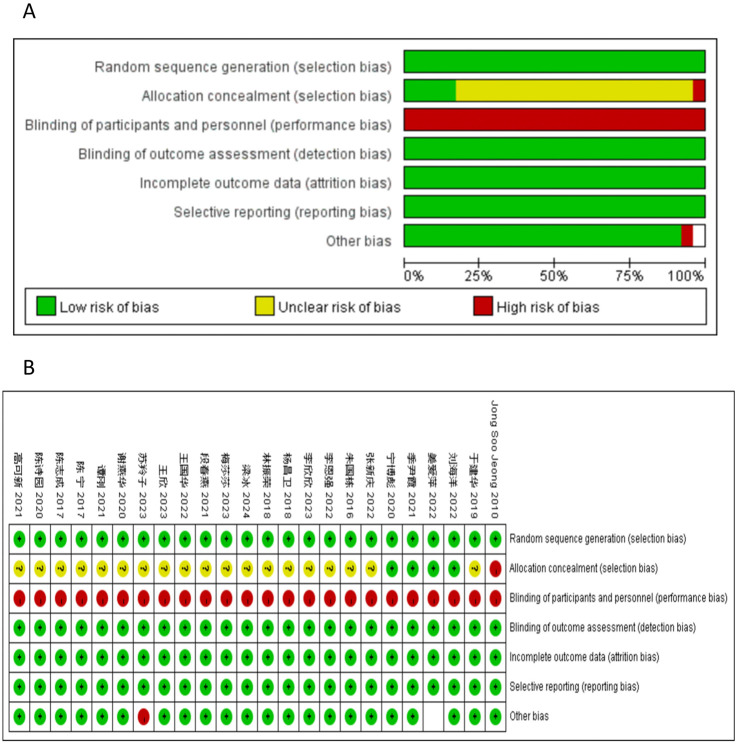
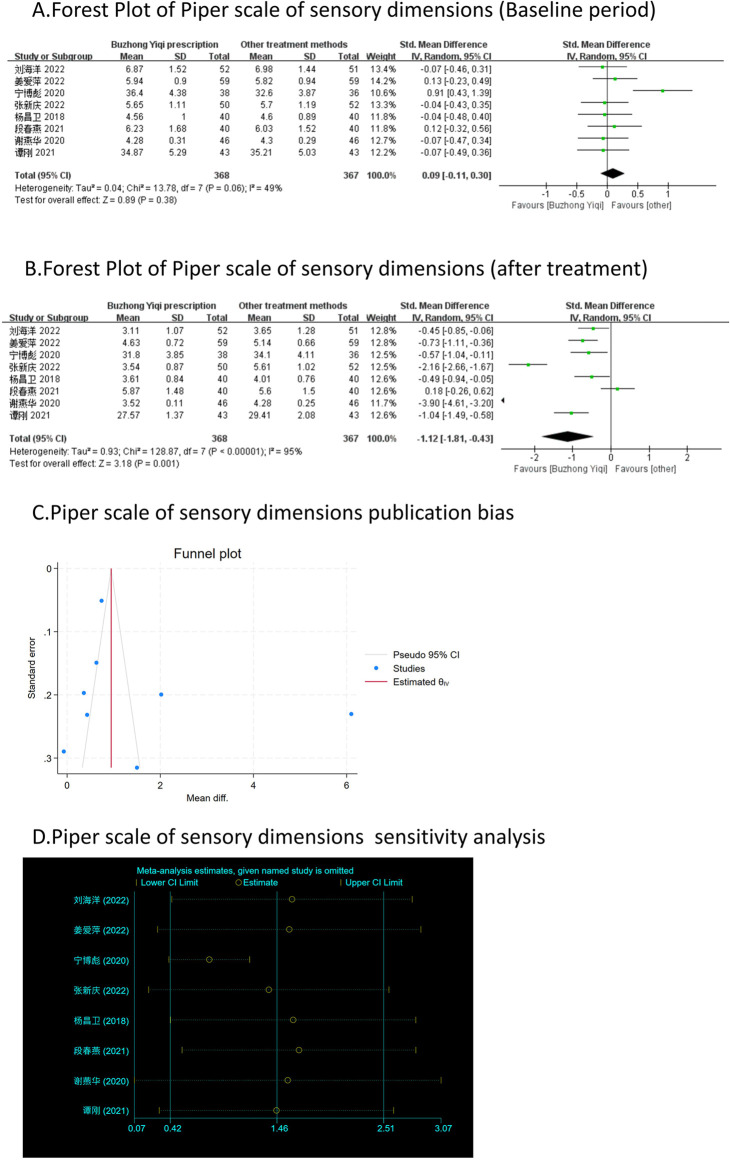
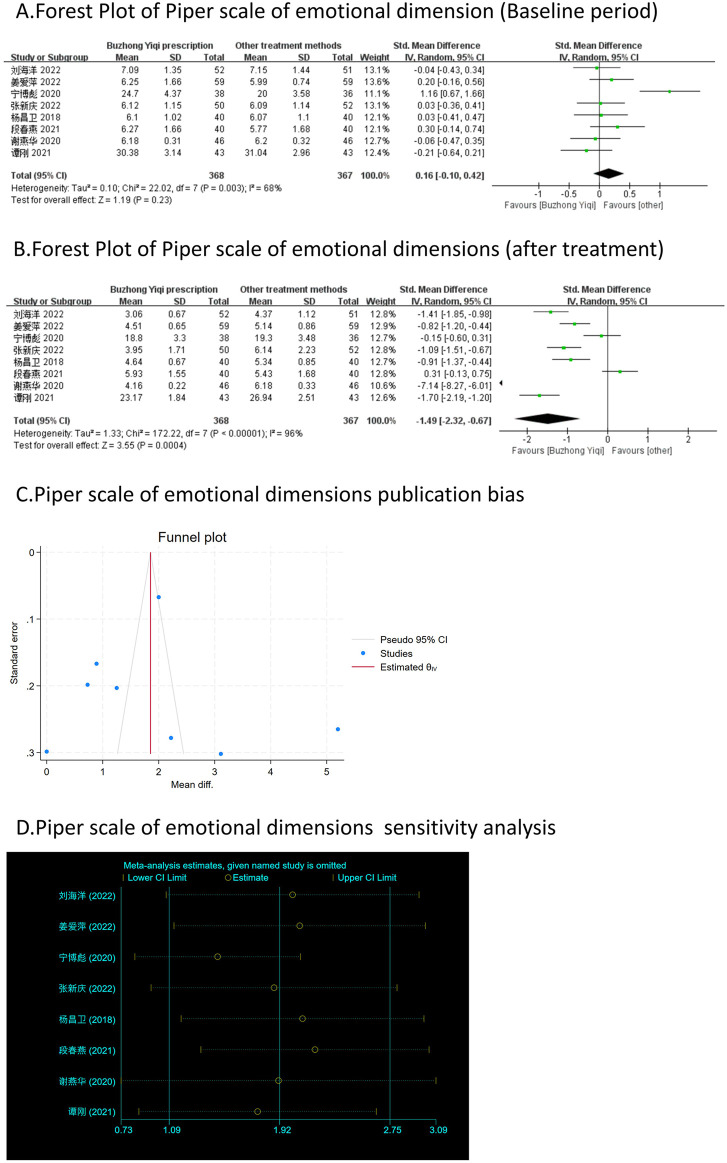
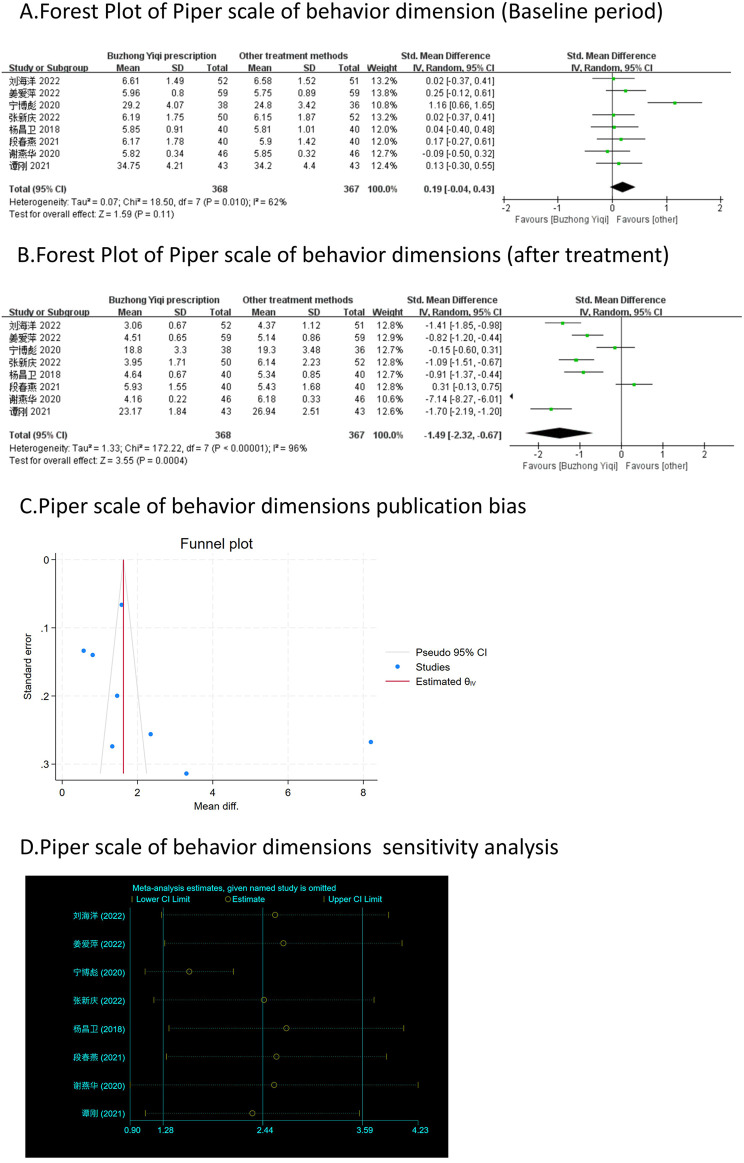
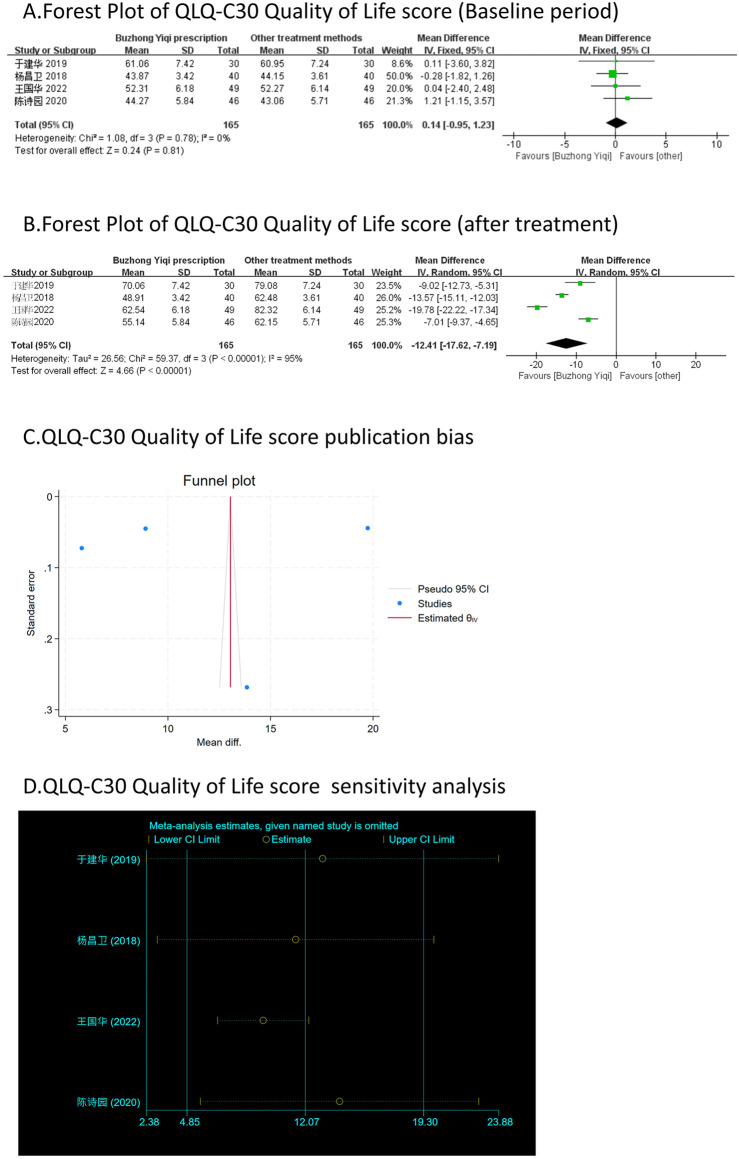
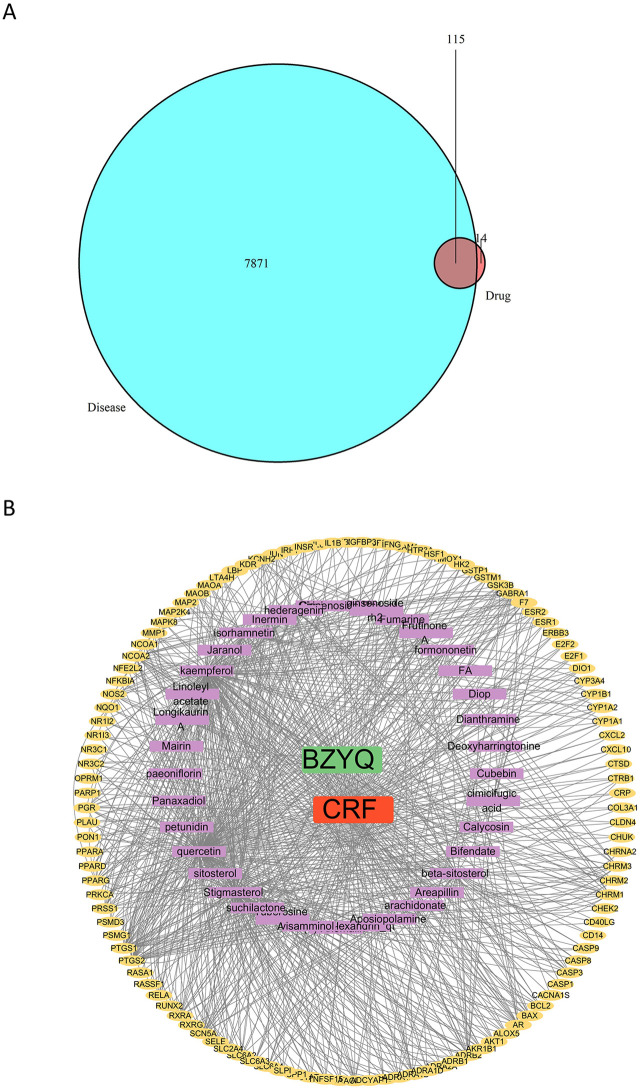
Methods: We included randomized controlled trials (RCTs) in cancer patients. The inclusion criteria encompassed a diagnosis of cancer-related fatigue, without limitation on cancer type, the experimental group receiving Buzhong Yiqi prescription, the control group receiving conventional treatment, patients awaiting treatment, and articles published in either English or Chinese. We conducted a search through 29 February 2024, across PubMed, Cochrane Database of Systematic Reviews, Cochrane Controlled Clinical Trials (CENTRAL), China Biomedical Literature Service (CBM), China National Knowledge Infrastructure (CNKI), WANFANG Database, and Weipu Database (VIP). Journal articles that met the inclusion criteria were selected for inclusion. Two independent investigators evaluated the quality of the included studies. A meta-analysis was performed utilizing the Stata 12.0 software package, where estimates of cancer-related fatigue were aggregated through the application of a random-effects model. We employed the Cochrane Risk of Bias Tool to evaluate potential biases in RCTs. The primary outcome measures utilized to assess the efficacy and safety of CRF treatment comprised the Revised Piper Fatigue Scale (PFS-R) and the Quality of Life Questionnaire Core 30 (EORTC QLQ-C30). The secondary outcomes encompassed the KPS score, the effective rate, the TCM syndrome score, and an evaluation of adverse reactions. The Traditional Chinese Medicine Systems Pharmacology (TCMSP) was utilized to identify the active ingredients and targets of BZD. Additionally, the Drug bank, Therapeutic Target Database (TTD), DiaGeNET, and GeneCards databases were utilized to retrieve relevant targets for CRC. The Venn diagram was employed to identify overlapping targets. Cytoscape software was utilized to construct a network of "herb-ingredient-target" and identify core targets. GO and KEGG pathway enrichment analyses were performed using R language software.
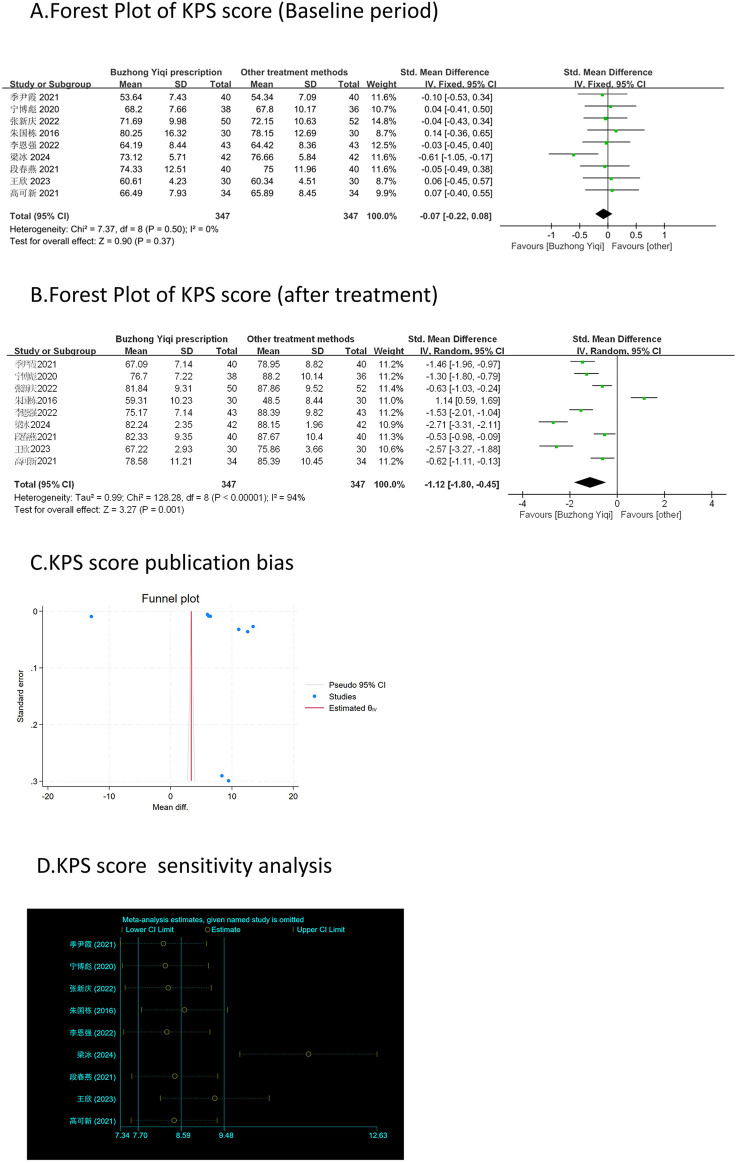
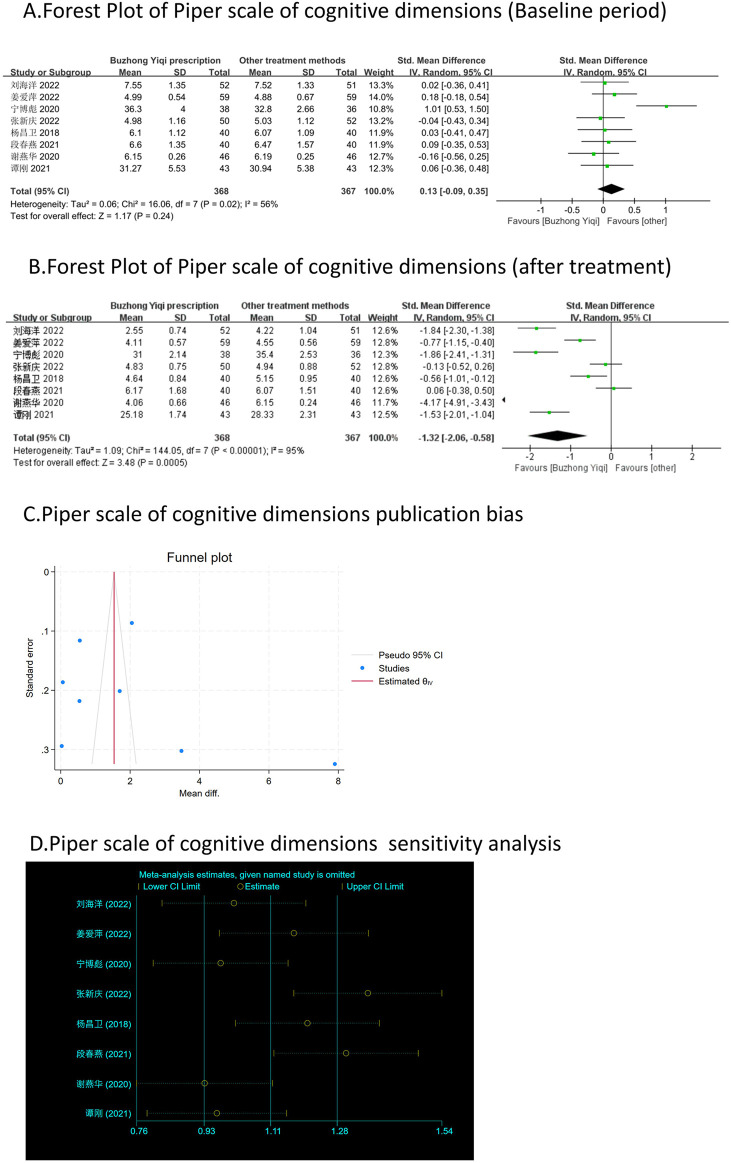
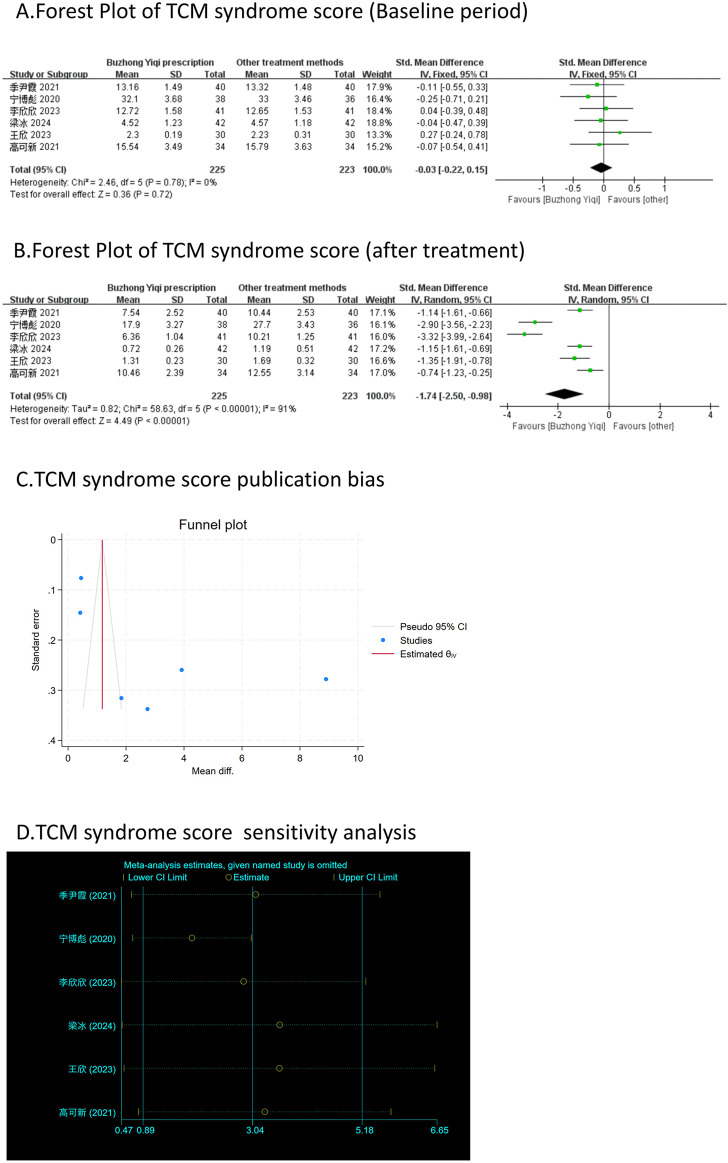
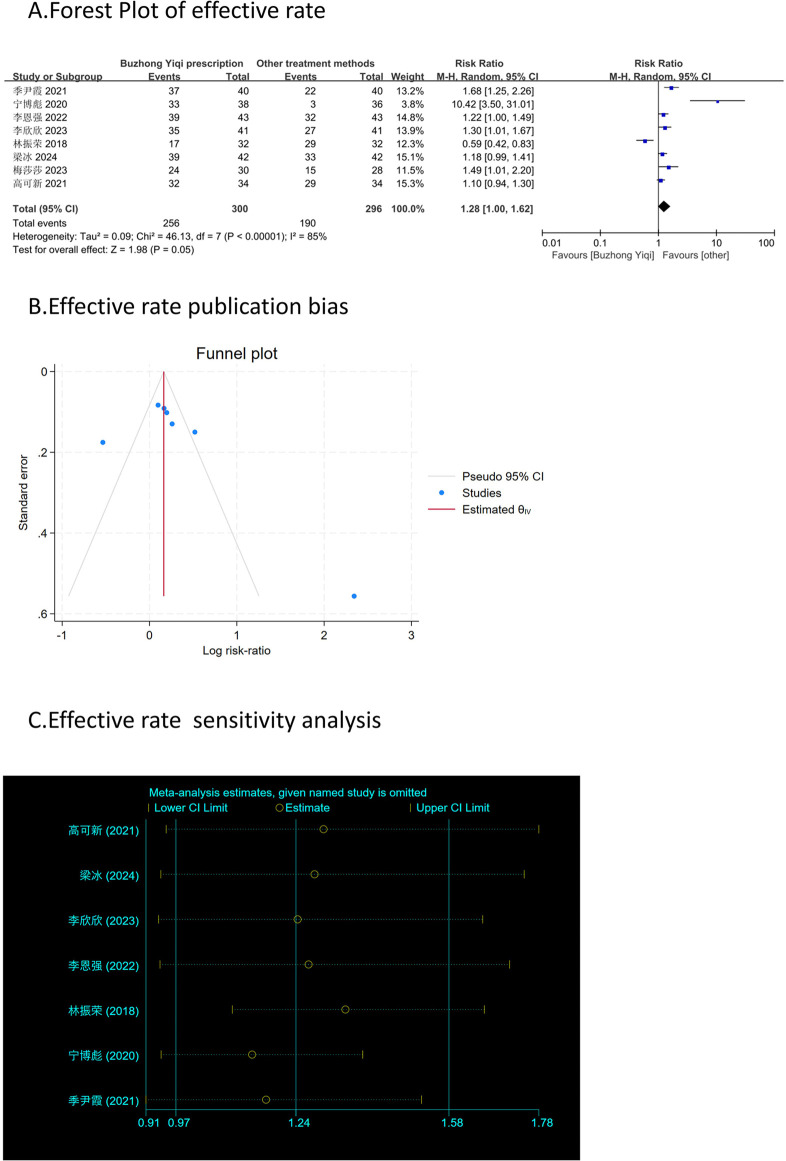
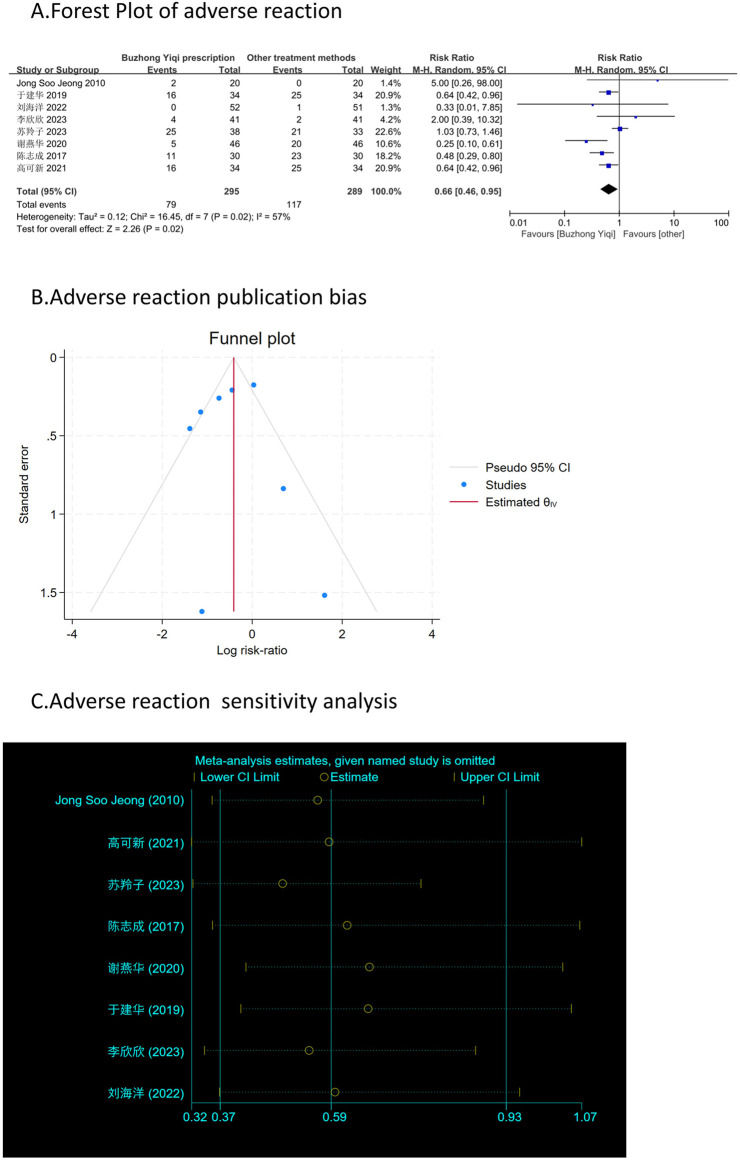
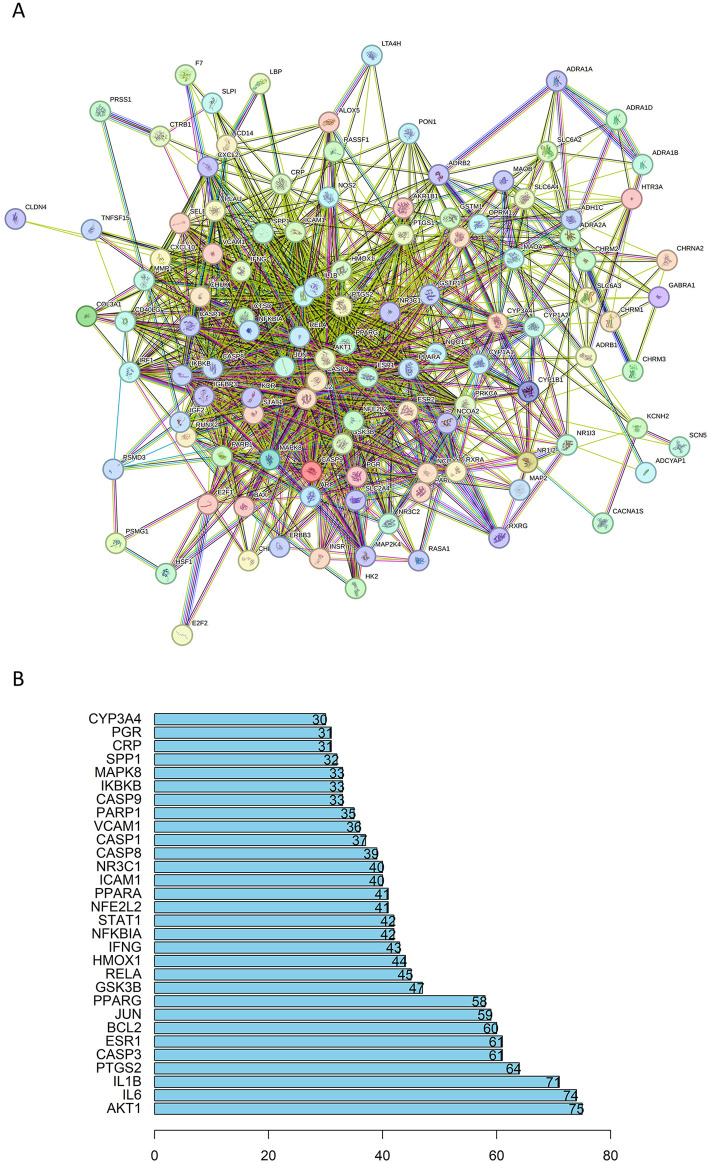
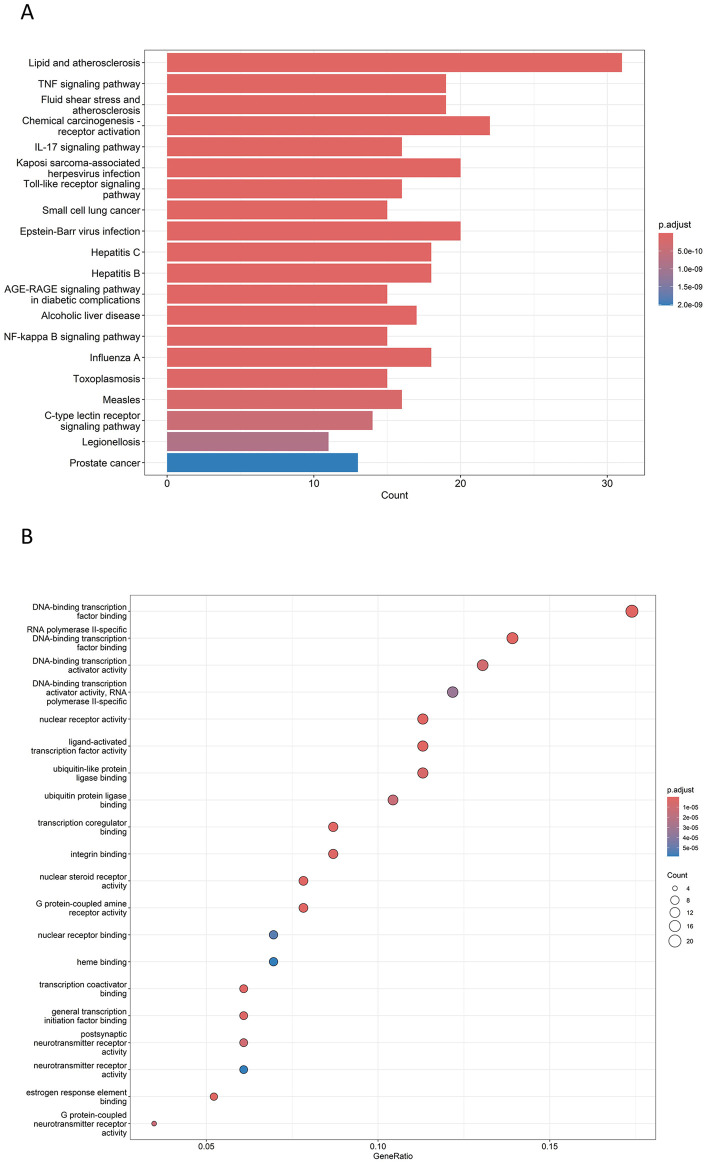
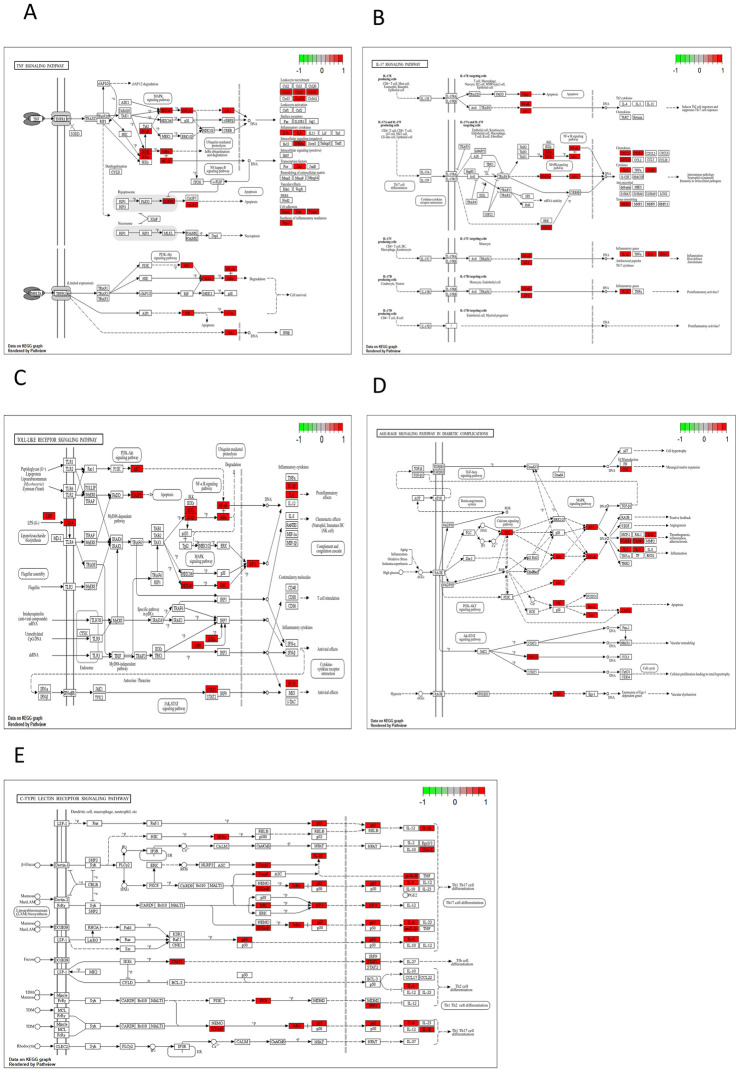
Results: In comparison to the control group, patients with CRF who received BZYQ prescription exhibited marked improvements in KPS score, QLQ-C30 quality of life score, and effective rate. Conversely, PFS, TCM syndrome score, and adverse reaction assessments significantly decreased. The primary active ingredients in its core drugs may exert a positive therapeutic effect on CRF by targeting molecules such as AKT1, IL6, IL1B, PTGS2, CASP3, ESR1, and BCL2, as well as through signaling pathways including TNF, IL17, TLR, NF-κB, and C-type lectin receptor.
Conclusion: BZYQ demonstrates significant efficacy in treating CRF with minimal adverse reactions. It can serve as a fundamental treatment for CRF in clinical practice, and the medication can be tailored to individual patients for personalized therapy. The potential pharmacological mechanism of BZYQ in treating CRF, as predicted by network pharmacology, offers a molecular foundation for clinical CRF treatment.
Systematic review registration: https://inplasy.com, identifier INPLASY202430025.
Keywords: Buzhong Yiqi; cancer-related fatigue; mechanism; meta-analysis; network pharmacology.
Copyright © 2024 Zeng, Wu, Meng and Wang.
Conflict of interest statement
The authors declare that the research was conducted in the absence of any commercial or financial relationships that could be construed as a potential conflict of interest.
Figures
Similar articles
-
Efficacy and safety of traditional Chinese medicine for cancer-related fatigue: a systematic literature review of randomized controlled trials.Chin Med. 2023 Nov 1;18(1):142. doi: 10.1186/s13020-023-00849-y. Chin Med. 2023. PMID: 37907925 Free PMC article. Review.
-
Effects of botanical drugs in the treatment of cancer-related fatigue in patients with gastric cancer: A meta-analysis and prediction of potential pharmacological mechanisms.Front Pharmacol. 2022 Sep 7;13:979504. doi: 10.3389/fphar.2022.979504. eCollection 2022. Front Pharmacol. 2022. PMID: 36160404 Free PMC article.
-
Mechanism of Bazhen decoction in the treatment of colorectal cancer based on network pharmacology, molecular docking, and experimental validation.Front Immunol. 2023 Sep 20;14:1235575. doi: 10.3389/fimmu.2023.1235575. eCollection 2023. Front Immunol. 2023. PMID: 37799727 Free PMC article.
-
[Huangqi Sijunzi decoction for treating cancer-related fatigue in breast cancer patients: a randomized trial and network pharmacology study].Nan Fang Yi Ke Da Xue Xue Bao. 2022 May 20;42(5):649-657. doi: 10.12122/j.issn.1673-4254.2022.05.04. Nan Fang Yi Ke Da Xue Xue Bao. 2022. PMID: 35673907 Free PMC article. Clinical Trial. Chinese.
-
Efficacy and mechanism of nourishing yin and purging fire therapy for central precocious puberty based on meta-analysis and network pharmacology.Medicine (Baltimore). 2023 Dec 1;102(48):e36395. doi: 10.1097/MD.0000000000036395. Medicine (Baltimore). 2023. PMID: 38050263 Free PMC article. Review.
Cited by
-
A Direct Relationship Between 'Blood Stasis' and Fibrinaloid Microclots in Chronic, Inflammatory, and Vascular Diseases, and Some Traditional Natural Products Approaches to Treatment.Pharmaceuticals (Basel). 2025 May 12;18(5):712. doi: 10.3390/ph18050712. Pharmaceuticals (Basel). 2025. PMID: 40430532 Free PMC article. Review.
References
Publication types
LinkOut - more resources
Full Text Sources
Research Materials
Miscellaneous