. 2022 Nov 25;14(4):968-987.
doi: 10.1080/20430795.2022.2148817. eCollection 2024.

International market exposure to sovereign ESG

Affiliations

International market exposure to sovereign ESG

Christian Morgenstern et al. J Sustain Financ Invest. .

Abstract

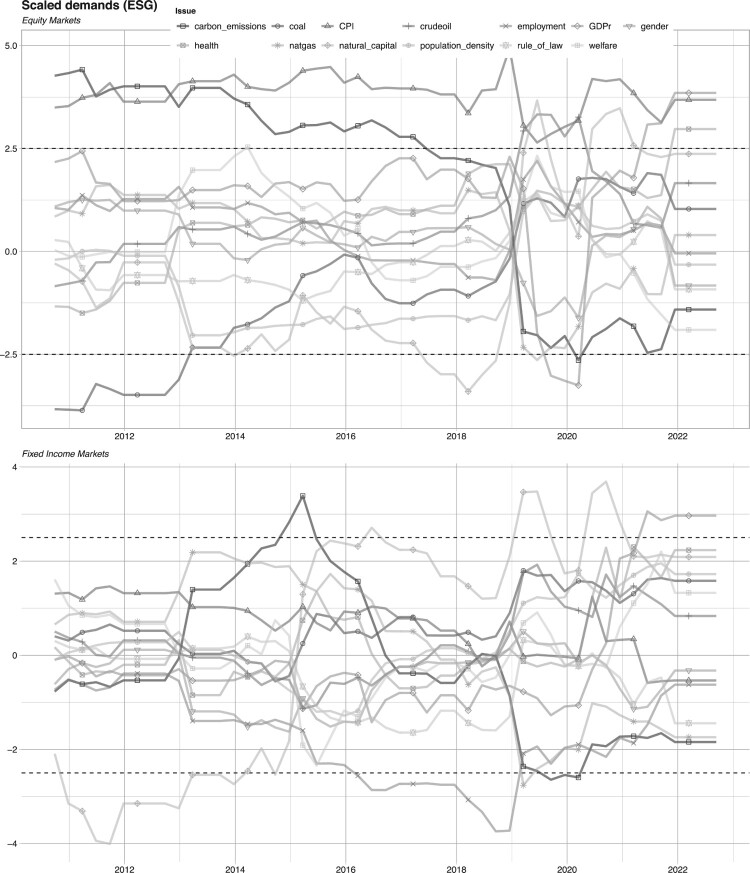
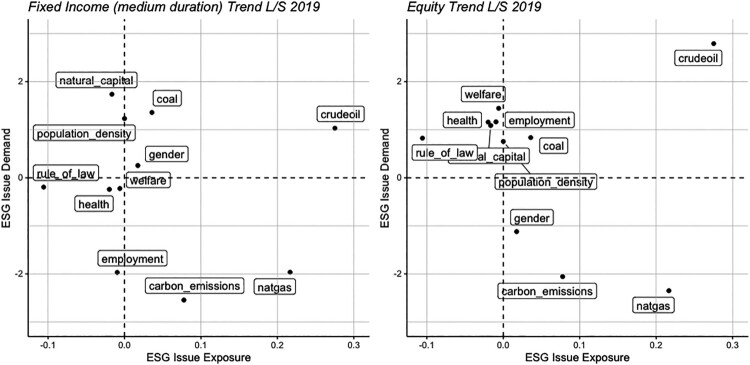
We quantify equity and bond market sensitivity to sovereign ESG scores and their variations which, theoretically, is equivalent to evaluating the demand for ESG at the global scale. We do so by estimating a longitudinal model, at the issue level, that captures exposures to sovereign ESG factors for both equity and fixed income indices. In spite of the surging interest in ESG investing, our results do not support a strong impact of ESG factors on the returns of international markets, implying that the demand for ESG at the country level is not a significant driver of prices. Nevertheless, we document a strong association between GDP growth and ESG scores at the country level.

Keywords: Factor demand; G11; H11; Q59; longitudinal models; sovereign ESG; sustainable investing.


Conflict of interest statement

No potential conflict of interest was reported by the author(s).

Figures

Figure 1.
Figure 1.
Heatmap of Country ESG scores.
Figure 2.
Figure 2.
Descriptive plots of the ESG scores. Notes: The panel on the left shows a boxplot of scores at the issue level. The panel on the right shows histograms, scatterplots and correlations of E, S & G pillar values across countries and years.
Figure 3.
Figure 3.
Baseline estimates and macroeconomic controls. Notes: We plot the time-series of t-statistics in fixed-effect panel models (Equation (1)) run on 10 years of data, at the pillar level. The panel on the left shows the analysis for fixed income markets while the one on the right pertains to equity markets. The horizontal dashed lines mark the 99% threshold for the significance of the coefficients. The bottom set of plots include macroeconomic controls as defined in model (2).
Figure 4.
Figure 4.
Analysis at issue level for equity & fixed income markets with macro variables. Notes: We plot the time-series of t-statistics in fixed-effect panel models (Equation (2)) estimated on 10 years of data, at the issue level. The panel on the top shows the analysis for equity markets while the one on the bottom pertains to fixed income markets. The horizontal dashed lines mark the 99% threshold for the significance of the coefficients.
Figure 5.
Figure 5.
Latent demand distribution & R2 for equity & fixed income markets with macro variables. Notes: We plot the quantiles of the fixed effects in the panel models (Equation (2)) estimated on 10 years of data, at the issue level. The left hand top plot pertains to fixed income markets, the left hand bottom plot relates to equity markets and the right hand plot displays the R2 of the models over time.
Figure 6.
Figure 6.
Time-series of cumulative returns. Notes: The strategy is given by Equation (6). Trading starts on 2011-01-03 and ends on 2021-02-05. Trend_Long_Short is the original strategy from Morgenstern, Coqueret, and Kelly (2021) (i.e. with ω=0), while Trend_LS_plus_Demand pertains to the case ω=1/2. The top plot provides cumulative returns, the middle plot provides daily returns and the bottom plot provides the drawdown profiles of the strategies.
Figure 7.
Figure 7.
Sustainability demand versus sustainability score. Notes: We locate both items in the plane for fixed income (left panel) and equity (right panel) components of the long-short trend following strategy of Section 5.1. The y-axis pertains to standard estimates from the baseline model of Equation (2). The x-axis is the weighted score of the strategy (each asset, via its country has a score which is aggregated at the portfolio level via its weight in the portfolio). The snapshot corresponds to December 2019. All components are sorted positively towards sustainability: a high crude oil score means low production and consumption of oil.

References

    1. Abhayawansa, S., and Tyagi S.. 2021. “Sustainable Investing: The Black Box of Environmental, Social, and Governance (ESG) Ratings.” Journal of Wealth Management 24 (1): 49–54.
    1. Angelova, D., Bosello F., Bigano A., and Giove S.. 2021. “Sovereign Rating Methodologies, ESG and Climate Change Risk: An Overview.” SSRN Working Paper 3841948.
    1. Avci, S. B., and Esen G.. 2021. “Country-Level Sustainability and Cross-Border Banking Flows.” SSRN Working Paper 3795642.
    1. Avramov, D., Cheng S., Lioui A., and Tarelli A.. 2022. “Sustainable Investing with ESG Rating Uncertainty.” Journal of Financial Economics 145 (2): 642–664.
    1. Balduzzi, P., and Moneta F.. 2017. “Economic Risk Premia in the Fixed-Income Markets: The Intraday Evidence.” Journal of Financial and Quantitative Analysis 52 (5): 1927–1950.

LinkOut - more resources