. 2024 Nov 19;8(11):e70055.
doi: 10.1002/hem3.70055. eCollection 2024 Nov.

A single-chain variable fragment-based bispecific T-cell activating antibody against CD117 enables T-cell mediated lysis of acute myeloid leukemia and hematopoietic stem and progenitor cells

Affiliations

A single-chain variable fragment-based bispecific T-cell activating antibody against CD117 enables T-cell mediated lysis of acute myeloid leukemia and hematopoietic stem and progenitor cells

Laura Volta et al. Hemasphere. .

Abstract

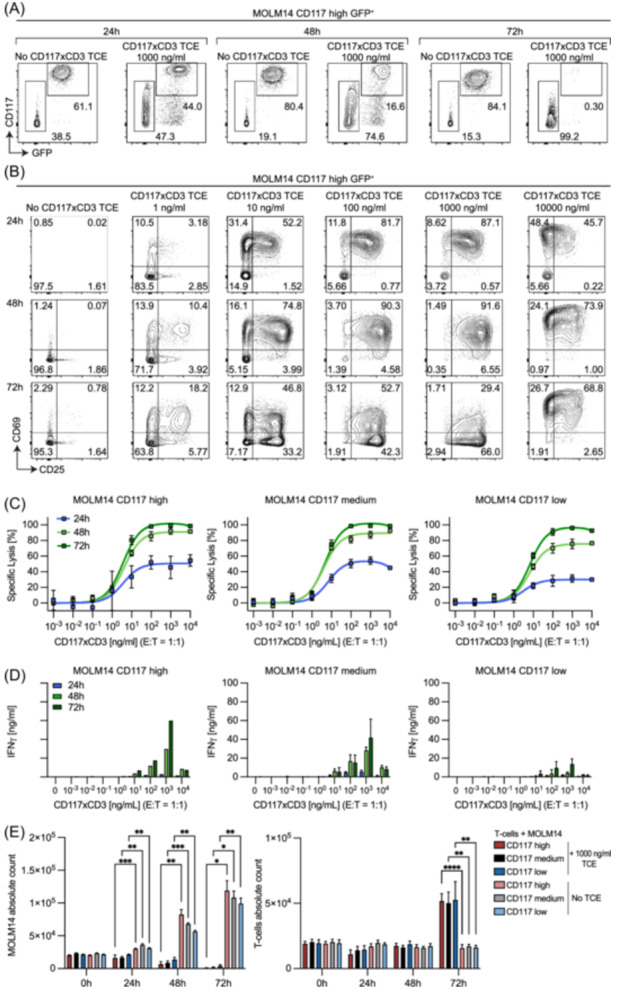
Acute myeloid leukemia (AML) derives from hematopoietic stem and progenitor cells (HSPCs). To date, no AML-exclusive, non-HSPC-expressed cell-surface target molecules for AML selective immunotherapy have been identified. Therefore, to still apply surface-directed immunotherapy in this disease setting, time-limited combined immune-targeting of AML cells and healthy HSPCs, followed by hematopoietic stem cell transplantation (HSCT), might be a viable therapeutic approach. To explore this, we generated a recombinant single-chain variable fragment-based bispecific T-cell engaging and activating antibody directed against CD3 on T-cells and CD117, the surface receptor for stem cell factor, expressed by both AML cells and healthy HSPCs. Bispecific CD117xCD3 targeting induced lysis of CD117-positive healthy human HSPCs, AML cell lines and patient-derived AML blasts in the presence of T-cells at subnanomolar concentrations in vitro. Furthermore, in immunocompromised mice, engrafted with human CD117-expressing leukemia cells and human T-cells, the bispecific molecule efficiently prevented leukemia growth in vivo. Additionally, in immunodeficient mice transplanted with healthy human HSPCs, the molecule decreased the number of CD117-positive cells in vivo. Therefore, bispecific CD117xCD3 targeting might be developed clinically in order to reduce CD117-expressing leukemia cells and HSPCs prior to HSCT.


Conflict of interest statement

Jonathan D. Kiefer, Renier Myburgh, Dario Neri, and Markus G. Manz are inventors in patent applications that describe the anti‐CD117xCD3 TCE. The commercialization rights/plans for this patent are overseen and regulated by the Technology Transfer Office of the University of Zurich and ETH Zürich, which granted an exclusive license to ATLyphe (www.atlyphe.com). Renier Myburgh, Jonathan D. Kiefer, Norman F. Russkamp, Danielle Villars, Dario Neri/Philogen, and Markus G. Manz are shareholders of ATLyphe. All other authors declare no conflict of interest.

Figures

Figure 1
Figure 1
CD117 antigen expression on primary AML samples at diagnosis, on healthy BM HSPCs and mast cells, and on CD117 expressing MOLM cells. (A) Representative gating strategy for analyzing CD117 expression on healthy donor BM mast cells, B‐cell progenitors, and HSPCs by flow cytometry. Data clean‐up includes time gating, doublet exclusion, and debris removal. A CD45/SSC plot is used to discriminate CD45dim cells. After excluding B‐cell progenitors (CD45dimCD19+CD34+/−), cells were further discriminated into CD45dimCD34+CD38 HSPCs and more differentiated CD45dimCD34+CD38+ HSPCs. Mast cell and HSPC gating presented as large dots. (B) Representative gating strategy to analyze CD117 expression on AML blasts from bone marrow (BM) aspirate (top) and peripheral blood (PB) samples (bottom) from two AML patients at diagnosis. Sequential gating includes time gating, doublet exclusion, and debris removal. CD15+ granulocytes and CD19+ cells are excluded before gating CD45dim blast cells based on CD45 expression and SSC. The CD45dim blast population was subsequently divided into two sub‐populations, based on CD45 expression: CD45dim,higher and CD45dim,lower. (C) CD117 median fluorescence intensity (MFI) with interquartile range on total CD45dim blasts in AML patient samples (total n = 69) collected from PB (n = 18) and BM (n = 51). Statistical analysis was conducted using an unpaired t‐test. (D) Median CD117 expression and interquartile range on CD45dim,higher and CD45dim,lower blast populations from AML patient samples. Statistical analysis was conducted using paired t‐test. (E) Within the same AML sample, CD117 MFI was compared between CD45dim,higher and CD45dim,lower populations. A total of 23 patients had rather higher CD117 MFI on CD45dim,lower cells (left), while 46 patients had higher or similar CD117 MFI on CD45dim,higher cells (right). (F) Median CD117 expression and interquartile range on malignant cells (Kasumi‐1, HL60 CD117 low, HL60 CD117 high, MOLM14 CD117 low, MOLM14 CD117 high, AML patient CD45dim blasts) and on healthy BM populations (B‐cell progenitors, CD34+CD38 HSPCs, CD34+CD38+ HSPCs and mast cells) (n = 11 healthy BM samples). Dashed horizontal lines indicate the CD117 MFI of MOLM14 CD117 low and MOLM14 CD117 high cells, measured using the same machine and settings as the patient samples and healthy donor BM samples. (G, H) CD117 MFI and interquartile range according to the mutational status of NPM1 and FLT3 in AML patient cells (G) and ELN Risk group 2017 (H). Statistical analysis was conducted using one‐way ANOVA with Tukey's multiple comparisons test. (I) Calculated degree of linear correlation (Pearson's r) from the log10 transformed MFI and its statistical probability (p‐value) to assess the relationship between the CD117 MFI and CD34 MFI (left), CD38 MFI (middle), and CD33 MFI (right) on total CD45dim blast populations from AML patients. (CI) AML sample 1, used for both in vitro and in vivo experiments, was denoted in red.
Figure 2
Figure 2
Cloning, expression, and characterization of the bispecific CD117xCD3 TCE. (A) Schematic representation of the arrangement of the CD117xCD3 TCE. The anti‐CD117 antibody 79D was cloned in the chain order VL79D‐Linker‐VH79D and genetically fused to the anti‐CD3 antibody OKT3 in the order VHOKT3−VLOKT3 without a C‐terminal hexa histidine‐tag. (B) Schematic representation of the CD117xCD3 TCE. The N‐terminus of the fusion protein is indicated as N’. (C) Mass spectrometric analysis of the purified product, native and treated with PNGase, showed a product of 54,090 and 52,642 Da, indicating a single N‐glycosylation of 1448 Da, thus confirming the theoretical weight of 52,652 Da. (D) Purified CD117xCD3 TCE exhibited migration at the expected (monomeric) size of ~55 kDa in SDS‐PAGE gel. M, Marker, NR, non‐reducing conditions; R, reducing conditions. (E) Representative size exclusion chromatography profile of the CD117xCD3 TCE. (F) Binding of the CD117xCD3 TCE to recombinant human target antigen CD117 in a Biacore experiment at the indicated concentrations. (G) Binding of the CD117xCD3 TCE to recombinant human target antigen CD3 in a Biacore experiment at the indicated concentrations. (H, I) Quantitative pharmacokinetic study of CD117xCD3 TCE. Mice were injected i.v. (H) and i.p. (I) with 25 μg of CD117xCD3 TCE. Blood was taken at different time points and serum concentrations of CD117xCD3 TCE were measured by ELISA (mean ± SD from n = 2 mice per time‐point, analyzed in duplicate wells). Half‐life (t 1/2) and the highest concentration in blood (C max) are reported on the graph.
Figure 3
Figure 3
CD117xCD3 TCE elicits T‐cell proliferation, IFN‐γ and IL‐2 cytokine secretion, and immune‐phenotypic activation in presence but not in absence of CD117‐expressing target cells. (A) Graph depicting average absolute cell counts at the start (time zero) of the in vitro co‐culture experiment. Peripheral blood mononuclear cells (PBMCs) isolated from three healthy donors were combined with MOLM cells at a 1:1 ratio, resulting in a 1:3 between T‐cells within the PBMC fraction to MOLM cells. (B) Time‐dependent (24, 48, and 72 h) specific lysis of MOLM14 GFP+CD117high and control MOLM14 WT (CD117neg) cells, induced by addition of 1000 ng/mL CD117xCD3 TCE in combination with PBMCs. Data are shown as mean ± SD from duplicates of each donor. Statistical analysis was conducted using two‐way analysis of variance (ANOVA) with Tukey's multiple comparisons test; *p < 0.5, **p < 0.01. (C) Absolute count of the MOLM14 WT and MOLM14 GFP+CD117high cells (left panel) and T‐cells (right panel) in the presence and absence of TCE. Statistical analysis was conducted using two‐way ANOVA with Tukey's multiple comparisons test; *p < 0.05, **p < 0.01. (D) IFN‐γ and IL‐2 concentrations in the supernatants of co‐cultures at 48 h shown in (AC). Data are shown as mean from duplicates of each donor ±SD. Statistical analysis conducted with two‐way ANOVA with Tukey's multiple comparison test; ****p < 0.0001. (E) Representative example of pre‐gated CD3+ T‐cell proliferation within the PBMC fraction at 48 h in the indicated conditions by means of CellVue Far‐Red dye dilution. (F) Representative flow cytometry plots at 48 h of co‐culture, gated on the CD4+ and CD8+ T‐cell subsets, showing the activation markers CD69 and CD25 expression on the respective T‐cell populations. (G) Quantification of T‐cell activation status at indicated time points (0, 24, 48, 72 h) highlighting the relative proportions of CD69+/− and CD25+/− CD4+ T‐cells and CD8+ T‐cells.
Figure 4
Figure 4
CD117xCD3 TCE mediates T‐cell cytotoxicity against healthy HSPCs. (A) Outline of the experimental setup. Human healthy‐donor‐derived BM mononuclear cells (MNCs) were purchased as frozen material and cultured in vitro in the presence or absence of CD117xCD3 TCE for up to 72 h. Panel created using Biorender.com. (B) Representative flow cytometry plots showing healthy donor bone marrow mononuclear cells, co‐cultured with and without 1000 ng/mL CD117xCD3 TCE after 48 h of culture. The gating strategies used to analyze target cells are denoted by the arrows, and the relative frequencies of cells within each plot are shown as percentages. (C) Quantification of percentage specific lysis of CD45dimCD34+CD117+ HSPCs at indicated time‐points. Three healthy bone marrow donors were plated in triplicate wells (mean ± SD). (D) Quantification of IFN‐γ in the supernatants at indicated time points. Data from three healthy donors (as in panel C), analysis performed in triplicate (mean ± SD). Statistical analysis was performed by one‐way ANOVA with Šidák's multiple comparisons test (*p < 0.05, **p < 0.01). (E) Representative flow cytometry plots showing healthy donor BM MNCs pre‐gated on CD45 high, co‐cultured with and without 1000 ng/mL CD117xCD3 TCE for 48 h. Arrows indicate the subsequent gating sequences for CD3+ effector cell analysis; the relative proportions of cells within a plot are indicated as percent.
Figure 5
Figure 5
CD117xCD3 TCE elicits T‐cell cytotoxicity against human MOLM14 AML cells in a TCE concentration‐dependent, target antigen‐density‐dependent and time‐dependent manner. (A) Representative flow cytometry analyses at three subsequent time points (24, 48, 72 h), showing the relative proportions of MOLM14 CD117high GFP‐positive target cells and healthy donor‐derived T‐cells. Conditions with and without 1000 ng/mL CD117xCD3 TCE added into the co‐culture were compared as indicated. (B) Representative flow cytometry analyses of T‐cell activation at indicated time points (24, 48, 72 h), showing the relative proportions of CD69+/− and CD25+/− T‐cells (pre‐gated on CD3+ cells). Indicated concentrations of CD117xCD3 TCE were compared to conditions with no CD117xCD3 TCE added. (C) Quantification of percentage specific lysis of MOLM14 CD117high, CD117medium, and CD117low cells as a function of CD117xCD3 TCE concentration added to co‐cultures. Data from three T‐cell donors, experiment performed in duplicate wells (mean ± SD). (D) Quantification of IFN‐γ in the supernatants of co‐cultures from (C). (E) Absolute cell counts of MOLM14 cells (expressing various CD117 levels as indicated, left panel) and of effector T‐cells (right panel) in presence or absence of 1000 ng/mL TCE. Statistical analysis was conducted using two‐way ANOVA with Tukey's multiple comparisons test; *p < 0.05; **p < 0.01; ***p < 0.001; ****p < 0.0001.
Figure 6
Figure 6
Comparison of lysis dynamics between anti‐CD117 CAR‐T cells and CD117xCD3 TCE and T‐cells using time‐lapse imaging. (A) Percentage of specific lysis of MOLM14 GFP+ CD117high cells after 24 and 48 h in co‐culture with anti‐CD117 CAR T‐cells or T‐cells from two matched donors plus 1000 ng/mL CD117xCD3 TCE. Cells were cocultured at an E:T = 1:1, two independent experiments from two CAR T‐cell and T‐cell matched healthy donors are shown. (B) Workflow of the time‐lapse imaging pipeline to study effector‐target cell interactions. Cells were co‐cultured at an E:T = 1:1 for up to 72 h on microgrids glued to chamber slides to allow for quantification of single attachment and lysis events. After meeting standard criteria (i.e., appropriate movie quality allowing for cell traceability and high cell viability of target and effector cells over the course of imaging) individual time‐lapse movies in which both target and effector cells were successfully plated in an E:T‐ratio of 3:1 to 1:3 were chosen for final analysis. Panel created using Biorender.com (C) Representative time‐lapse images of MOLM14 GFP+ CD117high cells (grey) co‐incubated with direct anti‐CD117 CAR T‐cells or T‐cells (effector cells in red) with CD117xCD3 TCE (1000 ng/mL). Target cell lysis was marked by propidium iodide (PI) influx (green). Time to PI influx was further divided into two components: the time to sustained effector‐target cell attachment and time from attachment to target cell lysis. (D) Effector‐target‐cell interactions were analyzed and quantified in >170 independent wells using time‐lapse imaging and experimental data were pooled from two different matched healthy donors. Co‐incubation of MOLM14 GFP+ CD117high cells with T‐cells and CD117xCD3 TCE (1000 ng/mL) led to similar attachment rates to target cells within 24 h when compared to anti‐CD117 CAR T‐cells (left panel). Tracking of successful attachment events showed significantly faster attachment to MOLM14 GFP+ CD117high cells with CD117xCD3 TCE (right panel). For the fraction of attached cells, Chi2‐test was used to determine p values; p values for time to attachment were determined by unpaired Student's t‐test; **p < 0.01. (E) After successful target‐cell engagement, target‐cell lysis was tracked in >150 individual wells. Anti‐CD117 CAR T‐cells lysed significantly more often when compared to CD117xCD3 TCE. In wells containing >1 target cell, anti‐CD117 CAR T‐cells significantly more frequently lysed multiple target cells when compared to CD117xCD3 TCE with T‐cells (left panel). Time from attachment to target‐cell lysis did not differ between both groups (right panel). For the fraction of lysed cells, Chi2‐test was used to determine p values; p value for time to killing was determined by unpaired Student's t‐test; ***p < 0.001; ****p < 0.0001.
Figure 7
Figure 7
T‐cells derived from AML patients in first remission lyse MOLM14 cells and primary AML cells with similar efficacy as healthy donor T‐cells upon activation with CD117xCD3 TCE. (A) Percentage specific lysis of MOLM14 CD117high cells by T‐cells upon addition of 1000 ng/mL CD117xCD3 TCE at 24, 48, and 72 h. Cells were cocultured at an E:T = 1:1, and the experiment was performed in duplicate wells (mean ± SD). Data from three healthy‐donor‐derived T‐cells and five AML‐patient‐derived T‐cells isolated at first remission after AML diagnosis. (B) Absolute count of the target cells (left panel) and effector cells (right panel) in the presence and absence of TCE from the experiment shown in (A). (C) Quantification of IFN‐γ in the supernatant from experiments depicted in (A, B). (DF) Same experimental setup and analysis as in (AC) but with the use of MOLM CD117 low target cells. (G) Percentage specific lysis of CD45dimCD3 AML blasts from four AML patients (AML #1, 2, 3, 4) by T‐cells at indicated time‐points following the addition of 1000 ng/mL CD117xCD3 TCE. Cells from each AML patient were co‐cultured with T‐cells from healthy donors (n = 3) and from AML patients collected at first remission after AML diagnosis (n = 3). The experiment was performed in duplicate wells, and the data is presented as the mean of the T‐cell‐mediated lysis against the same AML patient blasts ± SD. (H) Absolute count of the target cells (left panel) and effector cells (right panel) in the presence and absence of TCE from the experiment shown in (G). (I) Quantification of IFN‐γ in the supernatant of experiment in (G, H). (A–I) Statistical analysis was conducted using two‐way ANOVA with Tukey's multiple comparison test; *p < 0.05; **p < 0.01; ***p < 0.001.
Figure 8
Figure 8
T‐cells in combination with CD117xCD3 TCE elicit similar strong cytotoxicity against MOLM14 AML cells as CD117‐CAR T‐cells in a therapeutic, low disease‐burden setting in vivo in NSG mice. (A) Schematic outline of the experimental setup. NSG mice were sublethally irradiated (100 cGy) and i.v. injected with 105 GFP+Luc+CD117high MOLM14 cells. The following day, mice received either PBS, 107 anti‐CD117 CAR T‐cells, or 107 T‐cells i.v., the latter with or without 12.5 μg CD117xCD3 TCE i.p. injection every 12 h (n = 4). A second injection of 107 T‐cells was performed in T‐cell‐transferred mice on Day 7. (B) Bioluminescence imaging (BLI) of MOLM14 engraftment at Days 7, 11, 14, and 18 after transplantation in mice treated as indicated. (C) Quantification of the bioluminescence flux of whole‐body imaging of mice over at indicated time‐points. Statistical analysis was conducted using two‐way ANOVA with Tukey's multiple comparisons test (*p < 0.05, ***p < 0.001). (D) Absolute GFP+ MOLM14 cell count in blood, spleen, and bone marrow of one femur each at terminal analysis. Statistical analysis was performed by one‐way ANOVA with Tukey's multiple comparisons tests (*p < 0.05, **p < 0.01, ***p < 0.001, ****p < 0.0001). (E) Representative flow cytometry plots of live cells from BM of indicated experimental groups.
Figure 9
Figure 9
T‐cells in combination with CD117xCD3 TCE elicit cytotoxicity against primary human AML cells in a murine xenograft model. (A) Schematic experimental setup. Sublethally (100 cGy) irradiated NSG mice were i.v. engrafted with 5 × 106 CD3/CD19 double‐depleted PB cells isolated from a primary AML patient (PID 1). Four days later, indicated mice were injected i.v. with PBS or 107 T‐cells. Subsequently, an indicated subgroup of mice was i.p. injected twice daily with 12.5 μg CD117xCD3 TCE until Day 15. (B) Absolute counts of AML cells (hCD45dim) in blood, spleen, and BM of a single femur per mouse in indicated groups at terminal analysis. Statistical analysis was conducted using one‐way ANOVA with Tukey's multiple comparisons test; *p < 0.05, **p < 0.01. (C) Representative flow cytometry plots of live cells from BM at terminal analysis for each experimental group. Gating sequence is indicated by arrows and percentages of cells in the respective plots are shown.
Figure 10
Figure 10
CD117xCD3 TCE in combination with T‐cells mediate human CD117 + HSPCs lysis in humanized mice. (A) Schematic outline of the experimental setup. Sub‐lethally irradiated NSG mice (100 cGy) were engrafted i.v. with 2 × 106 CD34‐selected mobilized peripheral blood HSPCs (M‐PB HSPCs) from healthy donor 3. At Week 7 after cell inoculation, human chimerism was assessed in peripheral blood by flow cytometry. One week later, two representative cohort mice were terminally analyzed to assess human engraftment in the thymus and bone marrow. At Week 9, 107 T‐cells isolated from the M‐PB HSPC donor 3 were injected i.v. Subsequently, 12.5 μg CD117xCD3 TCE was administered i.p. every 12 h for 10 days. (B) Percentages of all human CD45+ cells (left) and human lineage antigen expression on cells (right) in peripheral blood 7 weeks after transplantation. Each symbol represents an individual mouse. (C) Human T‐cell analysis in the thymus from a representative mouse 8 weeks after transplantation. (D) Representative flow cytometry plots of BM cells isolated from a single femur of a mouse 8 weeks after transplantation. Sequential gating is indicated. (E) Representative flow cytometry plots of live cells from BM at terminal analysis for each experimental group. The sequence of gating is shown in the top row. (F) Percentages of lymphoid and myeloid cells in the peripheral blood of treated and untreated mice at terminal analysis. Statistical analysis was performed using one‐way ANOVA; ****p < 0.0001. (G) Percentages of all human CD45+ cells (left) in the bone marrow from a femur and absolute counts of lymphoid and myeloid cells (middle) and progenitors (right). Statistical analysis was performed using one‐way ANOVA; *p < 0.05, **p < 0.01.

References

    1. Orkin SH, Zon LI. Hematopoiesis: an evolving paradigm for stem cell biology. Cell. 2008;132:631‐644. - PMC - PubMed
    1. Bonnet D, Dick JE. Human acute myeloid leukemia is organized as a hierarchy that originates from a primitive hematopoietic cell. Nat Med. 1997;3:730‐737. - PubMed
    1. Trumpp A, Haas S. Cancer stem cells: the adventurous journey from hematopoietic to leukemic stem cells. Cell. 2022;185:1266‐1270. - PubMed
    1. van der Lee DI, Reijmers RM, Honders MW, et al. Mutated nucleophosmin 1 as immunotherapy target in acute myeloid leukemia. J Clin Invest. 2019;129:774‐785. - PMC - PubMed
    1. Xue S‐A, Gao L, Hart D, et al. Elimination of human leukemia cells in NOD/SCID mice by WT1‐TCR gene–transduced human T cells. Blood. 2005;106:3062‐3067. - PubMed

LinkOut - more resources