. 2024 Nov 14:17:8753-8773.
doi: 10.2147/JIR.S488400. eCollection 2024.

Exploring and Validating the Mechanism of Ulinastatin in the Treatment of Sepsis-Associated Encephalopathy Based on Transcriptome Sequencing

Affiliations

Exploring and Validating the Mechanism of Ulinastatin in the Treatment of Sepsis-Associated Encephalopathy Based on Transcriptome Sequencing

Wen Hu et al. J Inflamm Res. .

Abstract

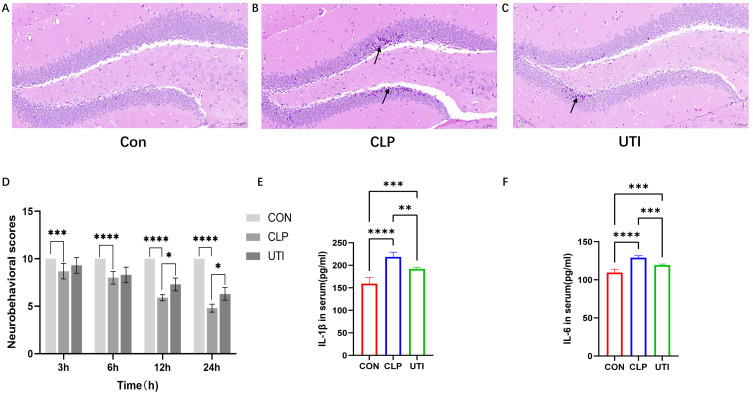
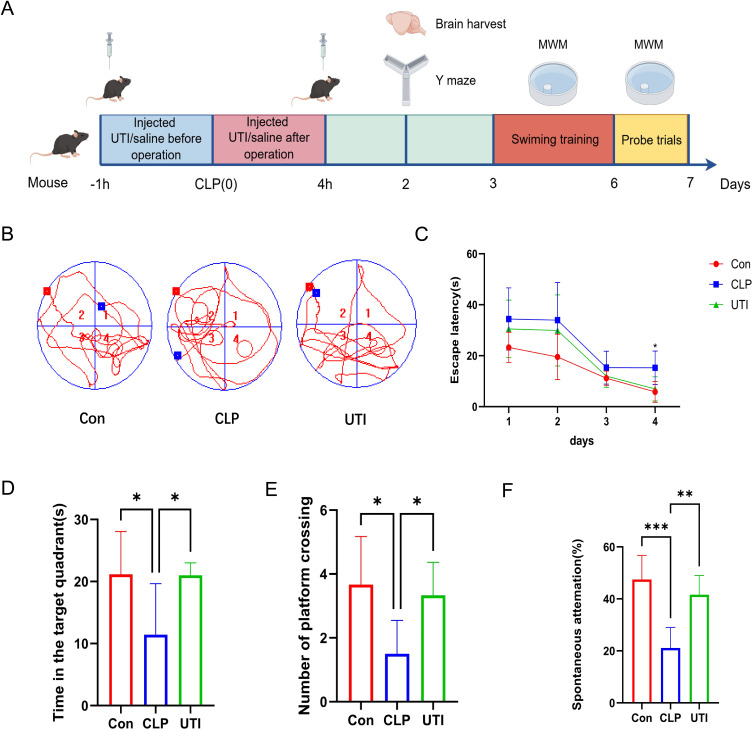
Purpose: Sepsis can induce sepsis-associated encephalopathy (SAE), with Ulinastatin (UTI) serving a critical anti-inflammatory role. This study aimed to identify the hub genes in an SAE mouse model following UTI intervention and investigate the underlying molecular mechanisms.

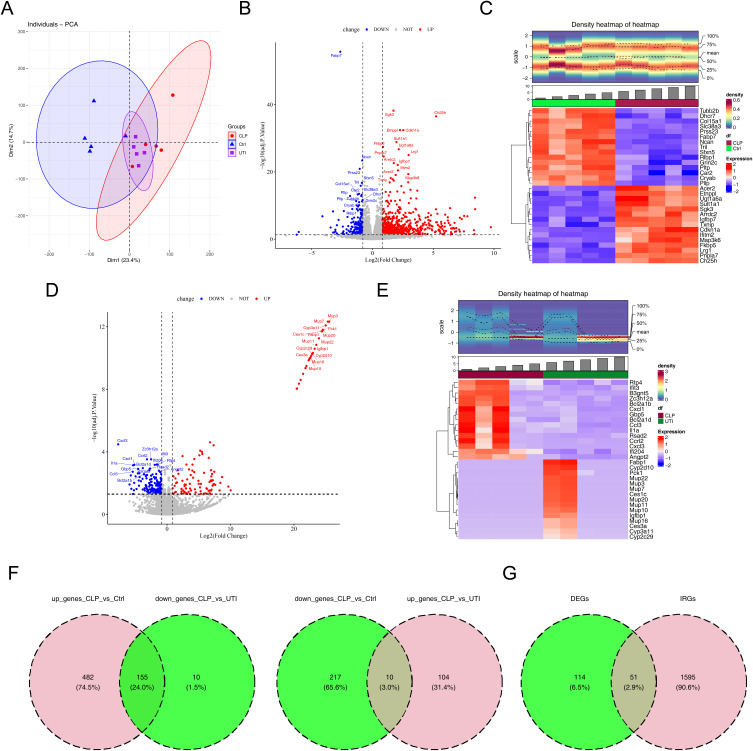
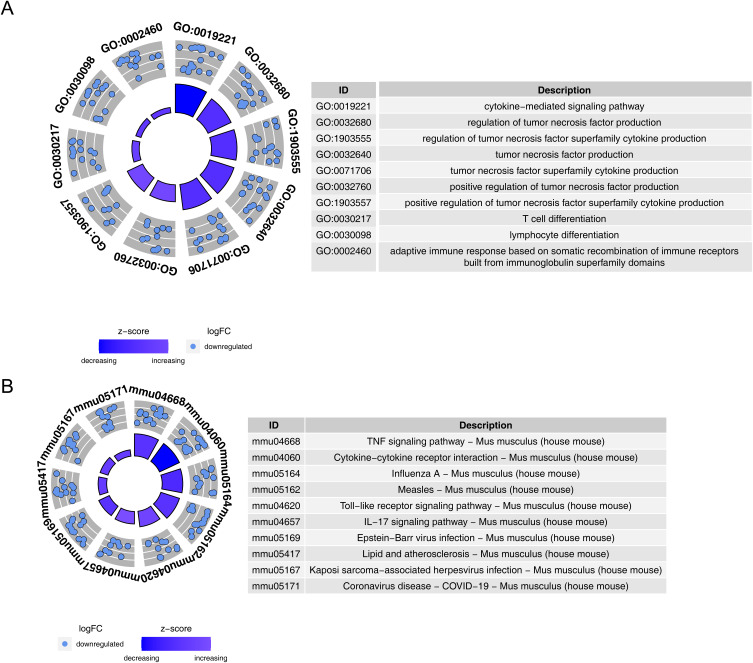
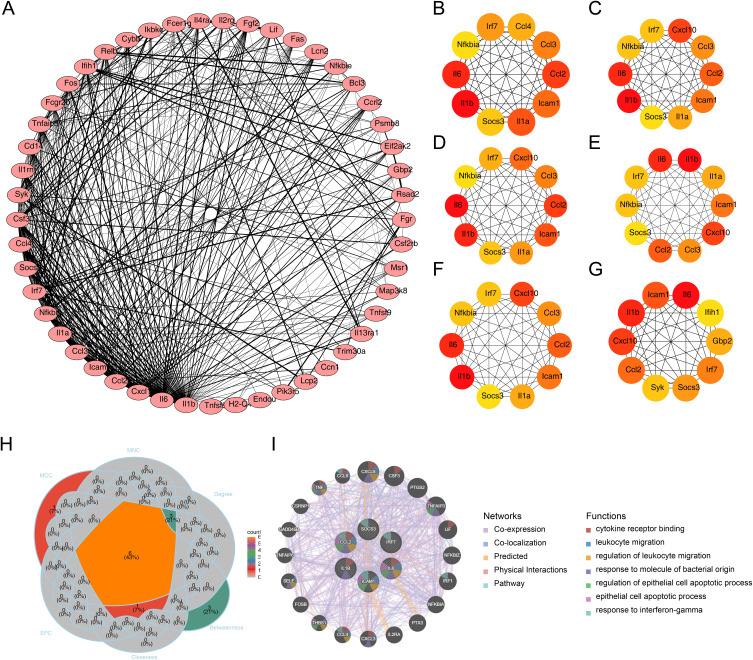
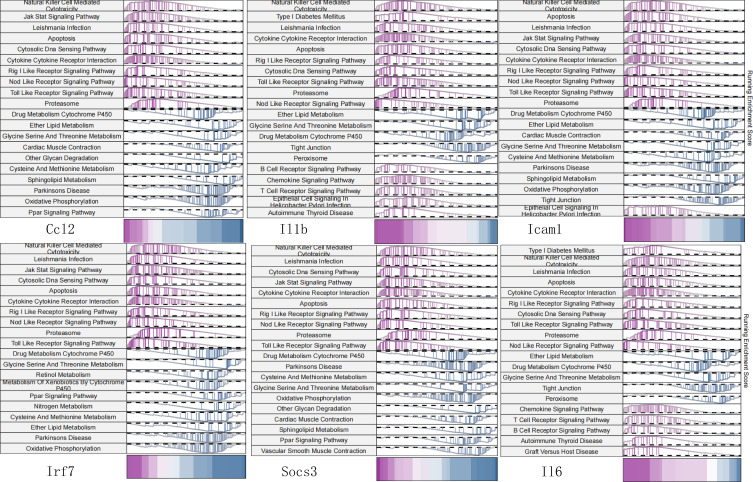
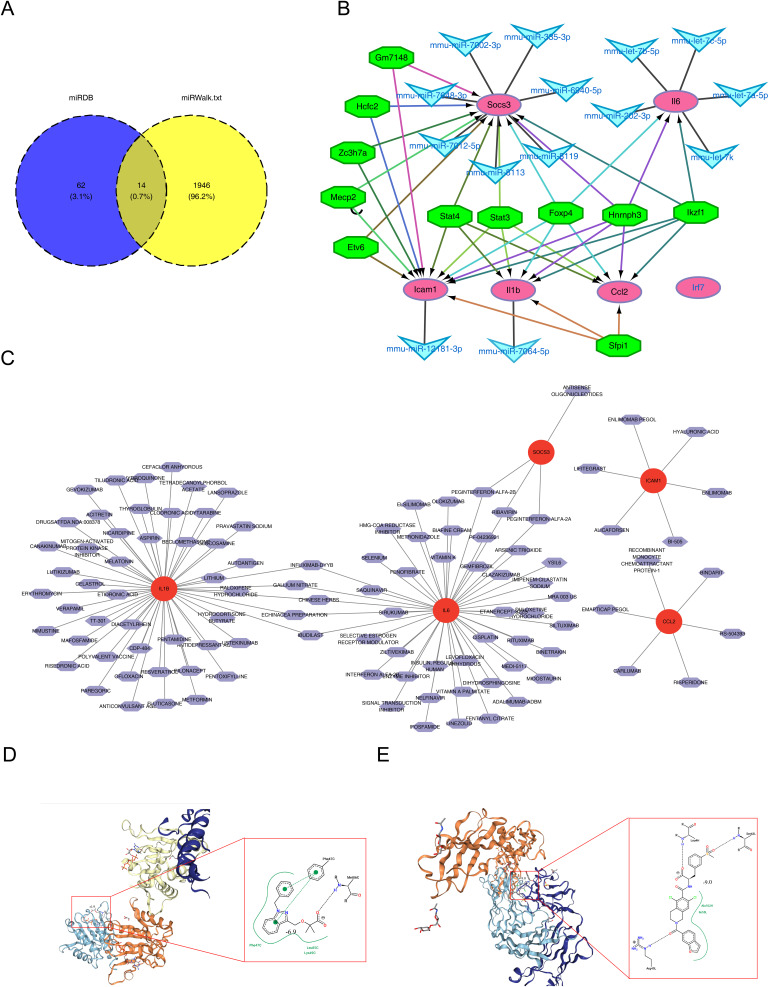
Materials and methods: Through differential expression analysis to obtain differentially expressed genes (DEGs), ie, UTI vs CLP (DEGs1) and Con vs CLP (DEGs2). After taking the intersection of the genes with opposite differential trends in these two parts and immune-related genes (IRGs), DE-IRGs were obtained. Hub genes in the protein-protein interaction (PPI) network were then determined using six algorithms from the Cytohubba plugin in Cytoscape. Gene set enrichment analysis (GSEA) was employed to explore the functional relevance of these hub genes. Additionally, the immune microenvironment across the three groups was compared, and hub gene-related drugs were predicted using an online database. Finally, qRT-PCR was used to validate the expression of the hub genes in hippocampal tissue from CLP mice.

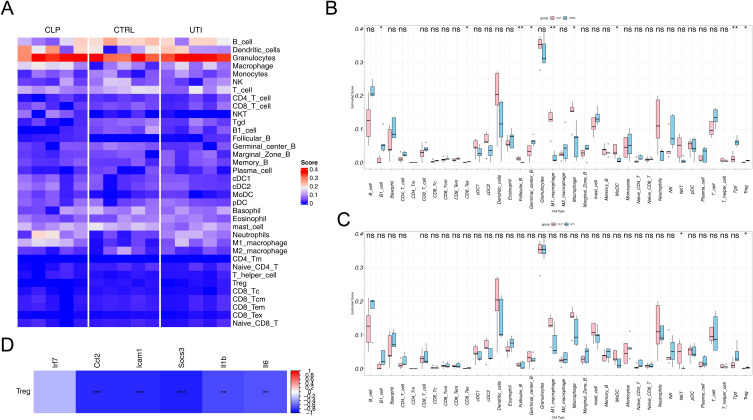
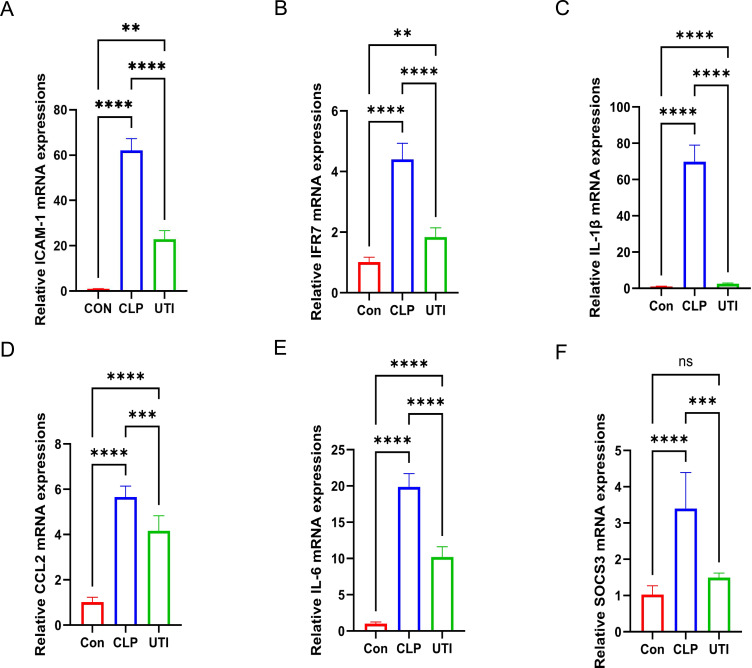
Results: RNA sequencing obtained 864 differentially expressed genes (DEGs) (CLP vs Con) and 279 DEGs (UTI vs CLP). Taking the intersection of DEGs with opposite expression trends yielded 165 DEGs. Six key genes (ICAM - 1, IRF7, IL - 1β, CCL2, IL - 6 and SOCS3) were screened by six algorithms. Immune infiltration analysis found that Treg cells were reversed after treatment with UTI in the diseased state. A total of 106 hub - gene - related drugs were predicted, among which BINDARIT - CCL2 and LIFITEGRAST - ICAM1 showed particularly high affinities. The qRT - PCR verification results were consistent with the sequencing results.

Conclusion: In conclusion, ICAM-1, IRF7, IL-1β, CCL2, IL-6, and SOCS3 were identified as potential therapeutic targets in SAE mice treated with UTI. This study offers theoretical support for UTI as a treatment option for SAE.

Keywords: RNA sequencing; Treg cells; immune; sepsis-associated encephalopathy; ulinastatin.


Conflict of interest statement

Wen Hu, Xiaoyuan Zhang, Zhen Wu, and Yushan Luo are co-first authors for this study. The authors declare that they have no competing interests in this work.

Figures

Figure 1
Figure 1
Effects of UTI on Hippocampal Neurons, Neurobehavioral Performance and Inflammatory Cytokines in Septic Mice. (AC) Representative images of HE-stained hippocampal sections from each group. Black arrows indicate nuclear disorder, neuronal shrinkage, and necrosis. Magnification:×20. (D) Neurobehavioral score. Data is represented by histograms. Values are expressed as mean ± SEM (n = 10 in each group). (E and F) The comparisons of IL-1β, IL-6 in serum in different groups. * p<0.05, ** p<0.01, *** p<0.001, **** p<0.0001, n=6.
Figure 2
Figure 2
UTI ameliorates cognitive impairment in SAE mice. (A) The experimental flow of animal model construction. (B) Representative movement trajectories of each group on the final day of the MWM test. (C) Escape latency times in the MWM test across all groups. (D) Time spent in the target quadrant during the testing phase for each group. * p < 0.05, n = 6. (E) Number of platform crossings in the testing phase for each group. * p < 0.05, n = 6. (F) Spontaneous alternation in the testing phase for each group. **p < 0.01, *** p < 0.001, n = 6.
Figure 3
Figure 3
Identification of immune-related differentially expressed genes (DE-IRGs). (A) Principal Component Analysis. (B) Volcano plot depicting DEGs between CLP and control groups. (C) Heatmap illustrating DEGs between CLP and control groups. (D) Volcano plot of DEGs between CLP and UTI groups. (E) Heatmap of DEGs between CLP and UTI groups. (F) Venn diagram of differentially expressed genes (DEGs) among control, CLP, and UTI groups. (G) Venn diagram showing the overlap between IRGs and DEGs.
Figure 4
Figure 4
Functional analysis of immune-related DE-IRGs. (A) GO term enrichment of DE-IRGs.(B) KEGG pathway enrichment of DE-IRGs.
Figure 5
Figure 5
Hub gene screening using Cytohubba. (A) Protein-protein interaction network of DE-IRGs. (B) Top 10 DE-IRGs ranked by MCC. (C) Top 10 DE-IRGs ranked by MNC. (D) Top 10 DE-IRGs ranked by EPC. (E) Top 10 DE-IRGs ranked by Degree. (F) Top 10 DE-IRGs ranked by Closeness. (G) Top 10 DE-IRGs ranked by Closeness. (H) Intersection of top 10 hub genes across six algorithms. (I) Gene-gene interaction network of hub genes and top 20 related genes.
Figure 6
Figure 6
Gene set enrichment analysis (GSEA) of the six hub genes.
Figure 7
Figure 7
Immune cell infiltration analysis across the three groups. (A) Heatmap showing the distribution of 36 immune cell types in each sample. (B) Differential analysis of 36 immune cell types between the control and CLP groups. (C) Differential analysis of 36 immune cell types between the CLP and UTI groups. (D) Correlation analysis between the six hub genes and Treg cells. * p<0.05, ** p<0.01, *** p<0.001.
Figure 8
Figure 8
Prediction of potential therapeutic drugs targeting the six hub genes. (A) Venn diagram of common mRNA-miRNA interaction pairs predicted for the six hub genes. (B) TF-mRNA-miRNA regulatory network of the six hub genes. The green octagon represents a TF, the blue V represents a miRNA, and the purple oval represents a biomarker. (C) Drug-target network of the six hub genes. (D) Molecular docking results of BINDARIT with CCL2. (E) Molecular docking results of LIFITEGRAST with ICAM1..
Figure 9
Figure 9
Validation of mRNA expression levels for the six hub genes. (AF) qRT-PCR validation of ICAM-1, IRF7, IL-1β, CCL2, IL-6, and SOCS3 expression. ** p < 0.01, *** p < 0.001, **** p < 0.0001, ns indicates not significant, n = 3–6.

Similar articles

References

    1. Evans L, Rhodes A, Alhazzani W, et al. Surviving sepsis campaign: international guidelines for management of sepsis and septic shock 2021. Intensive Care Med. 2021;47(11):1181–1247. doi:10.1007/s00134-021-06506-y - DOI - PMC - PubMed
    1. Zarbock A, Koyner JL, Gomez H, Pickkers P, Forni L. Sepsis-associated acute kidney injury-treatment standard. Nephrol Dial Transplant. 2023;39(1):26–35. doi:10.1093/ndt/gfad142 - DOI - PubMed
    1. Cajander S, Kox M, Scicluna BP, et al. Profiling the dysregulated immune response in sepsis: overcoming challenges to achieve the goal of precision medicine. Lancet Respir Med. 2024;12(4):305–322. doi:10.1016/s2213-2600(23)00330-2 - DOI - PubMed
    1. Qin M, Gao Y, Guo S, et al. Establishment and evaluation of animal models of sepsis-associated encephalopathy. World J Emerg Med. 2023;14(5):349–353. doi:10.5847/wjem.j.1920-8642.2023.088 - DOI - PMC - PubMed
    1. Gofton TE, Young GB. Sepsis-associated encephalopathy. Nat Rev Neurol. 2012;8(10):557–566. doi:10.1038/nrneurol.2012.183 - DOI - PubMed

LinkOut - more resources