

Deep learning enabled integration of tumor microenvironment microbial profiles and host gene expressions for interpretable survival subtyping in diverse types of cancers
- PMID: 39565103
- PMCID: PMC11651096
- DOI: 10.1128/msystems.01395-24
Deep learning enabled integration of tumor microenvironment microbial profiles and host gene expressions for interpretable survival subtyping in diverse types of cancers
Abstract
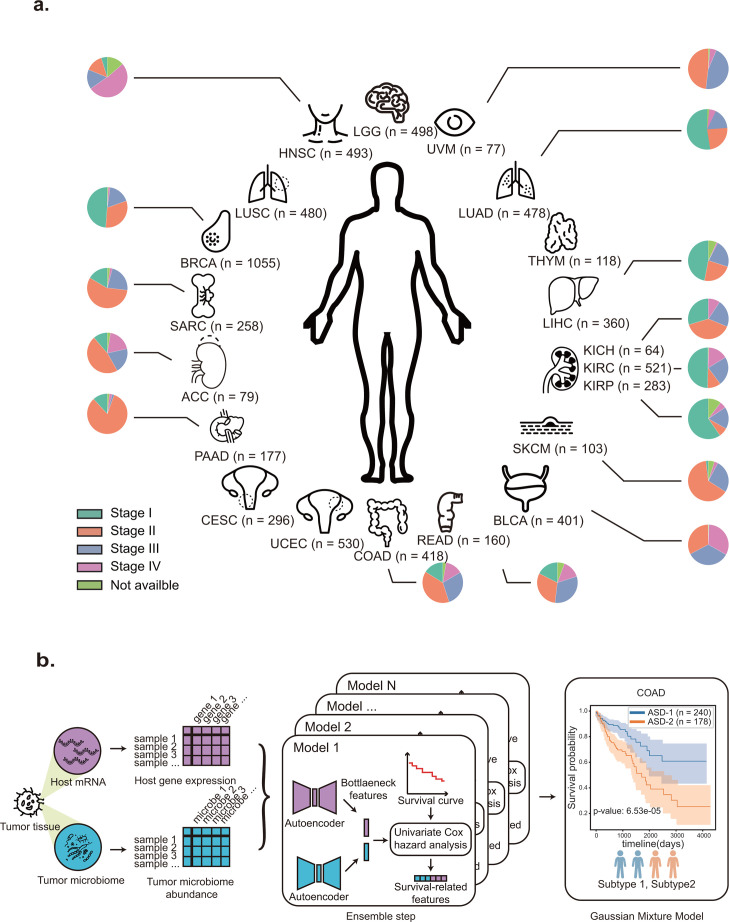
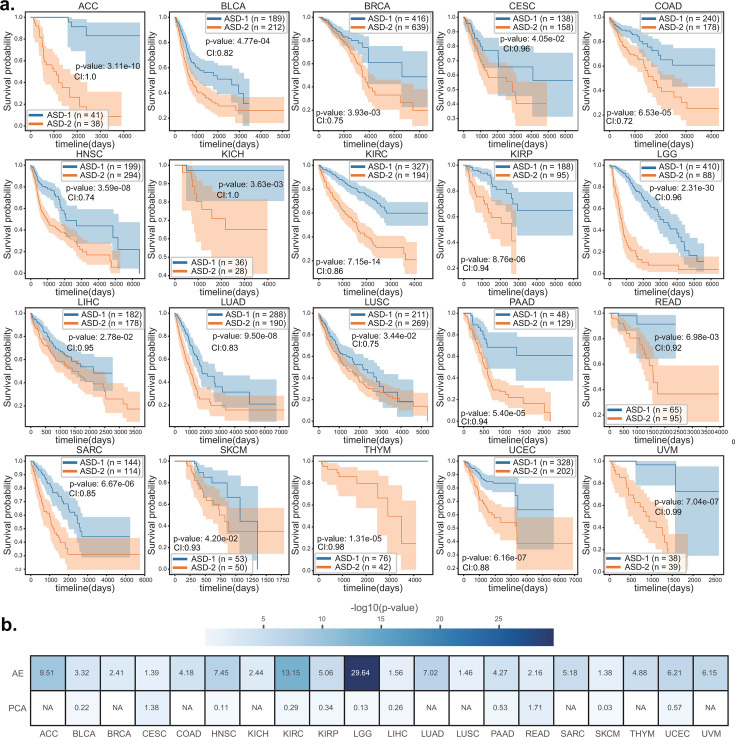
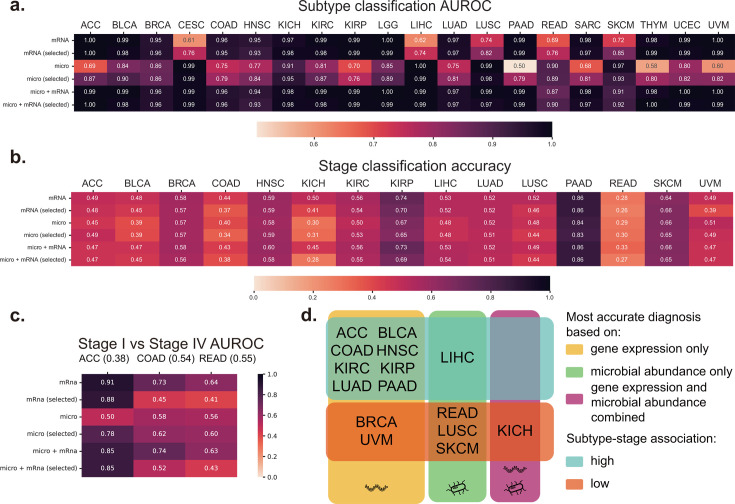
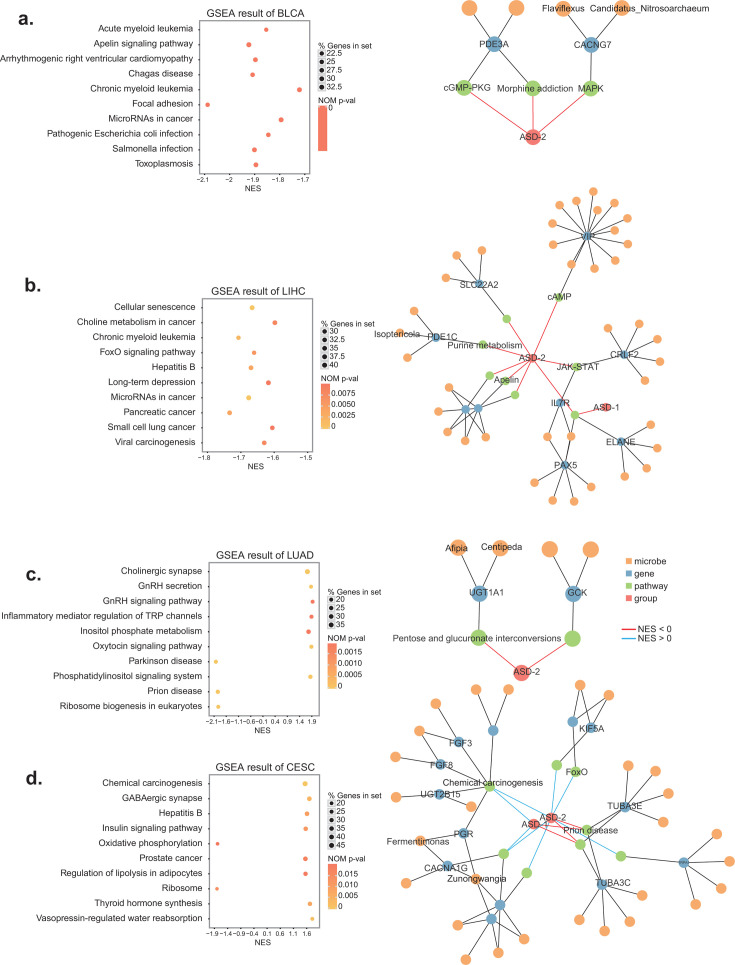
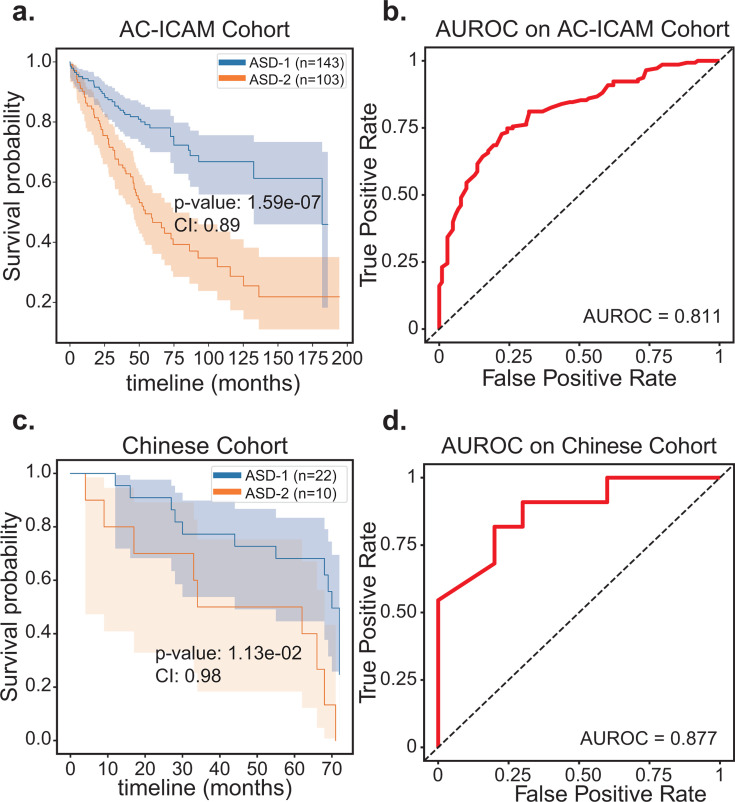
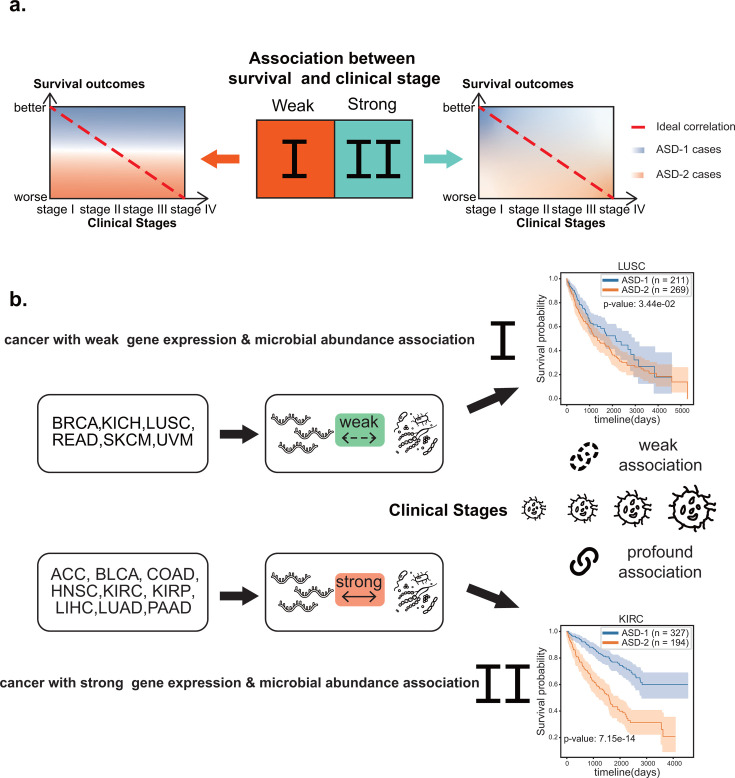
The tumor microbiome, a complex community of microbes found in tumors, has been found to be linked to cancer development, progression, and treatment outcome. However, it remains a bottleneck in distangling the relationship between the tumor microbiome and host gene expressions in tumor microenvironment, as well as their concert effects on patient survival. In this study, we aimed to decode this complex relationship by developing ASD-cancer (autoencoder-based subtypes detector for cancer), a semi-supervised deep learning framework that could extract survival-related features from tumor microbiome and transcriptome data, and identify patients' survival subtypes. By using tissue samples from The Cancer Genome Atlas database, we identified two statistically distinct survival subtypes across all 20 types of cancer Our framework provided improved risk stratification (e.g., for liver hepatocellular carcinoma, [LIHC], log-rank test, P = 8.12E-6) compared to PCA (e.g., for LIHC, log-rank test, P = 0.87), predicted survival subtypes accurately, and identified biomarkers for survival subtypes. Additionally, we identified potential interactions between microbes and host genes that may play roles in survival. For instance, in LIHC, Arcobacter, Methylocella, and Isoptericola may regulate host survival through interactions with host genes enriched in the HIF-1 signaling pathway, indicating these species as potential therapy targets. Further experiments on validation data sets have also supported these patterns. Collectively, ASD-cancer has enabled accurate survival subtyping and biomarker discovery, which could facilitate personalized treatment for broad-spectrum types of cancers.IMPORTANCEUnraveling the intricate relationship between the tumor microbiome, host gene expressions, and their collective impact on cancer outcomes is paramount for advancing personalized treatment strategies. Our study introduces ASD-cancer, a cutting-edge autoencoder-based subtype detector. ASD-cancer decodes the complexities within the tumor microenvironment, successfully identifying distinct survival subtypes across 20 cancer types. Its superior risk stratification, demonstrated by significant improvements over traditional methods like principal component analysis, holds promise for refining patient prognosis. Accurate survival subtype predictions, biomarker discovery, and insights into microbe-host gene interactions elevate ASD-cancer as a powerful tool for advancing precision medicine. These findings not only contribute to a deeper understanding of the tumor microenvironment but also open avenues for personalized interventions across diverse cancer types, underscoring the transformative potential of ASD-cancer in shaping the future of cancer care.
Keywords: cancer prognosis; deep learning; survival subtype; tumor microbiome.
Conflict of interest statement
The authors declare no conflict of interest.
Figures
Comment in
-
Decoding cancer prognosis with deep learning: the ASD-cancer framework for tumor microenvironment analysis.mSystems. 2025 May 20;10(5):e0145524. doi: 10.1128/msystems.01455-24. Epub 2025 Apr 16. mSystems. 2025. PMID: 40237527 Free PMC article.
Similar articles
-
Decoding cancer prognosis with deep learning: the ASD-cancer framework for tumor microenvironment analysis.mSystems. 2025 May 20;10(5):e0145524. doi: 10.1128/msystems.01455-24. Epub 2025 Apr 16. mSystems. 2025. PMID: 40237527 Free PMC article.
-
Dichotomous roles of ADAR1 in liver hepatocellular carcinoma and kidney renal cell carcinoma: Unraveling the complex tumor microenvironment and prognostic significance.Int Immunopharmacol. 2024 Jul 30;136:112340. doi: 10.1016/j.intimp.2024.112340. Epub 2024 May 30. Int Immunopharmacol. 2024. PMID: 38820962
-
Host-microbiota interactions contributing to the heterogeneous tumor microenvironment in colorectal cancer.Physiol Genomics. 2024 Feb 1;56(2):221-234. doi: 10.1152/physiolgenomics.00103.2023. Epub 2023 Dec 11. Physiol Genomics. 2024. PMID: 38073489
-
Understanding the microbiome: Emerging biomarkers for exploiting the microbiota for personalized medicine against cancer.Semin Cancer Biol. 2018 Oct;52(Pt 1):1-8. doi: 10.1016/j.semcancer.2018.02.003. Epub 2018 Feb 6. Semin Cancer Biol. 2018. PMID: 29425888 Review.
-
Intratumoral Microbiota: Metabolic Influences and Biomarker Potential in Gastrointestinal Cancer.Biomolecules. 2024 Jul 27;14(8):917. doi: 10.3390/biom14080917. Biomolecules. 2024. PMID: 39199305 Free PMC article. Review.
Cited by
-
Tumor-associated bacteria activate PRDX1-driven glycolysis to promote immune evasion and PD-1 antibody resistance in hepatocellular carcinoma.Front Microbiol. 2025 Jul 7;16:1599691. doi: 10.3389/fmicb.2025.1599691. eCollection 2025. Front Microbiol. 2025. PMID: 40693141 Free PMC article.
-
Decoding cancer prognosis with deep learning: the ASD-cancer framework for tumor microenvironment analysis.mSystems. 2025 May 20;10(5):e0145524. doi: 10.1128/msystems.01455-24. Epub 2025 Apr 16. mSystems. 2025. PMID: 40237527 Free PMC article.
References
-
- Amin MB, Greene FL, Edge SB, Compton CC, Gershenwald JE, Brookland RK, Meyer L, Gress DM, Byrd DR, Winchester DP. 2017. The eighth edition AJCC cancer staging manual: continuing to build a bridge from a population-based to a more "personalized" approach to cancer staging. CA Cancer J Clin 67:93–99. doi:10.3322/caac.21388 - DOI - PubMed
-
- Tong M, Zheng W, Li H, Li X, Ao L, Shen Y, Liang Q, Li J, Hong G, Yan H, Cai H, Li M, Guan Q, Guo Z. 2016. Multi-omics landscapes of colorectal cancer subtypes discriminated by an individualized prognostic signature for 5-fluorouracil-based chemotherapy. Oncogenesis 5:e242. doi:10.1038/oncsis.2016.51 - DOI - PMC - PubMed
MeSH terms
Substances
Grants and funding
LinkOut - more resources
Full Text Sources
Medical
