. 2024 Dec 17;9(12):e0079024.
doi: 10.1128/msystems.00790-24. Epub 2024 Nov 20.

Cigarette smoke-induced disordered microbiota aggravates the severity of influenza A virus infection

Affiliations

Cigarette smoke-induced disordered microbiota aggravates the severity of influenza A virus infection

Tsering Wüthrich et al. mSystems. .

Abstract

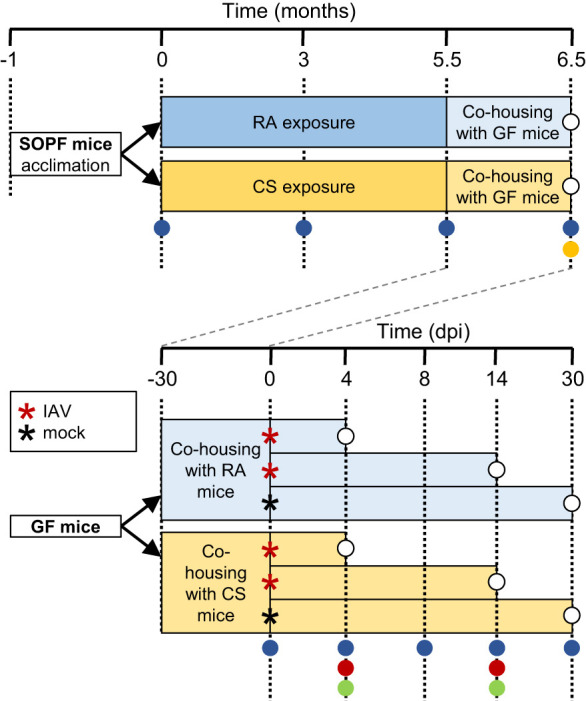
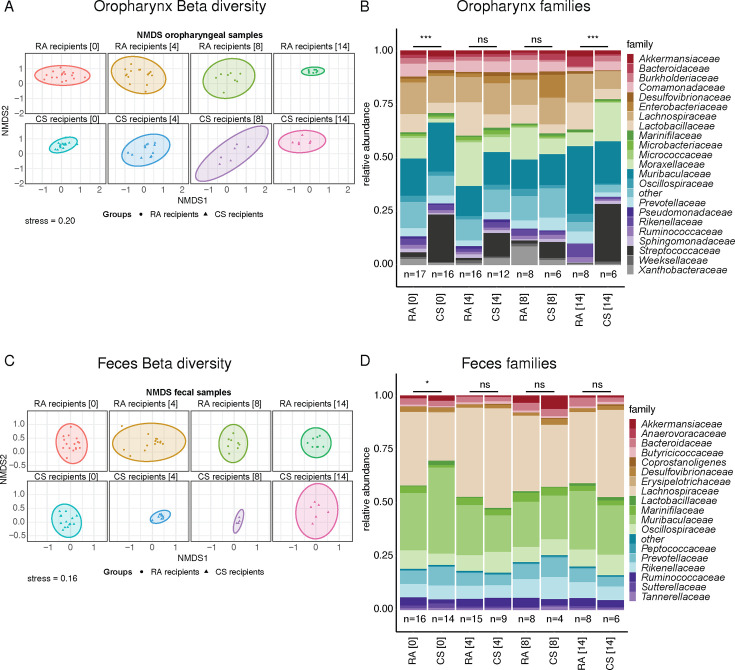
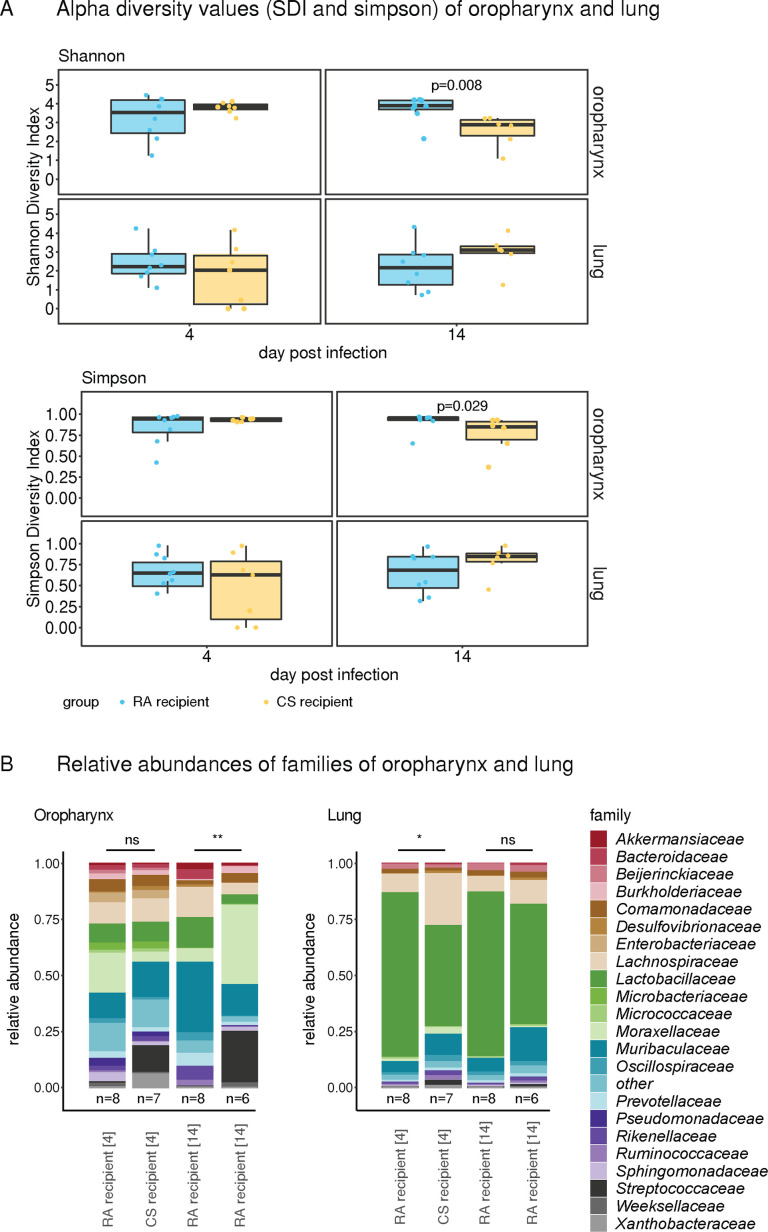
Cigarette smoke (CS) promotes the development of chronic pulmonary disease and has been associated with increased risk for influenza-related illness. Here, we directly addressed the impact of CS disordered microbiota on the severity of influenza A virus (IAV) infection. Specific and opportunistic pathogen-free (SOPF) C57BL/6J mice were exposed to CS or room air (RA) for 5.5 months. Each exposed mouse was then cohoused with a group of recipient germ-free (GF) mice for 1 month for microbial transfer. Colonized GF mice were then infected intranasally with IAV and disease development was monitored. Upper and lower airway and fecal microbiota were longitudinally investigated by 16S rRNA gene sequencing and bacterial cultures in donor and recipient mice. The bacterial family Streptococcaceae accounted for the largest difference between CS- and RA-exposed microbiota in the oropharynx. Analysis of the oropharynx and fecal microbiota indicated an efficient transfer to coprophagic recipient mice, which replicated the differences in microbiota composition observed in donor mice. Subsequent IAV infection revealed significantly higher weight loss for CS microbiota recipient mice at 8-10 days post infection (dpi) compared to control recipient mice. In addition, H1N1 infection inflicted substantial changes in the microbiota composition, especially at days 4 and 8 after infection. In conclusion, mice with a CS-associated microbiota suffer from higher disease severity upon IAV infection compared to mice colonized with a normal SOPF microbiota. Our data suggest that independently of CS exposure and concomitant structural lung damage, microbial distortion due to CS exposure may impact the severity of IAV disease course.IMPORTANCEIt has been reported that chronic exposure to CS is associated with a disordered microbiota composition. In this study, we colonized germ-free (GF) mice with the microbiota from SOPF mice which were chronically exposed to CS or RA. This allowed disentangling the effect of the disordered microbiota from the immune-modulating effects of actual CS exposure. We observed a successful transfer of the microbiotas after cohousing including specific microbiota differences induced by CS exposure in formerly GF mice, which were never exposed to CS. We then investigated the effects of IAV infection on the disease course and microbiotas of formerly GF mice. We found that mice with CS-associated microbiota reveal worse disease course compared to the control group. We hypothesize that CS-induced disordering of the microbiota may, indeed, impact the severity of influenza A disease.

Keywords: H1N1 infection; airways; cigarette smoke; feces; germ free mice; microbiota.


Conflict of interest statement

The authors declare no conflict of interest.

Figures

Fig 1
Fig 1
Experimental design. (A) Time line of exposure and sampling of microbiota donor mice. Four-week-old C57BL/6JRj SOPF female mice were randomized in two groups at delivery (n = 8/group) and acclimatized for 1 month before the start of exposure to cigarette smoke (CS; orange) or to room air (RA; blue) for 5.5 months. Mice in the CS group were exposed to CS generated by a Teague TE-10 smoking machine for two 90 min periods/day, 5 days/week. At the end of the exposure (5.5 months), each RA- and CS-exposed mouse was housed in a cage with 3 or 4 C57BL/6J germ-free mice, and the mice were left undisturbed for 1 month. SOPF donor mice were sampled at 0, 3, 5.5, and 6.5 months from the start of exposure. (B) Time line of microbiota transfer and IAV infection of GF mice. Upon delivery, 6–12-week-old C57BL/6J GF mice were immediately divided into individually ventilated cages (n = 3 or 4 GF mice/cage) containing a single microbiota donor mouse previously exposed to RA or CS. After 1 month of undisturbed co-housing, subgroups of GF mice were inoculated intranasally with 100 PFU IAV (red asterisk) or mock-infected (black asterisk). (A and B) Samples collected are indicated at the corresponding time points: microbiota analysis of oropharyngeal swabs and fecal pellets (blue circle), amplicon sequence variant and bacterial cultures of oropharyngeal and fecal cultures (yellow circle), viral and bacterial load in lung homogenate (red circle), microbiota analysis and histopathology of the lungs (green circles).
Fig 2
Fig 2
Chronic CS exposure induces changes in upper airway and gut microbiota diversity. (A and B) Alpha diversity values of the oropharynx microbiota shown as (A) Shannon diversity index (SDI) and (B) Simpson index of SOPF mice exposed to RA or CS. (C and D) Alpha diversity values for the fecal microbiota samples. (E and F) Beta diversity analysis calculated using Bray Curtis distance matrices for the oropharyngeal (E) and fecal (F) microbiota dissimilarity. Box-plots indicate median and interquartile range with mean indicated by + and with outliers shown. Data were analyzed by two-way ANOVA (**P < 0.001; ***P < 0.001).
Fig 3
Fig 3
Chronic CS exposure induces quantitative and qualitative changes in oropharyngeal and fecal microbiota. (A and B) Relative abundances of the most prevalent bacterial families in (A) oropharyngeal swabs and (B) fecal pellets of SOPF mice exposed to RA or CS for 0, 3, 5.5 months. Data were analyzed using PERMANOVA tests (*P < 0.05; **P < 0.01). (C and D) Differential abundance of amplicon sequence variants (ASV) in (C) oropharyngeal swabs and (D) fecal pellets after 5.5-month exposure to RA or CS (P-adjusted < 0.0001 and log2FC > |2.5|). The first four letters of the bacterial families are indicated for each ASV. ASV numbering is illustrated according to DADA2 output, which ranks the ASVs according to relative abundance (the lower the number, the higher the abundance of the ASV). (E and F) Bacterial cultures of (E) oropharyngeal swabs and (F) fecal pellets after 5.5 months exposure to RA or CS. ENTE*, Enterococcaceae; ENTE**, Enterobacteriaceae.
Fig 4
Fig 4
Faithful oropharyngeal and fecal microbiota transfer following cohousing of GF mice. Relative abundance of the most prevalent families in (A) oropharyngeal swabs and (B) fecal pellets of RA- and CS-exposed donor mice and their respective groups of GF recipient mice at the end of the co-housing period of 4 weeks. Data were analyzed using PERMANOVA tests (***P < 0.001).
Fig 5
Fig 5
CS-associated microbiota aggravates severity of IAV infection. (A) Relative body weight change of colonized GF mice following 100 PFU IAV infection or control non-infected colonized GF mice. Data are shown as mean ± SD and analyzed using Wilcoxon tests (*P < 0.05, ***P < 0.001 indicate differences between infected and the respective mock-infected control; #P < 0.05, ##P < 0.01 indicate differences between CS and RA infected groups). (B) Virus load (IAV M gene) RT-qPCR is shown relative to the highly abundant host gene β2-microglobulin in lung homogenates of mice with RA- and CS-associated microbiota at 4 and 14 dpi. (C) Cycle threshold (CT) values for IAV M gene RT-qPCR. (D) Cycle threshold (CT) values for panbacter RT-qPCR of lung homogenates at 4 and 14 dpi plotted for each group and time point, or with data of both groups pooled (black). Data were analyzed by Wilcoxon test (*P < 0.05, **P < 0.01).
Fig 6
Fig 6
Beta-diversity and relative abundances of bacterial families during IAV infection. (A and C) Non-metric multidimensional scaling of Bray-Curtis distances depicted in individual panels for (A) oropharyngeal swabs and (C) fecal pellets at indicated dpi. (B and D) Relative abundance of the most prevalent bacterial families averaged per group in (B) oropharyngeal swabs and (D) fecal pellets at indicated dpi. Data were analyzed using PERMANOVA tests.
Fig 7
Fig 7
Microbial communities of upper and lower airway samples during IAV infection. (A) Alpha diversity values of the oropharynx and lung microbiota shown as (A) Shannon diversity index (SDI) and (B) Simpson index of colonized GF mice on 4 and 14 dpi with IAV. Data were analyzed by Wilcoxon ranked sum tests, and P-values are indicated. (B) Relative abundance at family level for oropharyngeal and lung microbiota at 4 and 14 dpi. Each bar represents the averaged community composition for the number of mice indicated below.

References

    1. Muscatello DJ, Barr M, Thackway SV, Macintyre CR. 2011. Epidemiology of influenza-like illness during pandemic (H1N1) 2009, New South Wales, Australia. Emerg Infect Dis 17:1240–1247. doi:10.3201/eid1707.101173 - DOI - PMC - PubMed
    1. Finklea JF, Sandifer SH, Smith DD. 1969. Cigarette smoking and epidemic influenza. Am J Epidemiol 90:390–399. doi:10.1093/oxfordjournals.aje.a121084 - DOI - PubMed
    1. Arcavi L, Benowitz NL. 2004. Cigarette Smoking and Infection. Arch Intern Med 164:2206. doi:10.1001/archinte.164.20.2206 - DOI - PubMed
    1. Robbins CS, Bauer CMT, Vujicic N, Gaschler GJ, Lichty BD, Brown EG, Stämpfli MR. 2006. Cigarette smoke impacts immune inflammatory responses to influenza in mice. Am J Respir Crit Care Med 174:1342–1351. doi:10.1164/rccm.200604-561OC - DOI - PubMed
    1. Dye JA, Adler KB. 1994. Effects of cigarette smoke on epithelial cells of the respiratory tract. Thorax 49:825–834. doi:10.1136/thx.49.8.825 - DOI - PMC - PubMed