. 2024 Dec 19;74(1):e240070.
doi: 10.1530/JME-24-0070. Print 2025 Jan 1.

Syndecans modulate ghrelin receptor signaling

Syndecans modulate ghrelin receptor signaling

Karina Prins et al. J Mol Endocrinol. .

Abstract

Ghrelin is a gut hormone that enhances food intake and growth hormone secretion through its G-protein coupled receptor, the growth hormone secretagogue receptor (GHSR). Recently, we have shown that ghrelin interacts with syndecans (SDCs), a family of membrane proteins known to modulate hypothalamic appetite signaling. Here, we investigated whether SDCs impact ghrelin signaling at GHSR by assessing ghrelin-induced intracellular Ca2+ mobilization (iCa2+) and inositol phosphate 1 (IP1) production in HEK293 cells. Compared with controls, the overexpression of SDCs dose-dependently increased the maximum iCa2+ response two- to four-fold, without affecting EC50. The IP1 response was similarly amplified by SDCs, but it also indicated that they reduce constitutive (ghrelin-independent) activity of GHSR. These enhanced responses occurred despite a SDC dose-dependent reduction in plasma membrane GHSR levels. Although ghrelin-stimulated Gαq activation was unaltered by SDC1 expression, it failed to restore iCa2+ responsiveness in GNAQ/11 knockout cells, indicating dependence on Gαq/11, not another Gα subunit. This suggests that SDCs modulate either signaling downstream of Gαq/11 or quenching of β-arrestin2 recruitment to GHSR. Indeed, expression of SDCs at levels that only modestly suppress cell surface receptor reduced ghrelin-induced β-arrestin2 recruitment by ∼80%. SDC co-expression also delayed the peak β-arrestin2 response. However, peak β-arrestin2 recruitment follows the peak iCa2+ response, making it unclear whether reduced β-arrestin2 recruitment potentiated Ca2+ signaling. Altogether, SDCs enhanced iCa2+/IP1 and reduced β-arrestin2 recruitment by GHSR in response to ghrelin, likely by modulating signaling downstream of Gαq. This could be a novel mechanism through which SDCs affect metabolism and obesity.

Keywords: G protein‐coupled receptor (GPCR); GHSR; ghrelin; signal transduction; β-arrestin.


Conflict of interest statement

The authors declare that there is no conflict of interest that could be perceived as prejudicing the impartiality of the work reported.

Figures
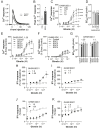
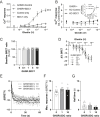
Figure 1
Figure 1
Syndecans (SDCs) enhance ghrelin-stimulated growth hormone secretagogue receptor (GHSR) signaling. (A) Time course of aequorin luminescence after ghrelin treatment in cells expressing GHSR with control or SDC1 expression plasmids at 1:20 ratio. (B) Comparison of peak iCa2+ responses derived from curve-fitting data from A (*P < 0.05, GHSR alone versus SDC1 co-transfection). (C) Dose–response curves of intracellular ghrelin-stimulated iCa2+ expressed as % Emax of 1:0 ratio: effect of different GHSR:SDC1 transfection ratios (*P < 0.05, ***P < 0.0005, Emax for GHSR:SDC co-expression versus GHSR alone (GHSR:SDC, 1:0) tested by ANOVA). (D) EC50s for ghrelin derived from dose–response curves shown in (C) (SDC1 ratios). (E) Effect of all SDCs co-transfected at a GHSR:SDC ratio of 1:20 (**P < 0.005 (t-test), Emax for GHSR:SDC co-expression versus GHSR alone). (F) Effect of all SDCs co-transfected at a GHSR:SDC ratio of 1:1 (*P ≤ 0.05 (t-test), Emax for GHSR:SDC co-expression versus GHSR alone). (G) EC50s for ghrelin derived from SDC1–SDC4 dose–response curves shown in (E) and (F). (H) and (I) Dose–response curves of IP1 accumulation after ghrelin stimulation of cells expressing GHSR in the presence or absence of SDC1 at 1:20 and 1:1 ratios, respectively, corrected for baseline (*P ≤ 0.05 (t-test), Emax ghrelin-induced IP1 levels of 1:0 v. 1:20 or 1:1 ratio). (J) and (K) Dose–response curves of IP1 levels after ghrelin stimulation of cells expressing GHSR in the presence or absence of SDC1 at 1:20 and 1:1 ratios, respectively, expressed as % of maximum response in the absence of SDC1 (*P ≤ 0.05, **P < 0.01 (t-test), basal IP1 levels of 1:0 v. 1:20 or 1:1 ratio, respectively). Data are mean ± SEM of three or more independent experiments.
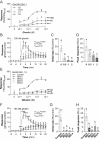
Figure 2
Figure 2
Syndecans (SDCs) reduce plasma membrane growth hormone secretagogue receptor (GHSR) availability. Plasma membrane (extracellular) expression of GHSR-HiBiT. (A) Effect of increasing GHSR:SDC1 expression plasmid ratios on cell surface levels expressed as % luminescence intensity relative to control (1:0 ratio). (B) Effect of all SDCs (GHSR:SDC, 1:20) expressed as % luminescence intensity relative to control (1:0 ratio). (C) Effect of all SDCs (GHSR:SDC, 1:1) expressed as % luminescence intensity relative to control (1:0 ratio). (D) Effect of MRAP2 on ghrelin-induced GHSR internalization using HiBiT. (E) Bystander BRET evaluation of effect of all SDCs on cell surface levels of GHSR expressed as netBRET % of 1:0 control (GHSR:SDC ratios of 1:0 to 1:20; *P < 0.05, ***P < 0.005 versus 1:0). (F) Effect of MRAP2 on ghrelin-induced GHSR internalization using bystander BRET. (G) Effect of SDCs on total GHSR expression assessed by measuring GHSR-NLuc derived luminescence of bystander BRET assays (**P < 0.01). (H) Effect of SDCs at a GHSR:SDC ratio of 1:20 on 1 μM ghrelin-induced internalization using the HiBiT assay. (I) Percentage internalization 50 min following ghrelin treatment relative to vehicle from (H). (J) Effect of SDCs at a GHSR:SDC ratio of 1:1 on 1 μM ghrelin-induced internalization using the HiBiT assay. (K) Percentage internalization 50 min following ghrelin treatment relative to vehicle from (J). Data are corrected for baseline and then expressed as % of vehicle controls at each time point. Data are presented as mean ± SEM of 3–7 independent experiments. Letters a–d represent groups that are significantly different from each other (P < 0.05; one-way ANOVA).
Figure 3
Figure 3
Syndecans (SDCs) require growth hormone secretagogue receptor (GHSR) and Gαq/11 to enhance ghrelin-induced signaling but do not potentiate activation of Gq directly. (A) Effect of SDC1 on ghrelin-stimulated intracellular calcium levels in cells with or without GHSR expression. (B) Effect of SDC1 on ghrelin-stimulated Ca2+ release in GNAQ/11 WT (inset) and KO HEK293 cells (***P < 0.0005 versus own control. WT, wild-type parental cell-line; KO, GNAQ/11 knockout. Data are corrected for WT control Emax). (C) Lack of effect of different GHSR:SDC1 ratios on ligand-independent Gαq biosensor activity. (D) Lack of effect of different GHSR:SDC1 ratios on ghrelin-stimulated Gαq activation, as measured by a decrease in BRET over the prestimulation baseline. (E) Kinetics of the Gq-CASE response during the first 60 s following ghrelin treatment, showing 1:0 (control), 1:1 and 1:10 GHSR:SDC1 ratios (SEM represented by the dotted lines). (F) and (G) Maximal response and half-times derived from curve-fitting of data shown in (E) (ANOVA gave no significant differences). For all experiments, data are presented as mean ± SEM of 3–4 independent experiments.
Figure 4
Figure 4
Syndecans (SDCs) impair β-arrestin2 recruitment at growth hormone secretagogue receptor (GHSR). (A) Effect of SDC1 on ghrelin-stimulated β-arrestin2–GHSR interaction in HEK293 cells. Values were corrected for Emax of the control (***P < 0.0005 versus 1:0 ratio GHSR:SDC1; # P < 0.05, ## P < 0.005 versus 1:2 ratio GHSR:SDC1). (B) Effect of SDC1 on the kinetic profile of the β-arrestin2–GHSR interaction upon ghrelin stimulation (outcome of RM-ANOVA shown on graph: P T, effect of time; P Ratio, effect of GHSR:SDC ratio; P TxRatio, interaction. *P < 0.05, all other ratios versus 1:0 ratio GHSR:SDC1; # P < 0.05, 1:1 and 1:2 versus 1:0 ratio; $ P < 0.05, 1:2 versus 1:0 ratio). Data derived from curve fitting of the kinetic profiles for β-arrestin2 recruitment by GHSR in cells transfected with control or increasing amounts of SDC1 expression plasmid. (C) Initial rate of recruitment. (D) Magnitude of peak response (letters a and b represent groups that are significantly different from each other (P < 0.05; one-way ANOVA). Dose–response curve (E) (***P < 0.0005 versus control; # P < 0.05 versus 1:2 ratio GHSR:SDC1) and kinetic curve (F) of the effect of all SDCs (GHSR:SDC of 1:2) on β-arrestin2 recruitment at GHSR (outcome of RM-ANOVA shown on graph. *P < 0.05, ***P < 0.001, all SDCs versus control; # P < 0.05, SDC1, SDC2 and SDC4 versus control; $ P < 0.05, SDC2 and SDC4 versus control. P T, effect of time; P Ratio, effect of GHSR:SDC ratio; P TxRatio, interaction). Data derived from curve fitting of the kinetic profiles for β-arrestin2 recruitment by GHSR in cells transfected with control or SDC1, SDC2, SDC3 or SDC4 expression plasmids. (G) Initial rate of recruitment. (H) Magnitude of peak response (letters a and b represent groups that are significantly different from each other (P < 0.05; one-way ANOVA). Data are presented as mean ± SEM of three independent experiments. Emax, maximum response.
Figure 5
Figure 5
Syndecans (SDCs) are co-expressed with growth hormone secretagogue receptor (GHSR) in mouse hypothalamus. In a single-cell RNA-seq dataset, 47/50 cells that express GHSR also express one or more SDCs. Data are expressed as counts per 10,000 molecules.

Similar articles

References

    1. Afratis NA, Nikitovic D, Multhaupt HAB, et al. . 2017. Syndecans – key regulators of cell signaling and biological functions. FEBS J 284 27–41. (10.1111/febs.13940) - DOI - PubMed
    1. Asai M, Ramachandrappa S, Joachim M, et al. . 2013. Loss of function of the melanocortin 2 receptor accessory protein 2 is associated with mammalian obesity. Science 341 275–278. (10.1126/science.1233000) - DOI - PMC - PubMed
    1. Chen J, Chen V, Kawamura T, et al. . 2019. Charge characteristics of agouti-related protein implicate potent involvement of heparan sulfate proteoglycans in metabolic function. iScience 22 557–570. (10.1016/j.isci.2019.10.061) - DOI - PMC - PubMed
    1. Chen H, Zhang S, Zhang X, et al. . 2022. QR code model: a new possibility for GPCR phosphorylation recognition. Cell Commun Signal 20 23. (10.1186/s12964-022-00832-4) - DOI - PMC - PubMed
    1. Cornejo MP, Mustafá ER, Cassano D, et al. . 2021. The ups and downs of growth hormone secretagogue receptor signaling. FEBS J 288 7213–7229. (10.1111/febs.15718) - DOI - PubMed

MeSH terms

LinkOut - more resources