. 2025 Jan 1;32(Pt 1):17-28.
doi: 10.1107/S160057752400986X. Epub 2025 Jan 1.

Development of MHz X-ray phase contrast imaging at the European XFEL

Affiliations

Development of MHz X-ray phase contrast imaging at the European XFEL

Jayanath C P Koliyadu et al. J Synchrotron Radiat. .

Abstract

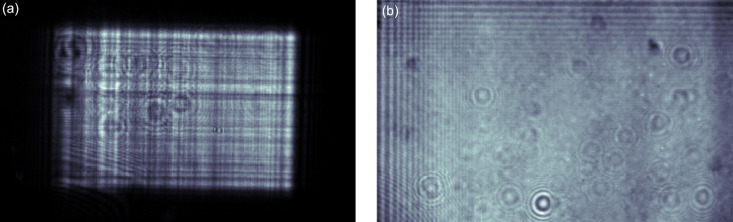
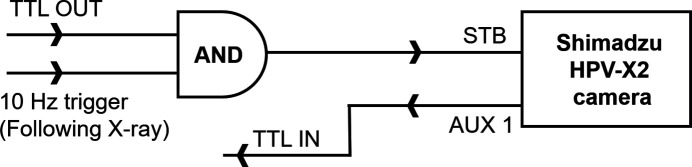
We report on recent developments that enable megahertz hard X-ray phase contrast imaging (MHz XPCI) experiments at the Single Particles, Clusters, and Biomolecules and Serial Femtosecond Crystallography (SPB/SFX) instrument of the European XFEL facility (EuXFEL). We describe the technical implementation of the key components, including an MHz fast camera and a modular indirect X-ray microscope system based on fast scintillators coupled through a high-resolution optical microscope, which enable full-field X-ray microscopy with phase contrast of fast and irreversible phenomena. The image quality for MHz XPCI data showed significant improvement compared with a pilot demonstration of the technique using parallel beam illumination, which also allows access to up to 24 keV photon energies at the SPB/SFX instrument of the EuXFEL. With these developments, MHz XPCI was implemented as a new method offered for a broad user community (academic and industrial) and is accessible via standard user proposals. Furthermore, intra-train pulse diagnostics with a high few-micrometre spatial resolution and recording up to 128 images of consecutive pulses in a train at up to 1.1 MHz repetition rate is available upstream of the instrument. Together with the diagnostic camera upstream of the instrument and the MHz XPCI setup at the SPB/SFX instrument, simultaneous two-plane measurements for future beam studies and feedback for machine parameter tuning are now possible.

Keywords: European XFEL; X-ray phase contrast imaging; indirect MHz X-ray detector; megahertz sampling; pulse-resolved imaging.


Figures

Figure 1
Figure 1
Schematic of the parallel beam configuration for MHz XPCI experiments at SPB/SFX. Following the horizontal offset mirrors, the beam passes through an X-ray gas detection monitor, which measure the pulse energy. It then passes through a set of power slits and, if out-coupled to air, a diamond window. The indirect detection microscopes are placed after a dynamic sample downstream of the diamond window. The focusing optics, KB mirrors and CRLs are shown in their respective positions relative to the MHz XPCI setup and are moved out of the X-ray beam for the parallel beam configuration. The CRLs in the photon tunnel are used to collimate the parallel beam to achieve higher flux density in cases where the number of photons per pulse is not enough to produce a good signal-to-noise ratio, especially for hard X-rays > 20 keV. The X-ray pulse structure is also shown.
Figure 2
Figure 2
X-ray beam imaged using the MHz X-ray microscope with (a) the micron KB beam downstream of the focus and parallel beam illumination (b). The field of view in both cases is 1.28 × 0.8 mm. The Fresnel fringes on the top left in (b) arise from the power slit upstream of the IRU chamber and the round features in both images can be attributed to imperfections in the exit window. The measurement was carried out at a photon energy of 9.3 keV for both beam trajectories.
Figure 3
Figure 3
(a) Schematic of the modular indirect X-ray microscope. On X-ray irradiation, the luminescence from the fast scintillator is projected onto the detector using a commercial Mitutoyo NUV long-working-distance objective, 10× magnification (NA = 0.28) or 20× magnification (NA = 0.4), positioned so that the scintillator screen is in the focal plane. The objectives are motorized to find and optimize the focus easily. Downstream of the objective a removable prism beam-splitter (50/50) can be used to direct the beam to two arms of the microscope. The beam downstream of the beam-splitter is imaged onto the cameras with a tube lens, MT-L4 optimized for 266–620 nm wavelengths. The two arms of the microscope can hold (d) two fast cameras, or (c) two slow cameras, (b) or a combination of both. The microscope setup is equipped with X, Y, Z stages for precise spatial alignment of the microscope with respect to the X-ray beam. The electro-mechanical integration of the optics and cameras was carried out in close collaboration with SUNA-Precision GmbH, Germany (SUNA-Precision GmbH, 2024 ▸).
Figure 4
Figure 4
Scintillator fluorescent emission decay curves, measured using the slow camera and a gated image intensifier, show the response of the scintillator to the EuXFEL X-ray pulse.
Figure 5
Figure 5
Control system view for the fast and slow cameras.
Figure 6
Figure 6
Timing signal connection diagram of fast and slow cameras. The timing and the trigger signal from the EuXFEL timing system are distributed to the microTCA unit equipped with different timing boards. Each timing board provides or receives TTL signals and offers in-built logic operations. The slow camera is triggered with a train synchronized 10 Hz trigger, which is issued before each pulse train arrival approximately 50 ms. The fast camera uses an STB synchronized signal which is generated every 15 s. The STB signal is composed of a 10 Hz trigger and a programmable TTL out signal by logical AND on the timing board. The fast camera is set to generate the output TTL signal at the start of recording of the first frame. This signal is detected by the TTL input module and only recorded data are tagged with the train ID. An oscilloscope is used to monitor these signals.
Figure 7
Figure 7
Logic diagram showing the generation of STB signal for the initiation of image acquisition by the fast camera. An enable signal from the TTL output is combined on the timing board with a 10 Hz synchronized trigger with a logical AND, and is used as the STB trigger signal for the fast camera to begin image acquisition. Once the fast camera begins the image acquisition, it generates a TTL signal from on AUX1 TTL output. This signal is connected to the TTL input of the PLC device where the data are tagged with a train ID upon detection of a rising edge.
Figure 8
Figure 8
(a) Timing signal configuration for image acquisition for one Shimadzu HPV-X2 camera and (b) plot of STB trigger delay versus mean intensity of each frame across the buffer. The slope indicated by the red lines in the graph represents the camera clock mismatch with the EuXFEL clock. The pulse separation at 1.128 MHz is 886 ns. However, the minimum increment for shifting acquisition available on the camera is 10 ns, resulting in a closest frame rate of 890 ns. This causes a drift of each subsequent acquisition window with respect to the scintillator emission by 4 ns and thus the total drift across the camera buffer is 512 ns. With a maximum possible acquisition time for each frame of 590 ns, the buffer can be aligned to record signal on all 128 frames. The delay range highlighted between the two dotted blue lines shows the optimal delay position where full buffer stays synchronized to all 128 X-ray pulses.
Figure 9
Figure 9
Shimadzu HPV-X2 camera used for beam monitoring: the fast camera allows intra-train recording of the beam at MHz rates. A slow camera simultaneously views the beam via an optical beam-splitter.
Figure 10
Figure 10
(a) Setup for the aluminium foaming process and (b) images of Al foam dynamics at different times within one pulse train.
Figure 11
Figure 11
One realization of different stages of a laser-induced explosion of a water droplet recorded using MHz XPCI. The images were denoised using a robust principal component analysis (Candès et al., 2011; Brunton & Kutz, 2022 ▸).
Figure 12
Figure 12
Stages of Kelvin–Helmholtz instability formation in a Venturi tube imaged at 1.128 MHz: (a) the flat-field-corrected images at three different time points and (b) the images after phase retrieval methods based on the alternating direction method of multipliers (Villanueva-Perez et al., 2017 ▸). Videos S1 and S2 of the supporting information show the flat-field-corrected and phase-retrieved data, respectively.

Similar articles

References

    1. ASTRO.tech (2024). Fiebig Astrotechnik, https://astrocontrol.de/en/homepage/. [Online; accessed 3 June 2024.]
    1. Ayyer, K., Xavier, P. L., Bielecki, J., Shen, Z., Daurer, B. J., Samanta, A. K., Awel, S., Bean, R., Barty, A., Bergemann, M., Ekeberg, T., Estillore, A. D., Fangohr, H., Giewekemeyer, K., Hunter, M. S., Karnevskiy, M., Kirian, R. A., Kirkwood, H., Kim, Y., Koliyadu, J., Lange, H., Letrun, R., Lübke, J., Michelat, T., Morgan, A. J., Roth, N., Sato, T., Sikorski, M., Schulz, F., Spence, J. C. H., Vagovic, P., Wollweber, T., Worbs, L., Yefanov, O., Zhuang, Y., Maia, F. R. N. C., Horke, D. A., Küpper, J., Loh, N. D., Mancuso, A. P. & Chapman, H. N. (2021). Optica, 8, 15–23.
    1. Bajt, S., Prasciolu, M., Fleckenstein, H., Domaracký, M., Chapman, H. N., Morgan, A. J., Yefanov, O., Messerschmidt, M., Du, Y., Murray, K. T., Mariani, V., Kuhn, M., Aplin, S., Pande, K., Villanueva-Perez, P., Stachnik, K., Chen, J. P., Andrejczuk, A., Meents, A., Burkhardt, A., Pennicard, D., Huang, X., Yan, H., Nazaretski, E., Chu, Y. S. & Hamm, C. E. (2018). Light Sci. Appl.7, 17162. - PMC - PubMed
    1. Bean, R. J., Aquila, A., Samoylova, L. & Mancuso, A. P. (2016). J. Opt.18, 074011.
    1. Boček, Ž., Petkovšek, M., Clark, S. J., Fezzaa, K. & Dular, M. (2024). Ultrason. Sonochem.108, 106970. - PMC - PubMed

LinkOut - more resources