. 2024 Nov 26;121(48):e2400464121.
doi: 10.1073/pnas.2400464121. Epub 2024 Nov 20.

KCTD10 p.C124W variant contributes to schizophrenia by attenuating LLPS-mediated synapse formation

Affiliations

KCTD10 p.C124W variant contributes to schizophrenia by attenuating LLPS-mediated synapse formation

Chenjun Mu et al. Proc Natl Acad Sci U S A. .

Abstract

KCTD10, a member of the potassium channel tetramerization domain (KCTD) family, is implicated in neuropsychiatric disorders and functions as a substrate recognition component within the RING-type ubiquitin ligase complex. A rare de novo variant of KCTD10, p.C124W, was identified in schizophrenia cases, yet its underlying pathogenesis remains unexplored. Here, we demonstrate that heterozygous KCTD10 C124W mice display pronounced synaptic abnormalities and exhibit schizophrenia-like behaviors. Mechanistically, we reveal that KCTD10 undergoes liquid-liquid phase separation (LLPS), a process orchestrated by its intrinsically disordered region (IDR). p.C124W mutation disrupts this LLPS capability, leading to diminished degradation of RHOB and subsequent excessive accumulation in the postsynaptic density fractions. Notably, neither IDR deletion nor p.C124W mutation in KCTD10 mitigates the synaptic abnormalities caused by Kctd10 deficiency. Thus, our findings implicate that LLPS may be associated with the pathogenesis of KCTD10-associated brain disorders and highlight the potential of targeting RHOB as a therapeutic strategy for diseases linked to mutations in KCTD10 or RHOB.

Keywords: KCTD10; liquid–liquid phase separation (LLPS); neuropsychiatric disorder; synaptic abnormalities.


Conflict of interest statement

Competing interests statement:The authors declare no competing interest.

Figures

Fig. 1.
Fig. 1.
Kctd10 ablation and C124W mutation lead to abnormal synaptic formation. (A) Detection of KCTD10 expression in the synaptosome from the mouse cortex by western blot with Synapsin1 and Snap25. WCL, whole cell lysate; SUP, supernatant; SYN, synaptosomes. n = 3 independent experiments. (B) Immunoblots showing the relative levels of KCTD10 and PSD95 in subcellular fractions. PSD, postsynaptic membrane fraction. n = 3 independent experiments. (C) Immunofluorescence images of pyramidal neurons in hippocampal CA1 region from Thy1-GFPm mouse brain, costained with GFP (magenta), KCTD10 (green), and PSD-95 (red) antibodies. (D) Represented EM images of synapses from the CA1 area of the hippocampus at P21. Arrows indicate presynaptic vesicles and arrowheads represent postsynaptic densities. (E) Quantification of PSD thickness and cleft length in cross-sections in (D). WT: n = 41, cKO: n = 34 (PSD thickness), WT: n = 38, cKO: n = 27 (cleft length) sections from three animals. (F) Left panel: representative images of spines on the secondary apical dendrites of pyramidal neurons in hippocampal CA1 area of indicated mice at P30. Right panel: quantification of spines in the Left panel. WT, C124W+/−, and C124W+/+: n = 16/3 ( n, dendrite number/brain number). (G) Representative images and quantification of spines on the secondary basal dendrites as in (F). WT, C124W+/−, and C124W+/+: n = 16/3 ( n, dendrite number/brain number). All data are presented as means ± SEM. Student’s t test: *P < 0.05, **P < 0.01, ****P < 0.0001. [Scale bars: 1 μm (C), 50 nm (D), 2 μm (F and G).]
Fig. 2.
Fig. 2.
C124W+/− mice exhibit abnormal behaviors. (A) Decreased PPI in C124W+/− mice. WT: n = 18, C124W+/−: n = 12 (3 mo old), WT: n = 9, C124W+/−: n = 17 (5 mo old). (B) Kctd10 C124W+/− mice showed lower scores in the nest-building test. WT: n = 9, C124W+/−: n = 17. (C) Kctd10 C124W+/− mice show impaired social interaction and novelty in the 3-chamber assay. C124W+/− mice did not show obvious preference for the social partner (stranger 1) or novel mouse (stranger 2). WT: n = 16, C124W+/−: n = 17. (D) C124W+/− mice exhibited a significant reduction in general sniffing and mounting events. WT: n = 20, C124W+/−: n = 17. (E) Time spent in the center area analyzed in open field assay. WT: n = 12, C124W+/−: n = 9. (F) Light–dark transition test. Time spent in the light and dark room, entries into the light room and preference index were examined. WT: n = 12, C124W+/−: n = 22. (G) Total arm entries and effective alternation calculated in Y maze. WT: n = 17, C124W+/−: n = 12. (H) C124W+/− mice exhibited defects in Morris water maze assay. WT: n = 15, C124W+/−: n = 20. All data are presented as means ± SEM. *P < 0.05, **P < 0.01, ***P < 0.001. (AG) Student’s t test. (H) Two-way ANOVA and Student’s t test.
Fig. 3.
Fig. 3.
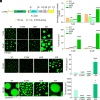
KCTD10 spontaneously assembles into liquid droplets both in vivo and in vitro. (A) Representative images of NIH3T3 cells expressing GFP-KCTD10. (B and C) Time-lapse imaging showing droplet fusion and fission events. (D) Representative images of GFP-KCTD10 expressed in NIH3T3 cells with or without 10% hexanediol treatment for 10 min. (E) Purified recombinant KCTD10 before and after acTEV protease treatment. (F) Representative images showing droplet fusion event of 10 μM GFP-KCTD10 in TBS buffer (20 mM Tris, 150 mM NaCl, pH 7.6). (G) Representative images of droplets formed by GFP-KCTD10 in vitro before and after 10% hexanediol treatment. (H) Images showing phase separation ability of 10 μM of KCTD10 at various salt concentrations as indicated at 25 °C. (I) Fluorescence images showing the phase separation potential under different protein concentration of KCTD10 as indicated. Reaction buffer (20 mM Tris, 150 mM-5 M NaCl, pH 7.6) was used throughout this study with indicated concentration of NaCl. [Scale bars: 5 μm (A and D), 1 μm (B and C), 10 μm (FH).]
Fig. 4.
Fig. 4.
KCTD10 LLPS is mediated by the C-terminal IDR sequence. (A) Graphs plotting intrinsic disorder (PONDR VSL2) for KCTD10. PONDR VSL2 score (y-axis) and amino acid position (x-axis) are shown. Black bar designates the IDR under investigation. (B) Representative images of NIH3T3 cells expressing GFP-KCTD10 and GFP-KCTD10 ΔIDR and statistical analysis for puncta size. Nuclei were stained with DAPI (blue). WT: n = 9, ΔIDR: n = 10 from >3 independent experiments. (C) Schematic diagram of KCTD10, KCTD10 ΔIDR, and KCTD10 IDR. (D) Representative images of liquid-like droplets formed by 10 μM GFP-KCTD10, GFP-KCTD10 ΔIDR, and GFP-KCTD10 IDR at 150 mM NaCl and 25 °C. (E) Quantification of puncta size for data in (D). KCTD10, KCTD10 ΔIDR, and KCTD10 IDR, n = 9 from >3 independent experiments. (F) Representative images of 10 or 20 μM KCTD10, KCTD10 ΔIDR, and KCTD10 IDR at 1 M NaCl and 25 °C. (G) Quantification of puncta size for data in (F). n = 9 from >3 independent experiments. (H) FRAP analysis of KCTD10 IDR droplets formed at 1 M NaCl with 20 μM protein at 25 °C. (I) Quantitative FRAP for data in (H). All data are presented as means ± SEM. ****P < 0.0001. Student’s t test. [Scale bars: 5 μm (B), 10 μm (D and F), 2 μm (H).]
Fig. 5.
Fig. 5.
Lipid membrane promotes LLPS of KCTD10. (A and B) Representative images of GFP-KCTD10 undergoing phase separation at 1 M or 150 mM NaCl mixed with different volumes of liposomes and quantification of puncta size. n > 3 independent experiments. (C) LLPS of KCTD10 enhanced with increasing protein concentration at 150 mM NaCl with the addition of liposomes. 1, 10, 20 μM: n = 6, 5 μM: n = 9 experiments from >3 biological replicates. (D) Representative images of GFP-KCTD10 undergoing phase separation under different temperature at 150 mM NaCl with the addition of liposomes. (E and F) The fusion phenomenon of GFP-KCTD10 and GFP-KCTD10 IDR droplets at 150 mM NaCl in the presence of liposomes. (G) 10% 1,6-HD disrupted the droplets formed by GFP-KCTD10 at 150 mM NaCl with the addition of liposomes. (H) Representative images of droplets formed by GFP-KCTD10, GFP-KCTD10 ΔIDR, and GFP-KCTD10 IDR at 150 mM NaCl with the addition of liposomes and quantification of puncta size. GFP-KCTD10 WT: n = 8, GFP-KCTD10 ΔIDR: n = 9, GFP-KCTD10 IDR: n = 8 experiments from >3 replicates. (I) Images showing the detection of liposomes (NBD-LUV) and mCherry–KCTD10 in a mixture of 200 μM liposomes and 20 μM KCTD10. LUV, large unilamellar vesicle. All data are shown as means ± SEM. **P < 0.01, ***P < 0.001, ****P < 0.0001, ns: no significance. Student’s t test. [Scale bars: 10 μm (AD and GI), 50 μm (E, Top panel), 20 μm (E, Bottom panel), 1 μm (F).]
Fig. 6.
Fig. 6.
Schizophrenia-associated KCTD10 variation leads to reduced LLPS capacity. (A) Schematic diagram of KCTD10 C124W mutation. (B) Quantification of solution turbidity of KCTD10 WT and indicated mutants measured at an optical density of 600 nm (OD600). n = 3 independent experiments. (C) Representative images of droplets formed by 10 or 20 μM indicated proteins at 1 M NaCl at 25 °C. (D) Quantification of puncta size for data in (C). (E) Representative images of condensates formed by 10 μM indicated proteins at 150 mM NaCl at 25 °C. (F) Quantification of puncta size for data in (E). (G) Images of condensates formed by 10 μM indicated proteins mixed with liposomes in 150 mM NaCl at 25 °C. (H) Quantification of puncta size for data in (G). All data are shown as means ± SEM. *P < 0.05, **P < 0.01, ****P < 0.0001. Student’s t test. n = 9 experiments from at least 3 replicates in (D, F, and H). [Scale bars: 10 μm (C, E, and G).]
Fig. 7.
Fig. 7.
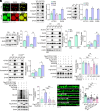
Degradation of RHOB by KCTD10 requires its LLPS ability. (A) Confocal images of cocondensates formed by 10 μM KCTD10 (green, mGFP-KCTD10) and RHOB (red, mCherry-RHOB) in 1 M NaCl alone or 150 mM NaCl mixed with liposomes. (B) Levels of KCTD10 and RHOB in high purity extracted synaptosomes analyzed by western blotting with Synapsin1, Snap25, and Synaptophysin as markers for synaptosomes. n = 4 experiments. (C) Western blot analysis of KCTD10 and RHOB in the PSD fraction of the mouse hippocampus on P60. n = 3 experiments. (D) P14 and P21 cortices from Kctd10 cKO and WT littermates were analyzed by immunoblotting for RHOB. (E) Synaptosome from the hippocampus of WT and Kctd10 cKO littermates on P21 were analyzed for RHOB expression, n = 3 experiments. (F) RHOB expression in synaptosome-enriched fractions obtained from the hippocampi of WT and C124W+/+ mice at P60, n = 3 experiments. (G) Expression of HA-RHOB, Myc-CUL3, His-UB in HEK293T cells alone or together with KCTD10 WT, KCTD10 ΔIDR, and KCTD10 C124W. Cell lysates were analyzed by immunoblotting with indicated antibodies, n = 4 experiments. (H) KCTD10, but not KCTD10 ΔIDR and KCTD10 C124W significantly induces the ubiquitination of RHOB. HA-RHOB and Myc-Ub were cotransfected with Flag-KCTD10, KCTD10 ΔIDR, or KCTD10 C124W, immunoprecipitated with HA antibody, and probed with HA, Flag, and Myc antibodies, n = 4 experiments. (I) Left panel: representative images of primary cultured neurons transfected with sh4 alone or together with KCTD10 WT (KC10), KC10 ΔIDR, or KC10 C124W. Right panel: quantification of spines in Left panel. n = 16 for each group from >3 independent experiments. All data are displayed as means ± SEM. *P < 0.05, **P < 0.01, ***P < 0.001, ****P < 0.0001, ns: no significance. Student’s t test. [Scale bars: 10 μm (A), 5 μm (I).]
Fig. 8.
Fig. 8.
Pathogenesis of KCTD10 C124W mutation. Schematic model illustrates that KCTD10 p.C124W mutation may impede the degradation of RHOB by reducing the phase separation ability of KCTD10, leading to abnormal synaptic maturation and the manifestation of schizophrenia-like behaviors in p.C124W heterozygous mice.

Similar articles

Cited by

References

    1. Zhang H., et al. , Liquid-liquid phase separation in biology: Mechanisms, physiological functions and human diseases. Sci. China Life Sci. 63, 953–985 (2020). - PubMed
    1. Bai G., Wang Y., Zhang M., Gephyrin-mediated formation of inhibitory postsynaptic density sheet via phase separation. Cell Res. 31, 312–325 (2021). - PMC - PubMed
    1. Feng Z., Chen X., Zeng M., Zhang M., Phase separation as a mechanism for assembling dynamic postsynaptic density signalling complexes. Curr. Opin. Neurobiol. 57, 1–8 (2019). - PubMed
    1. Chen X., Wu X., Wu H., Zhang M., Phase separation at the synapse. Nat. Neurosci. 23, 301–310 (2020). - PubMed
    1. Milovanovic D., Wu Y., Bian X., De Camilli P., A liquid phase of synapsin and lipid vesicles. Science 361, 604–607 (2018). - PMC - PubMed

Substances

LinkOut - more resources