

Adhesive interactions within microbial consortia can be differentiated at the single-cell level through expansion microscopy
- PMID: 39565308
- PMCID: PMC11621516
- DOI: 10.1073/pnas.2411617121
Adhesive interactions within microbial consortia can be differentiated at the single-cell level through expansion microscopy
Abstract
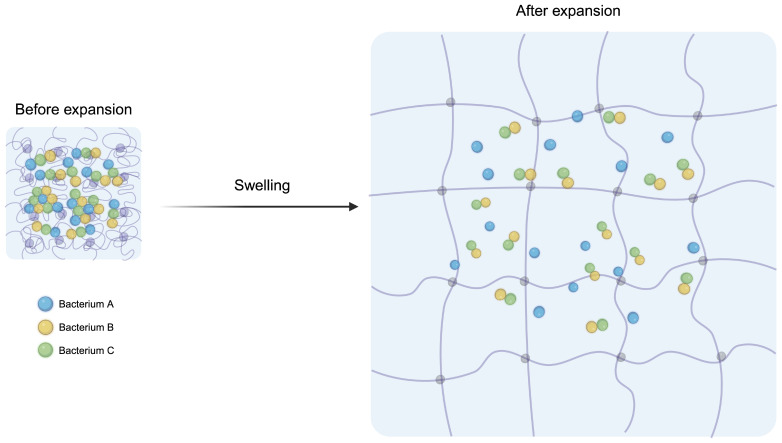
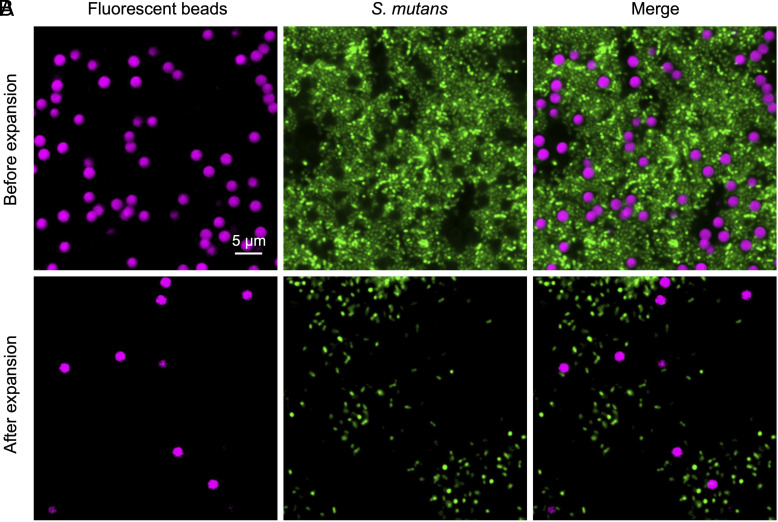
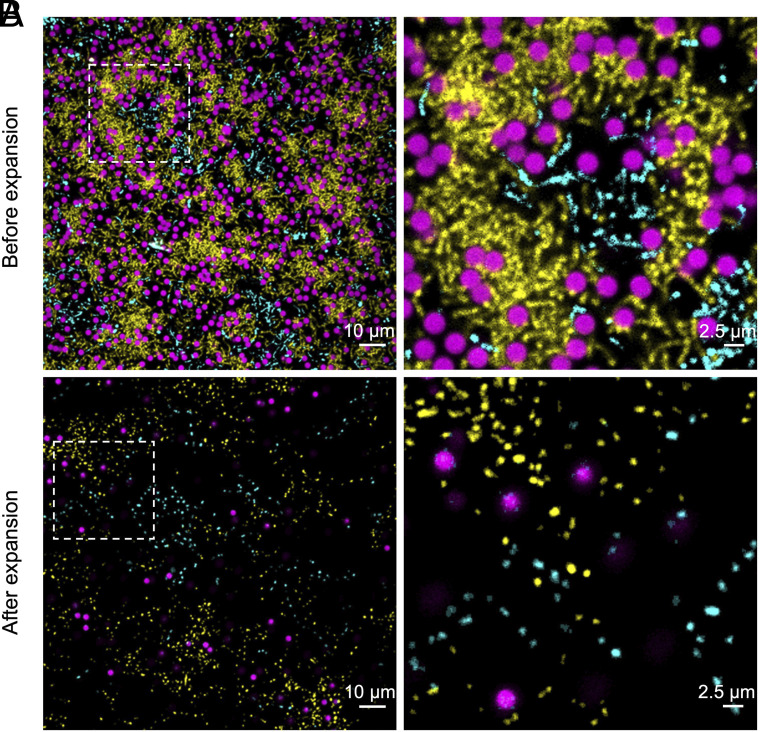
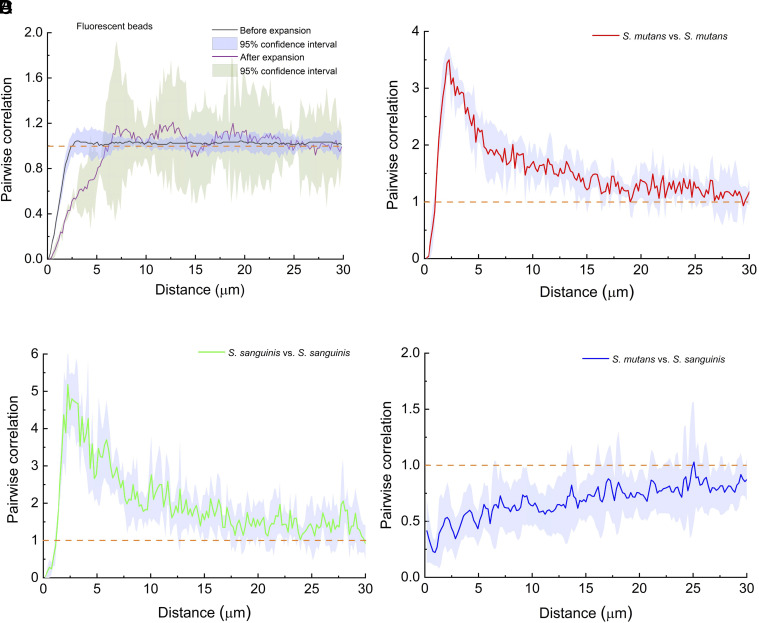
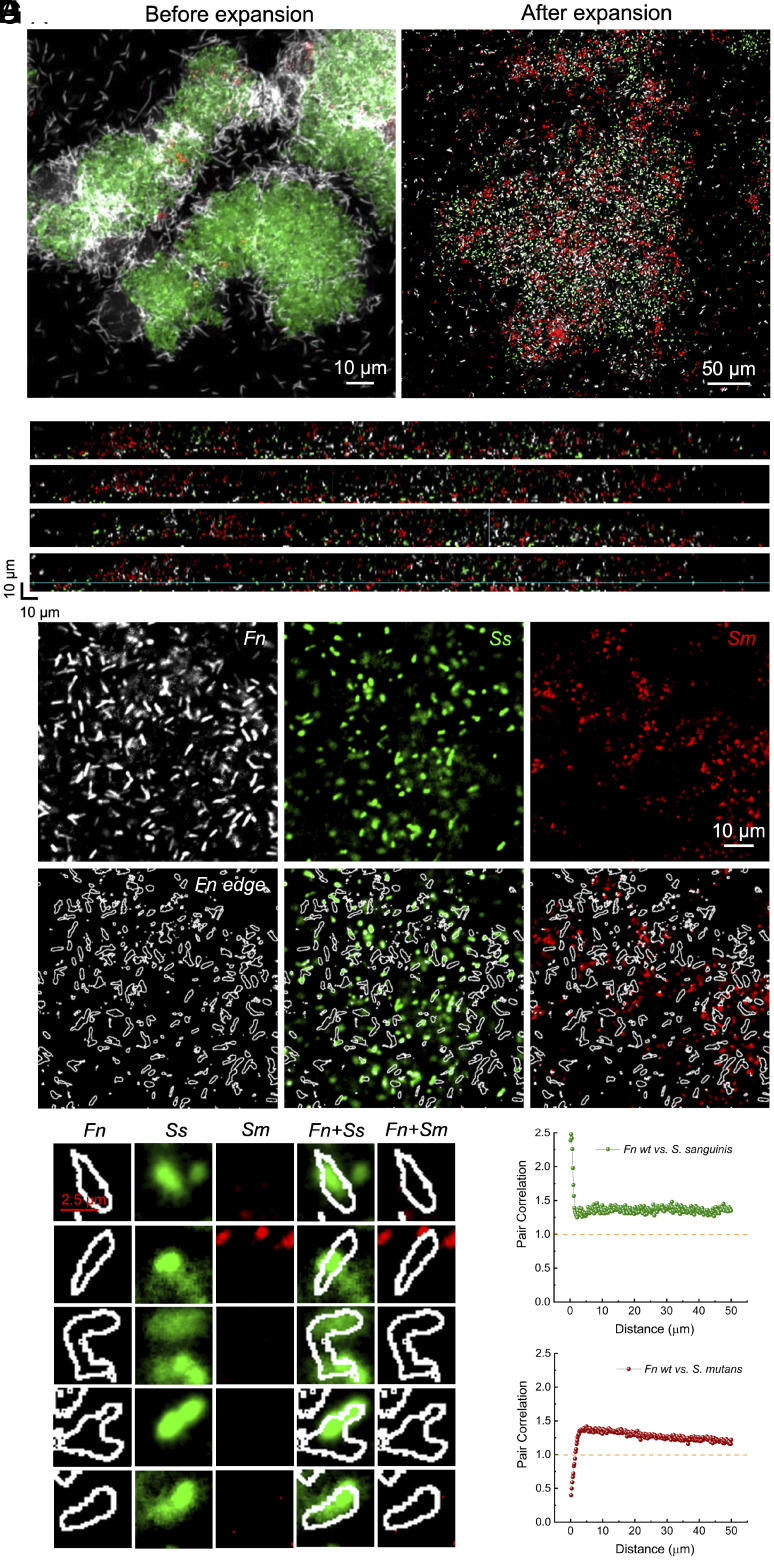
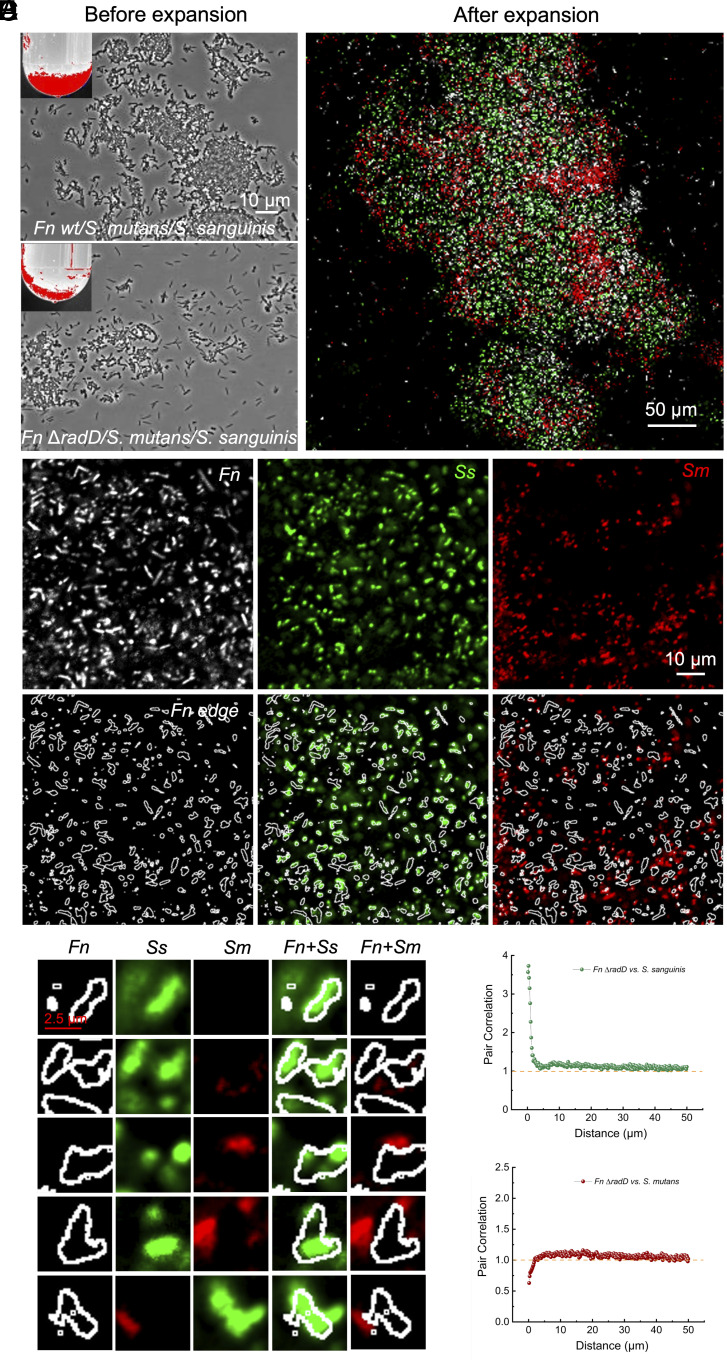
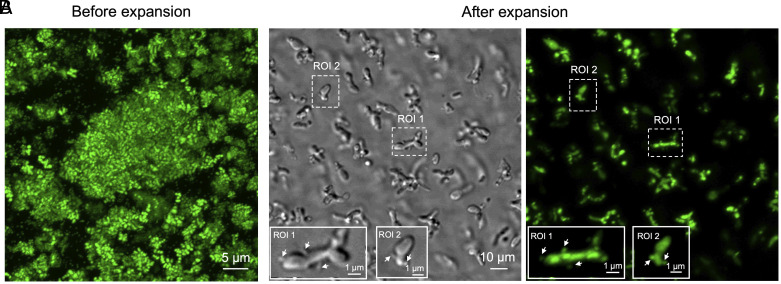
Investigating microbe-microbe interactions at the single-cell level is critical to unraveling the ecology and dynamics of microbial communities. In many situations, microbes assemble themselves into densely packed multispecies biofilms. The density and complexity pose acute difficulties for visualizing individual cells and analyzing their interactions. Here, we address this problem through an unconventional application of expansion microscopy, which allows for the "decrowding" of individual bacterial cells within a multispecies community. Expansion microscopy generally has been carried out under isotropic expansion conditions and used as a resolution-enhancing method. In our variation of expansion microscopy, we carry out expansion under heterotropic conditions; that is, we expand the space between bacterial cells but not the space within individual cells. The separation of individual bacterial cells from each other reflects the competition between the expansion force pulling them apart and the adhesion force holding them together. We employed heterotropic expansion microscopy to study the relative strength of adhesion in model biofilm communities. These included mono- and dual-species Streptococcus biofilms and a three-species synthetic community (Fusobacterium nucleatum, Streptococcus mutans, and Streptococcus sanguinis) under conditions that facilitated interspecies coaggregation. Using adhesion mutants, we investigated the interplay between F. nucleatum outer membrane protein RadD and different Streptococcus species. We also examined the Schaalia-TM7 epibiont association. Quantitative proximity analysis was used to evaluate the separation of individual microbial members. Our study demonstrates that heterotropic expansion microscopy can "decrowd" dense biofilm communities, improve visualization of individual bacterial members, and enable analysis of microbe-microbe adhesive interactions at the single-cell level.
Keywords: expansion microscopy; human microbiome; microbial adhesion; polymicrobial communities; single-cell level.
Conflict of interest statement
Competing interests statement:The authors declare no competing interest.
Figures
Update of
-
Adhesive interactions within microbial consortia can be differentiated at the single-cell level through expansion microscopy.bioRxiv [Preprint]. 2024 Jun 25:2024.06.25.600639. doi: 10.1101/2024.06.25.600639. bioRxiv. 2024. Update in: Proc Natl Acad Sci U S A. 2024 Nov 26;121(48):e2411617121. doi: 10.1073/pnas.2411617121. PMID: 38979233 Free PMC article. Updated. Preprint.
Similar articles
-
Adhesive interactions within microbial consortia can be differentiated at the single-cell level through expansion microscopy.bioRxiv [Preprint]. 2024 Jun 25:2024.06.25.600639. doi: 10.1101/2024.06.25.600639. bioRxiv. 2024. Update in: Proc Natl Acad Sci U S A. 2024 Nov 26;121(48):e2411617121. doi: 10.1073/pnas.2411617121. PMID: 38979233 Free PMC article. Updated. Preprint.
-
Interactions between Lactobacillus rhamnosus GG and oral micro-organisms in an in vitro biofilm model.BMC Microbiol. 2016 Jul 12;16(1):149. doi: 10.1186/s12866-016-0759-7. BMC Microbiol. 2016. PMID: 27405227 Free PMC article.
-
Streptococcus mutans SpaP binds to RadD of Fusobacterium nucleatum ssp. polymorphum.Mol Oral Microbiol. 2017 Oct;32(5):355-364. doi: 10.1111/omi.12177. Epub 2017 Feb 13. Mol Oral Microbiol. 2017. PMID: 27976528 Free PMC article.
-
Multispecies communities: interspecies interactions influence growth on saliva as sole nutritional source.Int J Oral Sci. 2011 Apr;3(2):49-54. doi: 10.4248/IJOS11025. Int J Oral Sci. 2011. PMID: 21485308 Free PMC article. Review.
-
Mini-review: Microbial coaggregation: ubiquity and implications for biofilm development.Biofouling. 2014;30(10):1235-51. doi: 10.1080/08927014.2014.976206. Biofouling. 2014. PMID: 25421394 Review.
References
-
- Costerton J. W., Lewandowski Z., Caldwell D. E., Korber D. R., Lappin-Scott H. M., Microbial biofilms. Ann. Rev. Microbiol. 49, 711–745 (1995). - PubMed
-
- Kolenbrander P. E., Palmer R. J., Periasamy S., Jakubovics N. S., Oral multispecies biofilm development and the key role of cell–cell distance. Nat. Rev. Microbiol. 8, 471–480 (2010). - PubMed
-
- Flemming H.-C., Wuertz S., Bacteria and archaea on Earth and their abundance in biofilms. Nat. Rev. Microbiol. 17, 247–260 (2019). - PubMed
-
- Wimpenny J. W. T., Spatial order in microbial ecosystems. Biol. Rev. 56, 295–342 (1981).
MeSH terms
Grants and funding
LinkOut - more resources
Full Text Sources
