. 2024 Nov 30;38(22):e70154.
doi: 10.1096/fj.202401665R.

METTL3 and IGF2BP2 coordinately regulate FOSL1 mRNA via m6A modification, suppressing trophoblast invasion and contributing to fetal growth restriction

Affiliations

METTL3 and IGF2BP2 coordinately regulate FOSL1 mRNA via m6A modification, suppressing trophoblast invasion and contributing to fetal growth restriction

Ruixin Chen et al. FASEB J. .

Abstract

Fetal growth restriction (FGR) increases the risk of short-term and long-term complications. Widespread N6-methyladenosine (m6A) modifications on mRNAs have been found to be involved in various biological processes. However, the role of m6A modification in the pathogenesis of FGR remains elusive. Here, we report that elevated levels of METTL3 and m6A modification were detected in FGR placentae. Functionally, cell migration, invasion, and proliferation abilities were suppressed after METTL3 overexpression in HTR8/SVneo cells. Subsequently, methylated RNA immunoprecipitation sequencing (MeRIP-seq) and RNA sequencing (RNA-seq) of METTL3-knockdown HTR8/SVneo cells were utilized together to identify FOSL1 as the downstream target genes of METTL3. Furthermore, we illustrated that METTL3-mediated m6A modification enhanced the expression of FOSL1 in a IGF2BP2 dependent manner. FOSL1 inhibited trophoblast invasion and migration. Importantly, STM2457, a novel METTL3 catalytic inhibitor, was intravenously administered to FGR mice models, which restore fetal and placental weights in vivo. In vitro STM2457 regulated trophoblast proliferation, invasion, and migration in a dose-dependent manner. In summary, this study reveals that METTL3 and IGF2BP2 increase FOSL1 expression in an m6A-dependent manner. The increase of FOSL1disrupts normal trophoblast invasion, which results in the progression of FGR. METTL3 can serve as a potential target for FGR therapy.

Keywords: FOSL1; METTL3; N6‐methyladenosine; STM2457; fetal growth restriction; trophoblast dysfunction.


Figures

FIGURE 1
FIGURE 1
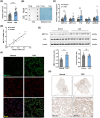
The levels of N6‐methyladenosine and METTL3 were elevated in fetal growth restriction. (A) The RNA m6A methylation levels in chorionic villous tissues from FGR (n = 27) and normal group (n = 23) were assessed using the EpiQuik m6A RNA methylation quantification kit (****p < .0001 vs. Normal group). (B) The m6A levels in chorionic villous tissues from FGR and normal group were detected via m6A dot blot assay. (C) qRT‐PCR analysis of METTL3, METTL14, WTAP, FTO, and ALKBH5 mRNA levels in chorionic villous tissues from FGR and normal group (n = 20 per group), (**p < .01 vs. Normal group). (D) Linear regression analysis of METTL3 mRNA levels and relative m6A methylation levels in chorionic villous tissues. (E) Western blot analysis of METTL3 and FTO protein levels in chorionic villous tissues from FGR and normal group (n = 7 per group), (**p < .01; ns = nonsignificant vs. Normal group). (F) IF staining of METTL3 (green) and CK7 (red) in frozen sections of term placentae from FGR and normal group; nuclei were stained with DAPI (blue) (scale bar: 50 μm). (G) IHC staining of METTL3 in term placentae from FGR and normal group (scale bar: 100 μm). The results are the mean ± SEM.
FIGURE 2
FIGURE 2
METTL3‐mediated m6A methylation inhibited the proliferation, invasion, and migration of HTR‐8 cells. (A) qRT‐PCR analysis and (B) western blot analysis showed the expression levels of METTL3 in HTR‐8 cells transfected with sh‐METTL3 and METTL3‐overexpressing lentivirus after 48 h (n = 3 each), (****p < .0001 vs. WT, sh‐NC and vector). (C) The RNA m6A methylation levels were assessed in HTR‐8 cells transfected with sh‐METTL3 and METTL3‐overexpressing lentivirus after 48 h (n = 3 each), (**p < .01 vs. WT and sh‐NC; ****p < .0001 vs. WT and vector). (D) The invasion and migration ability of METTL3 overexpression and knockdown cells were confirmed by Transwell assay (scale bar: 200 μm) (n = 3 each), (**p < .01 vs. vector; ***p < .001 vs. sh‐NC and vector; ****p < .0001 vs. sh‐NC). (E) The migration ability of METTL3 overexpression and knockdown cells were confirmed by wound‐healing assay (scale bar: 1 mm) (n = 3 each), (**p < .01 vs. sh‐NC and vector). (F) EdU staining of METTL3 overexpression and knockdown cells; nuclei were stained with DAPI (blue) (scale bar: 100 μm) (n = 3 each), (***p < .001 vs. sh‐NC and vector). (G) Cell proliferation ability of METTL3 overexpression and knockdown cells were confirmed by CCK8 assay (n = 3 each), (*p < .01 vs. sh‐NC; ***p < .001 vs. vector). (H) Flow cytometry analysis of cell apoptosis of METTL3 overexpression and knockdown cells (n = 3 each), (ns = nonsignificant vs. sh‐NC and vector). The results are the mean ± SEM.
FIGURE 3
FIGURE 3
METTL3‐mediated m6A modification enhanced the expression and mRNA stability of FOSL1. (A) Peak distribution of m6A modification across mRNA transcripts. (B) The consensus sequence motif for m6A methylation was identified by MeRIP‐seq. (C) Volcano plot showed differentially expressed genes in sh‐METTL3 and sh‐NC groups. (D) GO enrichment analysis reflected the distribution of differential genes (E) KEGG pathway analysis of genes differentially expressed. (F) Distribution of genes with significant changes in mRNA levels (up or down) and m6A levels (hyper or hypo) in sh‐METTL3 and sh‐NC groups (fc, |fold change| ≥1.2; p < .05). (G) Venn diagram showed both m6A hypomethylated and RNA downregulated genes in METTL3 knockdown cells identified by RNA‐seq and MeRIP‐seq. (H) MeRIP‐qPCR analysis illustrated enrichment of m6A‐modified FOSL1, DDX10, TMEM158 and ALDH1A3 in HTR‐8 cells (n = 3 each). The results are the mean ± SEM.
FIGURE 4
FIGURE 4
MeRIP‐Seq identified m6A modification profile and downstream targets in trophoblast cells. (A and B) qRT‐PCR analysis showed the mRNA levels of FOSL1, DDX10, TMEM158 and ALDH1A3 in (A) METTL3 overexpression and (B) METTL3 knockdown cells (n = 3 each), (*p < .05 vs. vector and sh‐NC; ***p < .001 vs. vector and sh‐NC; ****p < .0001 vs. vector). (C and D) MeRIP‐qPCR analysis illustrated m6A‐modified levels of FOSL1 in (C) METTL3 overexpression and (D) METTL3 knockdown cells (n = 3 each), (*p < .05 vs. sh‐NC; ***p < .001 vs. vector). (E and F) Western blot analysis showed the protein levels of FOSL1 in (E) METTL3 overexpression and (F) METTL3 knockdown cells. (G) IGV analysis illustrated peak distribution of FOSL1in MeRIP profiles of sh‐METTL3 cells compared to sh‐NC cells. (H) RIP‐qPCR assay was performed to detect the direct binding of METTL3 protein to FOSL1, DDX10, TMEM158, and ALDH1A3 mRNA in HTR‐8 cells (n = 3 each). (I) qRT‐PCR analysis of YTHDF1, YTHDF3, IGF2BP2, and HNRNPA2B1 mRNA levels in chorionic villous tissues from FGR and normal group (n = 9–10 per group), (**p < .01 vs. Normal group). (J) RNA stability assay showed the FOSL1 mRNA half‐life in METTL3 overexpression cells after being treated with actinomycin D (5 μg/mL) (n = 3 each), (***p < .001 vs. vector). (K–M) RIP‐qPCR assay was performed to detect the direct interaction between IGF2BP2 protein and FOSL1 mRNA in (K) HTR‐8 cells, (L) METTL3 overexpression and (M) METTL3 knockdown cells (n = 3 each), (***p < .001 vs. vector; ****p < .0001 vs. IgG and sh‐NC). The results are the mean ± SEM.
FIGURE 5
FIGURE 5
FOSL1 inhibited invasion and migration of trophoblast cells. (A) qRT‐PCR analysis and (B) western blot analysis showed the expression levels of FOSL1 in chorionic villous tissues from FGR and normal group (n = 5–9 per group), (**p < .01 vs. Normal group). (C) IF staining of FOSL1 (red) in frozen sections of term placentae from FGR and normal group; nuclei were stained with DAPI (blue) (scale bar: 50 μm). (D) The invasion and migration ability of FOSL1 silencing HTR‐8 cells were confirmed by Transwell assay (n = 3 each), (***p < .001 vs. si‐NC; ****p < .0001 vs. si‐NC). (E) Cell proliferation ability of FOSL1 knockdown cells was confirmed by CCK8 assay (n = 3 each), (ns = nonsignificant vs. si‐NC). (F) Flow cytometry analysis of cell apoptosis of FOSL1 knockdown cells (n = 3 each), (ns = nonsignificant vs. si‐NC). (G) The invasion and migration ability of si‐FOSL1 after METTL3 overexpression in HTR‐8 cells were confirmed by Transwell assay (scale bar: 200 μm) (n = 3 each). The results are the mean ± SEM.
FIGURE 6
FIGURE 6
The effects of METTL3 inhibitor on FGR progression in vivo. (A) Scheme of experimental design. (B and C) Representative photographs showed gross morphological appearance of (B) fetuses and (C) placentas from normal, low protein diet and STM2457 treatment groups on E18.5 (n = 5 per group of dams). (D) Fetal birth weights (ns = nonsignificant vs. Low protein; ****p < .0001 vs. Normal and Low protein + vehicle), and (E) placental weights at E18.5 (n = 66–93 from 22 dams), (ns = nonsignificant vs. Low protein; ***p < .001 vs. Low protein + vehicle; ****p < .0001 vs. Normal). (F) H&E‐stained histological sections of isolated fetuses at E18.5 (scale bar: 1000 μm). (G) Full and high magnification images of PAS‐stained placental sections at E18.5 (scale bar: 500 μm of upper panel; 100 μm of lower panel). (H) The RNA m6A methylation levels in placentae from each group at E18.5 were assessed using the EpiQuik quantification kit (n = 5 per group), (*p < .05 vs. Normal; **p < .01 vs. Normal).
FIGURE 7
FIGURE 7
The effects of STM2457 on METTL3 expression and m6A modification in vitro. (A) Western blot analysis showed the expression levels of METTL3 in HTR‐8 cells treated with STM2457 (0.05, 0.5, 1, 5, 10, 25, and 50 mM) or DMSO (5 mM) after 48 h (n = 3 each), (*p < .05 vs. DMSO; ****p < .0001 vs. DMSO). (B) The RNA m6A methylation levels in HTR‐8 cells treated with STM2457 (0, 0.05, 0.5, 1, 5, 10, 25, and 50 mM) or DMSO (5 mM) after 48 h was assessed using the EpiQuik quantification kit (n = 3 each), (*p < .01 vs. DMSO; ***p < .001 vs. DMSO; ****p < .0001 vs. DMSO). (C) Cell viability of HTR‐8 cells treated with STM2457 (0.05, 0.5, 1, 5, 10, 25, and 50 mM) or DMSO (5 mM) after 48 h were confirmed by CCK8 assay (n = 3 each), (ns = nonsignificant vs. DMSO; *p < .01 vs. DMSO; ***p < .001 vs. DMSO; ****p < .0001 vs. DMSO). (D) Transwell assay revealed ability of HTR‐8 cells treated with STM2457 (0.05, 1, and 5 mM) or DMSO (5 mM) after 48 h in invasion (n = 3 each), (ns = nonsignificant vs. DMSO; *p < .01 vs. DMSO; **p < .01 vs. DMSO) and migration (n = 3 each), (ns = nonsignificant vs. DMSO; *p < .01 vs. DMSO; **p < .01 vs. DMSO) (scale bar: 200 μm). (E) Flow cytometry analysis of cell apoptosis HTR‐8 cells treated with STM2457 (0.05, 1, and 5 mM) or DMSO (5 mM) after 48 h (n = 3 each), (**p < .01 vs. DMSO; ***p < .001 vs. DMSO). The results are the mean ± SEM.
FIGURE 8
FIGURE 8
The graphic illustration of the mechanism by which METTL3‐mediated m6A modification regulates FOSL1 expression to inhibit trophoblast invasion in FGR progression.

Similar articles

References

    1. Lubrano C, Taricco E, Coco C, Di Domenico F, Mandò C, Cetin I. Perinatal and neonatal outcomes in fetal growth restriction and small for gestational age. J Clin Med. 2022;11:2729. - PMC - PubMed
    1. Fetal growth restriction: ACOG practice bulletin, number 227. Obstet Gynecol. 2021;137:e16‐e28. - PubMed
    1. Burton GJ, Jauniaux E. Pathophysiology of placental‐derived fetal growth restriction. Am J Obstet Gynecol. 2018;218:S745‐s761. - PubMed
    1. Flamand MN, Tegowski M, Meyer KD. The proteins of mRNA modification: writers, readers, and erasers. Annu Rev Biochem. 2023;92:145‐173. - PMC - PubMed
    1. Liu J, Yue Y, Han D, et al. A METTL3‐METTL14 complex mediates mammalian nuclear RNA N6‐adenosine methylation. Nat Chem Biol. 2014;10:93‐95. - PMC - PubMed

MeSH terms

LinkOut - more resources