

Motion in the depth direction appears faster when the target is closer to the observer
- PMID: 39565384
- PMCID: PMC11579063
- DOI: 10.1007/s00426-024-02040-w
Motion in the depth direction appears faster when the target is closer to the observer
Abstract
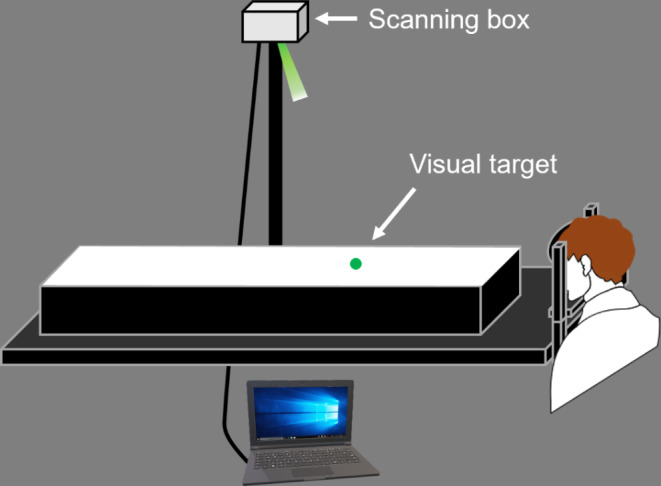
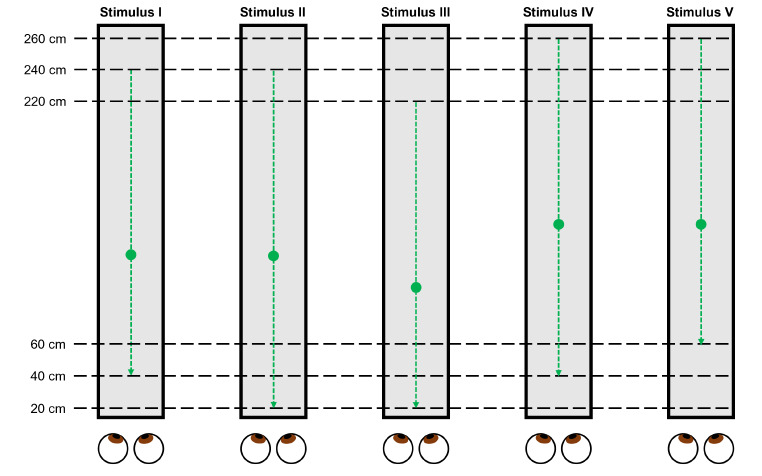
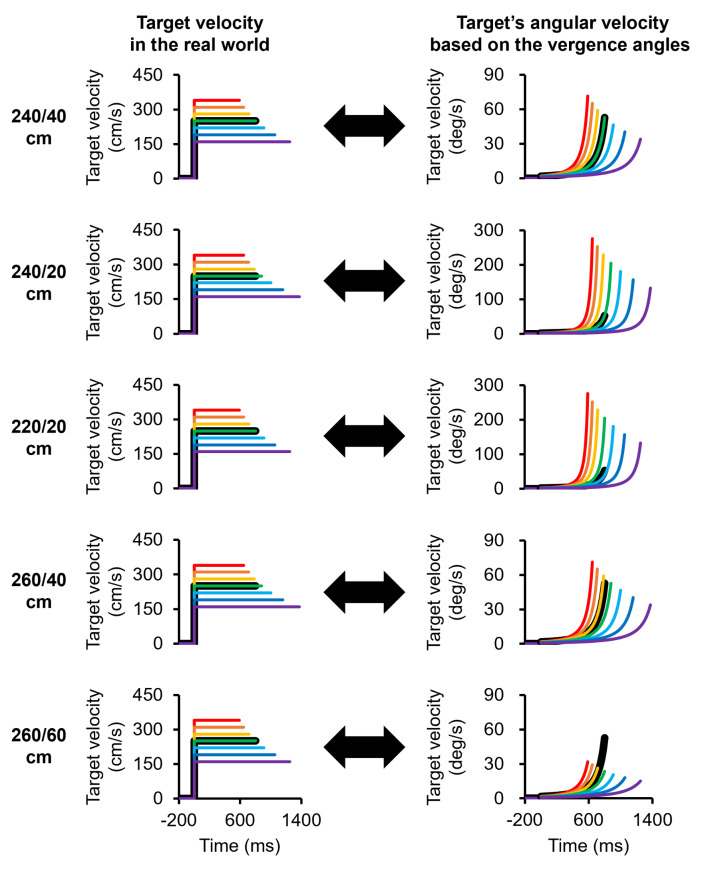
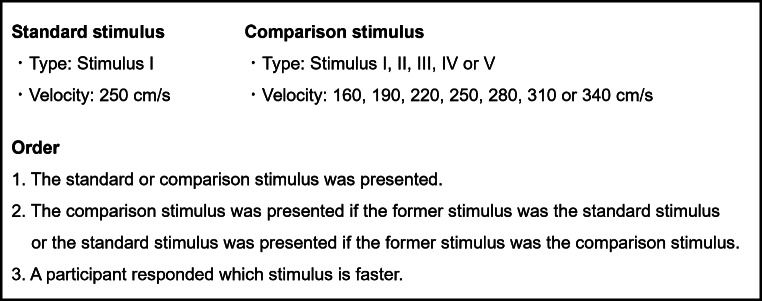
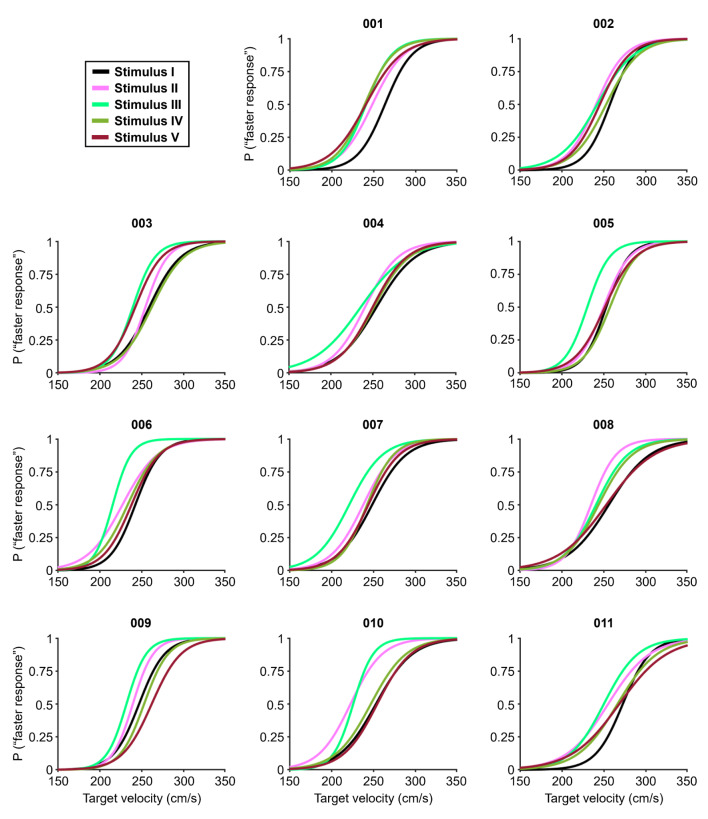
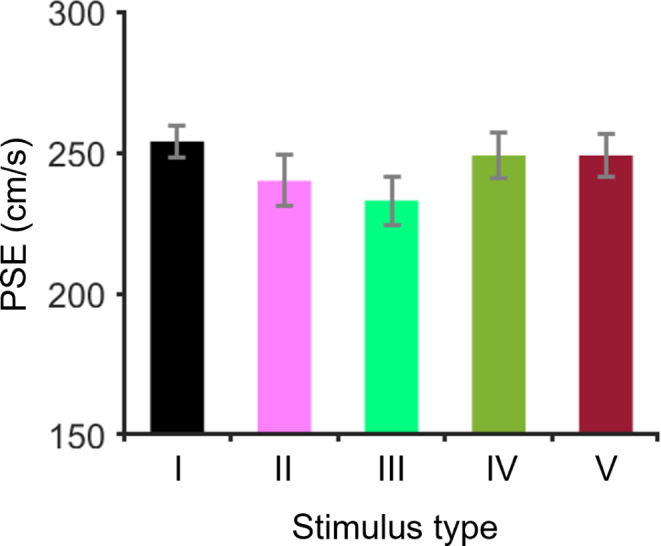
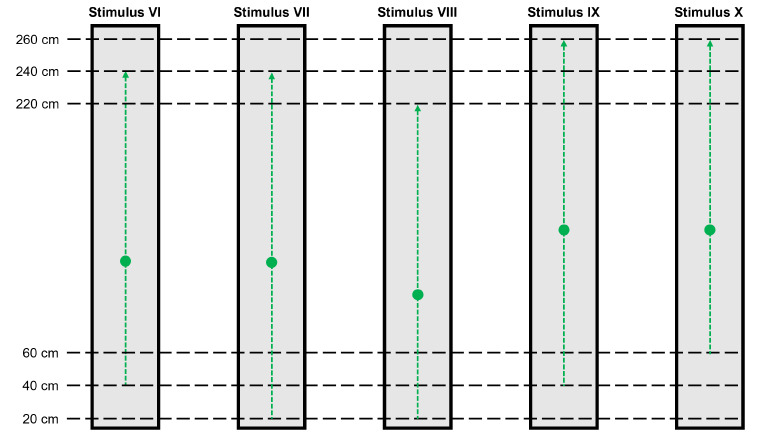
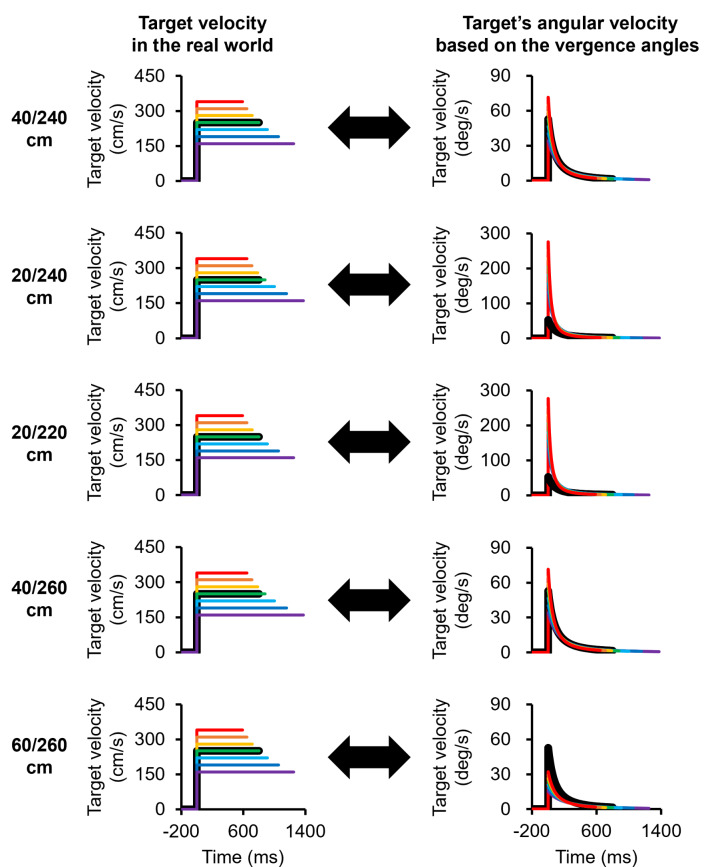
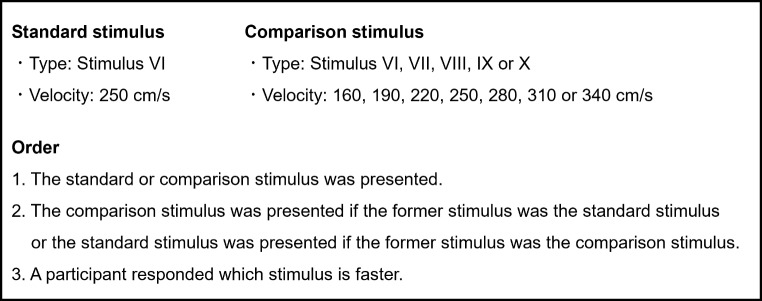
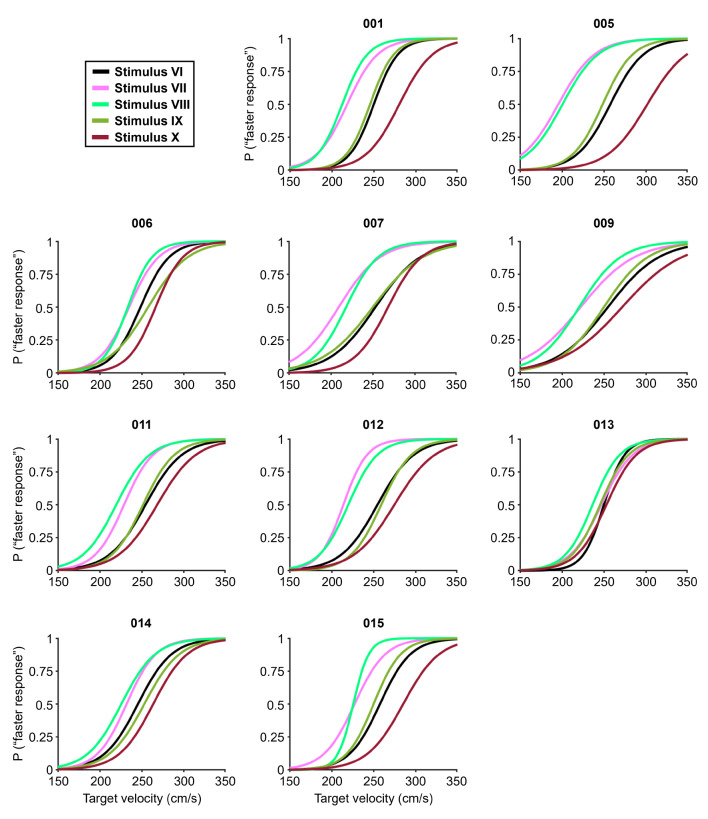
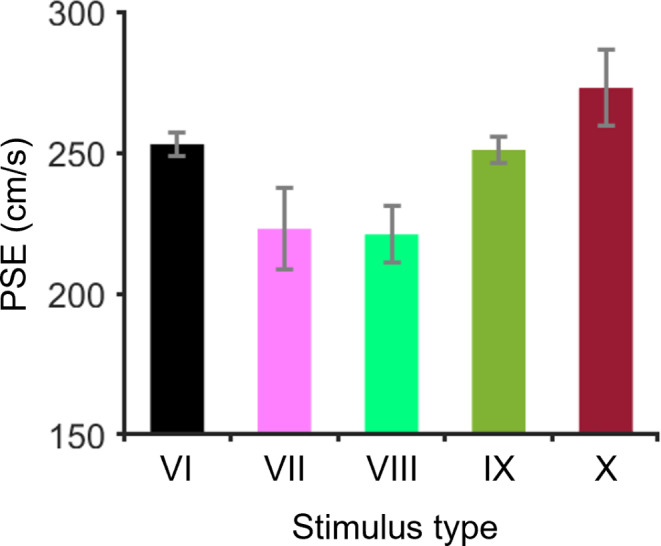
The target velocity at the retina and the initial phase of target motion are known to affect the perceived velocity of a target in planar motion. For depth motion, however, the role of this information in velocity perception remains unclear. Therefore, the purpose of this study was to reveal the role of the angular velocity derived from the vergence angle and the initial phase of target motion on the perceived velocity for depth motion. We devised two experimental tasks with five stimuli and used a two-alternative forced-choice paradigm to investigate velocity perception. In the tasks, a target moving toward or away from the observer was used. The five stimuli in each task moved between 40 and 240 cm (standard stimulus), 20 and 240 cm, 20 and 220 cm, 40 and 260 cm, and 60 and 260 cm from the participants. In the comparison of the standard stimulus with other stimuli, the stimuli approaching or receding from a distance of 20 cm were perceived as faster than the standard stimulus approaching or receding from a distance of 40 cm. We also showed that the stimuli that receded starting from a distance of 60 cm were perceived as moving slower than the standard stimulus. Our results suggest that larger changes in angular velocity affect velocity perception for depth motion; thus, observers perceive the target velocity as faster when the target is closer to the observer.
© 2024. The Author(s).
Conflict of interest statement
Declarations. Conflict of interest: The authors have no competing interests to declare that are relevant to the content of this article.
Figures
Similar articles
-
Motion distorts perceived depth.Vision Res. 2003 Aug;43(17):1799-804. doi: 10.1016/s0042-6989(03)00307-9. Vision Res. 2003. PMID: 12826103
-
The effect of real-world and retinal motion on speed perception for motion in depth.PLoS One. 2023 Mar 16;18(3):e0283018. doi: 10.1371/journal.pone.0283018. eCollection 2023. PLoS One. 2023. PMID: 36928499 Free PMC article.
-
Bias to experience approaching motion in a three-dimensional virtual environment.Perception. 2004;33(3):259-76. doi: 10.1068/p5190. Perception. 2004. PMID: 15176612
-
Additivity of retinal and pursuit velocity in the perceptions of depth and rigidity from object-produced motion parallax.Perception. 2007;36(1):125-34. doi: 10.1068/p5562. Perception. 2007. PMID: 17357710
-
Scaling of compensatory eye movements during translations: virtual versus real depth.Neuroscience. 2013 Aug 29;246:73-81. doi: 10.1016/j.neuroscience.2013.04.029. Epub 2013 Apr 30. Neuroscience. 2013. PMID: 23639883 Free PMC article.
References
-
- Abrams, R. A., & Christ, S. E. (2003). Motion onset captures attention. Psychological Science, 14(5), 427–432. 10.1111/1467-9280.01458 - PubMed
-
- Brendel, E., DeLucia, P. R., Hecht, H., Stacy, R. L., & Larsen, J. T. (2012). Threatening pictures induce shortened time-to-contact estimates. Attention Perception & Psychophysics, 74(5), 979–987. - PubMed
-
- Brendel, E., Hecht, H., DeLucia, P. R., & Gamer, M. (2014). Emotional effects on time-to-contact judgments: Arousal, threat, and fear of spiders modulate the effect of pictorial content. Experimental Brain Research, 232(7), 2337–2347. - PubMed
-
- Brenner, E., & Smeets, J. B. (2018). Depth perception. Stevens’ handbook of experimental psychology and cognitive neuroscience: Sensation, perception, and attention (pp. 385–414). Wiley.
MeSH terms
Grants and funding
LinkOut - more resources
Full Text Sources
