

Stochastic Epigenetic Modification and Evolution of Sex Determination in Vertebrates
- PMID: 39565411
- PMCID: PMC11646274
- DOI: 10.1007/s00239-024-10213-9
Stochastic Epigenetic Modification and Evolution of Sex Determination in Vertebrates
Erratum in
-
Correction: Stochastic Epigenetic Modification and Evolution of Sex Determination in Vertebrates.J Mol Evol. 2025 Feb;93(1):182. doi: 10.1007/s00239-024-10229-1. J Mol Evol. 2025. PMID: 39751929 Free PMC article. No abstract available.
Abstract
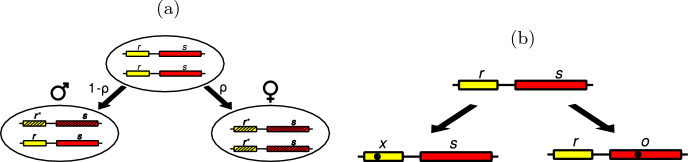
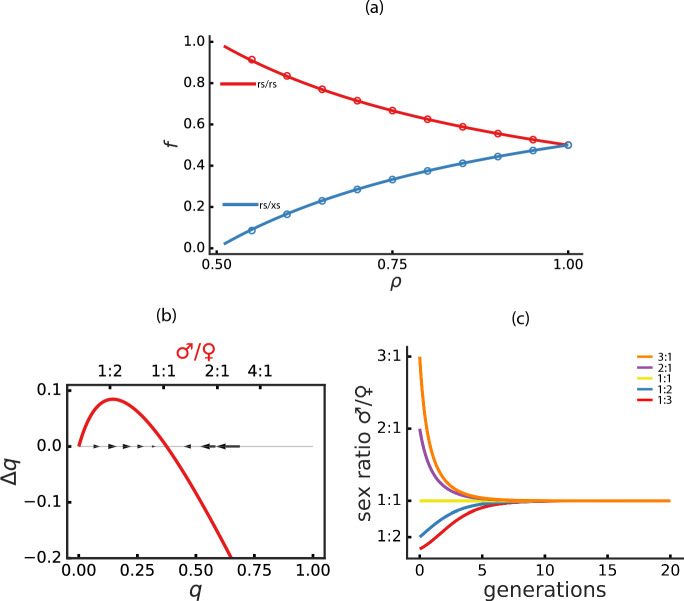
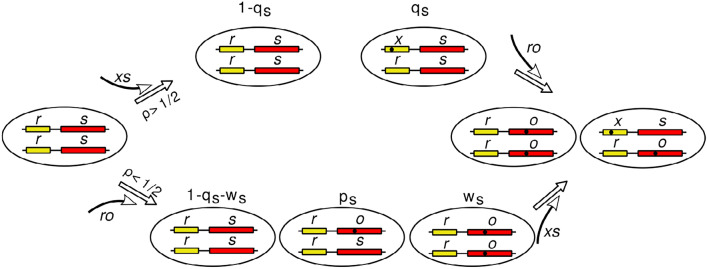
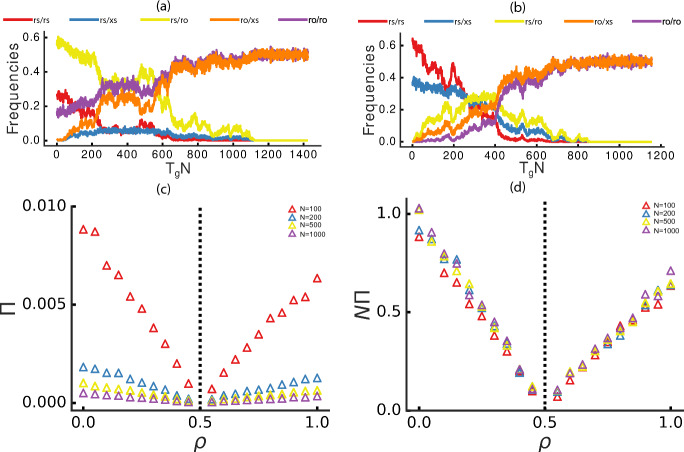
In this report, we propose a novel mathematical model of the origin and evolution of sex determination in vertebrates that is based on the stochastic epigenetic modification (SEM) mechanism. We have previously shown that SEM, with rates consistent with experimental observation, can both increase the rate of gene fixation and decrease pseudogenization, thus dramatically improving the efficacy of evolution. Here, we present a conjectural model of the origin and evolution of sex determination wherein the SEM mechanism alone is sufficient to parsimoniously trigger and guide the evolution of heteromorphic sex chromosomes from the initial homomorphic chromosome configuration, without presupposing any allele frequency differences. Under this theoretical model, the SEM mechanism (i) predated vertebrate sex determination origins and evolution, (ii) has been conveniently and parsimoniously co-opted by the vertebrate sex determination systems during the evolutionary transitioning to the extant vertebrate sex determination, likely acting "on top" of these systems, and (iii) continues existing, alongside all known vertebrate sex determination systems, as a universal pan-vertebrate sex determination modulation mechanism.
Keywords: Evolution of sex determination; Heteromorphic sex chromosomes; Sex determination in vertebrates; Stochastic epigenetic modification.
© 2024. The Author(s).
Figures


Similar articles
-
The Cause-Effect Model of Master Sex Determination Gene Acquisition and the Evolution of Sex Chromosomes.Int J Mol Sci. 2025 Apr 1;26(7):3282. doi: 10.3390/ijms26073282. Int J Mol Sci. 2025. PMID: 40244140 Free PMC article. Review.
-
A 180 Myr-old female-specific genome region in sturgeon reveals the oldest known vertebrate sex determining system with undifferentiated sex chromosomes.Philos Trans R Soc Lond B Biol Sci. 2021 Aug 30;376(1832):20200089. doi: 10.1098/rstb.2020.0089. Epub 2021 Jul 12. Philos Trans R Soc Lond B Biol Sci. 2021. PMID: 34247507 Free PMC article.
-
A brief review of vertebrate sex evolution with a pledge for integrative research: towards 'sexomics'.Philos Trans R Soc Lond B Biol Sci. 2021 Aug 30;376(1832):20200426. doi: 10.1098/rstb.2020.0426. Epub 2021 Jul 12. Philos Trans R Soc Lond B Biol Sci. 2021. PMID: 34247497 Free PMC article. Review.
-
The evolution of sex chromosomes and sex determination in vertebrates and the key role of DMRT1.Sex Dev. 2007;1(1):2-11. doi: 10.1159/000096234. Sex Dev. 2007. PMID: 18391511 Review.
-
Expanding the classical paradigm: what we have learnt from vertebrates about sex chromosome evolution.Philos Trans R Soc Lond B Biol Sci. 2021 Sep 13;376(1833):20200097. doi: 10.1098/rstb.2020.0097. Epub 2021 Jul 26. Philos Trans R Soc Lond B Biol Sci. 2021. PMID: 34304593 Free PMC article. Review.
References
-
- Bachtrog D, Mank JE, Peichel CL, Kirkpatrick M, Otto SP, Ashman TL, Hahn MW, Kitano J, Mayrose I, Ming R, Perrin N, Ross L, Valenzuela N, Vamosi JC, Mank JE, Peichel CL, Ashman TL, Blackmon H, Goldberg EE, Hahn MW, Kirkpatrick M, Kitano J, Mayrose I, Ming R, Pennell MW, Perrin N, Valenzuela N, Vamosi JC (2014) Sex determination: why so many ways of doing it? PLoS Biol 12(7):1–13. 10.1371/journal.pbio.1001899 - PMC - PubMed
-
- Branciamore S, Rodin AS, Gogoshin G, Riggs AD (2015) Epigenetics and evolution: transposons and the stochastic epigenetic modification model. AIMS Genetics 2(2):148–162. 10.3934/genet.2015.2.148
-
- Bull JJ (1983) Evolution of sex determining mechanisms. Benjamin/Cummings Series in the Life Sciences. Benjamin/Cummings Publishing Company, Advanced Book Program, Menio Park, California, USA. https://books.google.com/books?id=wIwVAQAAIAAJ
MeSH terms
LinkOut - more resources
Full Text Sources
