

Cancer-specific utility: clinical validation of the EORTC QLU-C10D in patients with glioblastoma
- PMID: 39565523
- PMCID: PMC12204889
- DOI: 10.1007/s10198-024-01729-4
Cancer-specific utility: clinical validation of the EORTC QLU-C10D in patients with glioblastoma
Abstract
Introduction: Many health economic evaluations rely on the validity of the utility measurement for health-related quality of life (HRQoL). While generic utility measures perform well in HRQoL assessments of many diseases and patient populations, appropriateness for cancer-specific disease burdens needs attention and condition-specific measures could be a viable option. This study assessed the clinical validity of the cancer-specific EORTC QLU-C10D, a utility scoring algorithm for the EORTC QLQ-C30, in patients with glioblastoma. We expect the EORTC QLU-C10D to be sensitive and responsive in glioblastoma patients. Furthermore, we compared its statistical efficiency with the generic utility measure EQ-5D-3L.
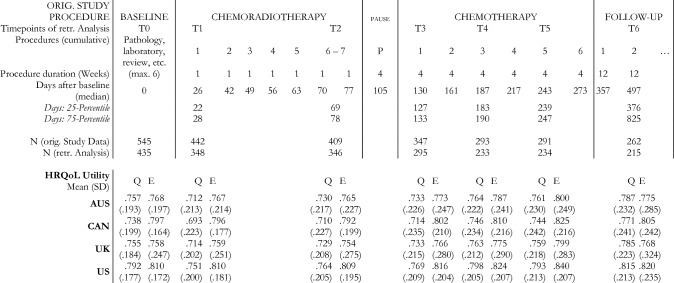
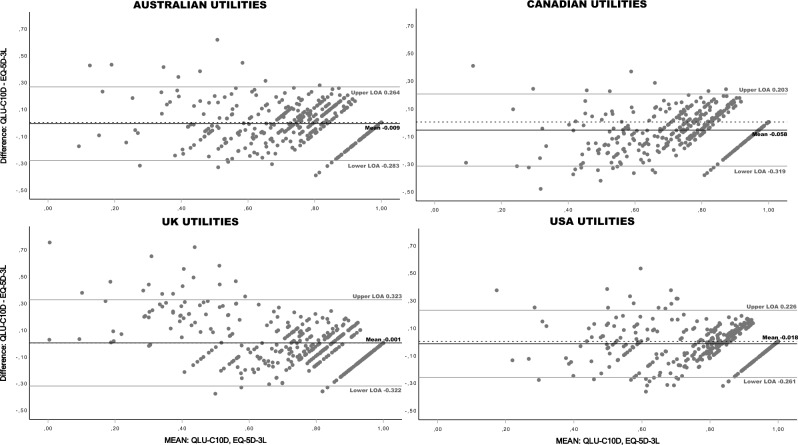
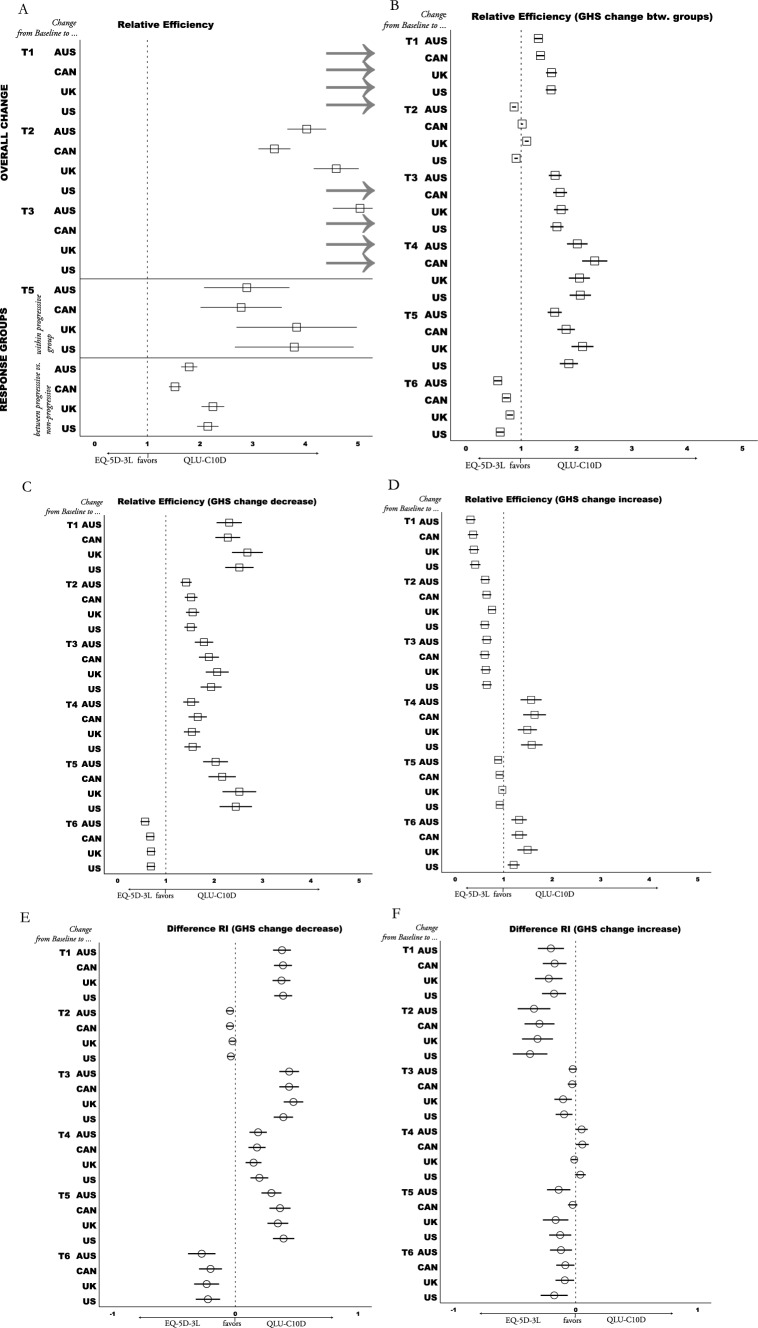
Methods: We used data from a multi-center randomized controlled trial (NCT00689221) with patients from 146 study sites in 25 countries. Both, the QLQ-C30 and the EQ-5D-3L, had been administered at seven assessment points together. Utilities of both measures were calculated for four country value set (Australia, Canada, UK, USA). Ceiling effects, agreement (Bland-Altman plots (BA), intra-class correlation (ICC)), were calculated to analyze construct validity. Sensitivity to known-groups (performance status; global health) and responsiveness to changes (progressive vs. non-progressive; stable vs. improved or deteriorated HRQoL) were investigated for clinical validity. Relative Efficiency (RE) was calculated to compare statistical efficiency of both utility measures.
Results: 435 patients were included at baseline and six subsequent time points (median timeframe 497 days). QLU-C10D country value set showed negligible ceiling effects (< 6.7%) and high agreement with EQ-5D-3L (ICC > 0.750). BA indicated that differences between both utility measures increased with deteriorating health states. While the QLU-C10D was more sensitive to global health groups (RE > 1.2), the EQ-5D-3L was more sensitive to performance status groups (RE < 0.7) than the other utility measure. Statistical efficiency to detect differences between change groups and within HRQoL deterioration group (RE > 1.4) favored QLU-C10D in 18 of 24 (75%) and 20 of 24 (83%) comparisons with the EQ-5D-3L respectively. Responsiveness to overall HRQoL change (RE > 3.4) also favored the QLU-C10D.
Conclusion: Our results indicate that the QLU-C10D is a valid utility measure to assess HRQoL in patients with glioblastoma. This facilitates the investigation of HRQoL profiles and utilities in this patient population by administering a single questionnaire, the EORTC QLQ-C30. Efficiency analyses point to higher statistical power of the QLU-C10D compared to the EQ-5D-3L.
Keywords: EQ-5D-3L; Glioblastoma; Health-related quality of life; QLU-C10D; Utility; Validity.
© 2024. The Author(s).
Conflict of interest statement
Declarations. Conflict of interest: The authors have no conflict of interest to declare. The EORTC Quality of Life Group business model involves charges for commercial companies using EORTC instruments. Academic use of EORTC instruments is free of charge. Ethical approval: All patients provided written informed consent when participating in the original trials which this retrospective analysis relies on. The original study protocols were developed in accordance with the Declaration of Helsinki and ethical approval was sought at participating centres. The data sharing agreement complies with GDPR 2016. Consent for publication: All authors have approved the submission of the manuscript.
Figures

Similar articles
-
Validation of the Cancer-Specific Preference-Based Measure EORTC QLU-C10D against the Generic Instruments EQ-5D-5L and SF-6Dv2 in a Prospectively Collected Sample of Patients with Cancer in Austria and France.Pharmacoeconomics. 2025 Aug;43(8):937-953. doi: 10.1007/s40273-025-01501-3. Epub 2025 Apr 27. Pharmacoeconomics. 2025. PMID: 40287928 Free PMC article.
-
Aphasia-specific or generic outcomes? a comparison of two health-related quality of life instruments for economic evaluations of aphasia treatments.Qual Life Res. 2025 Jul 26. doi: 10.1007/s11136-025-04040-8. Online ahead of print. Qual Life Res. 2025. PMID: 40715897
-
Validation of the cancer-specific utility measure EORTC QLU-C10D using evidence from four lung cancer trials covering six country value sets.Sci Rep. 2025 Apr 28;15(1):14907. doi: 10.1038/s41598-024-83861-y. Sci Rep. 2025. PMID: 40295533 Free PMC article.
-
Evaluation of the ventricular assist device programme in the UK.Health Technol Assess. 2006 Nov;10(48):1-119, iii-iv. doi: 10.3310/hta10480. Health Technol Assess. 2006. PMID: 17134596
-
The Psychometric Performance of Generic Preference-Based Measures in Informal Carers: A Systematic Review of Validation Studies.Pharmacoeconomics. 2025 Sep;43(9):1065-1082. doi: 10.1007/s40273-025-01509-9. Epub 2025 Jun 28. Pharmacoeconomics. 2025. PMID: 40580406
Cited by
-
Validation of the Cancer-Specific Preference-Based Measure EORTC QLU-C10D against the Generic Instruments EQ-5D-5L and SF-6Dv2 in a Prospectively Collected Sample of Patients with Cancer in Austria and France.Pharmacoeconomics. 2025 Aug;43(8):937-953. doi: 10.1007/s40273-025-01501-3. Epub 2025 Apr 27. Pharmacoeconomics. 2025. PMID: 40287928 Free PMC article.
References
-
- Allemani, C., Matsuda, T., Di Carlo, V., Harewood, R., Matz, M., Nikšić, M., Hood, M.: Global surveillance of trends in cancer survival 2000–14 (CONCORD-3): analysis of individual records for 37 513 025 patients diagnosed with one of 18 cancers from 322 population-based registries in 71 countries. The Lancet 391(10125), 1023–1075 (2018) - PMC - PubMed
-
- Walbert, T., & Chasteen, K. (2015). Palliative and supportive care for glioma patients. Curr Understanding Treatment Gliomas 163 171–184 - PubMed
Publication types
MeSH terms
Grants and funding
LinkOut - more resources
Full Text Sources
Medical
