

Outdoor Artificial Light at Night and Insomnia-Related Social Media Posts
- PMID: 39565624
- PMCID: PMC11579793
- DOI: 10.1001/jamanetworkopen.2024.46156
Outdoor Artificial Light at Night and Insomnia-Related Social Media Posts
Abstract
Importance: Understanding the outcomes of artificial light at night (ALAN) on insomnia is crucial for public health, particularly in rapidly urbanizing regions. However, evidence of the association between ALAN exposure and insomnia is limited, despite the large number of people exposed to ALAN.
Objective: To explore the association between outdoor ALAN exposure and insomnia among the Chinese population.
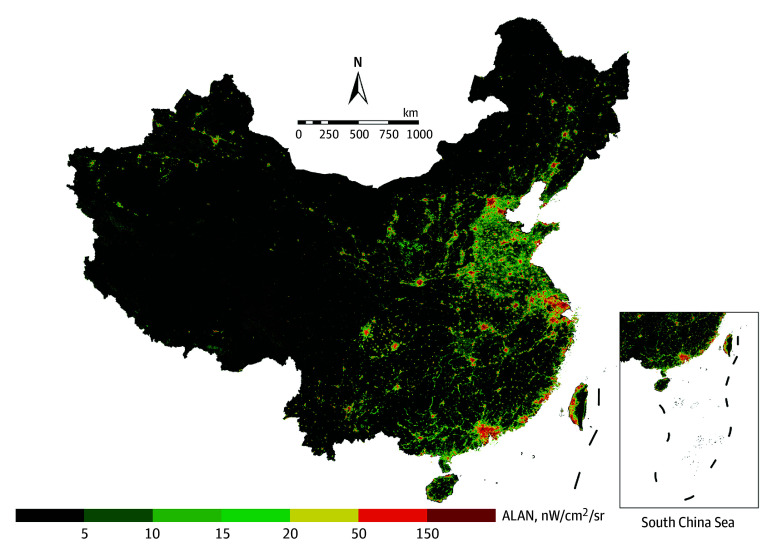
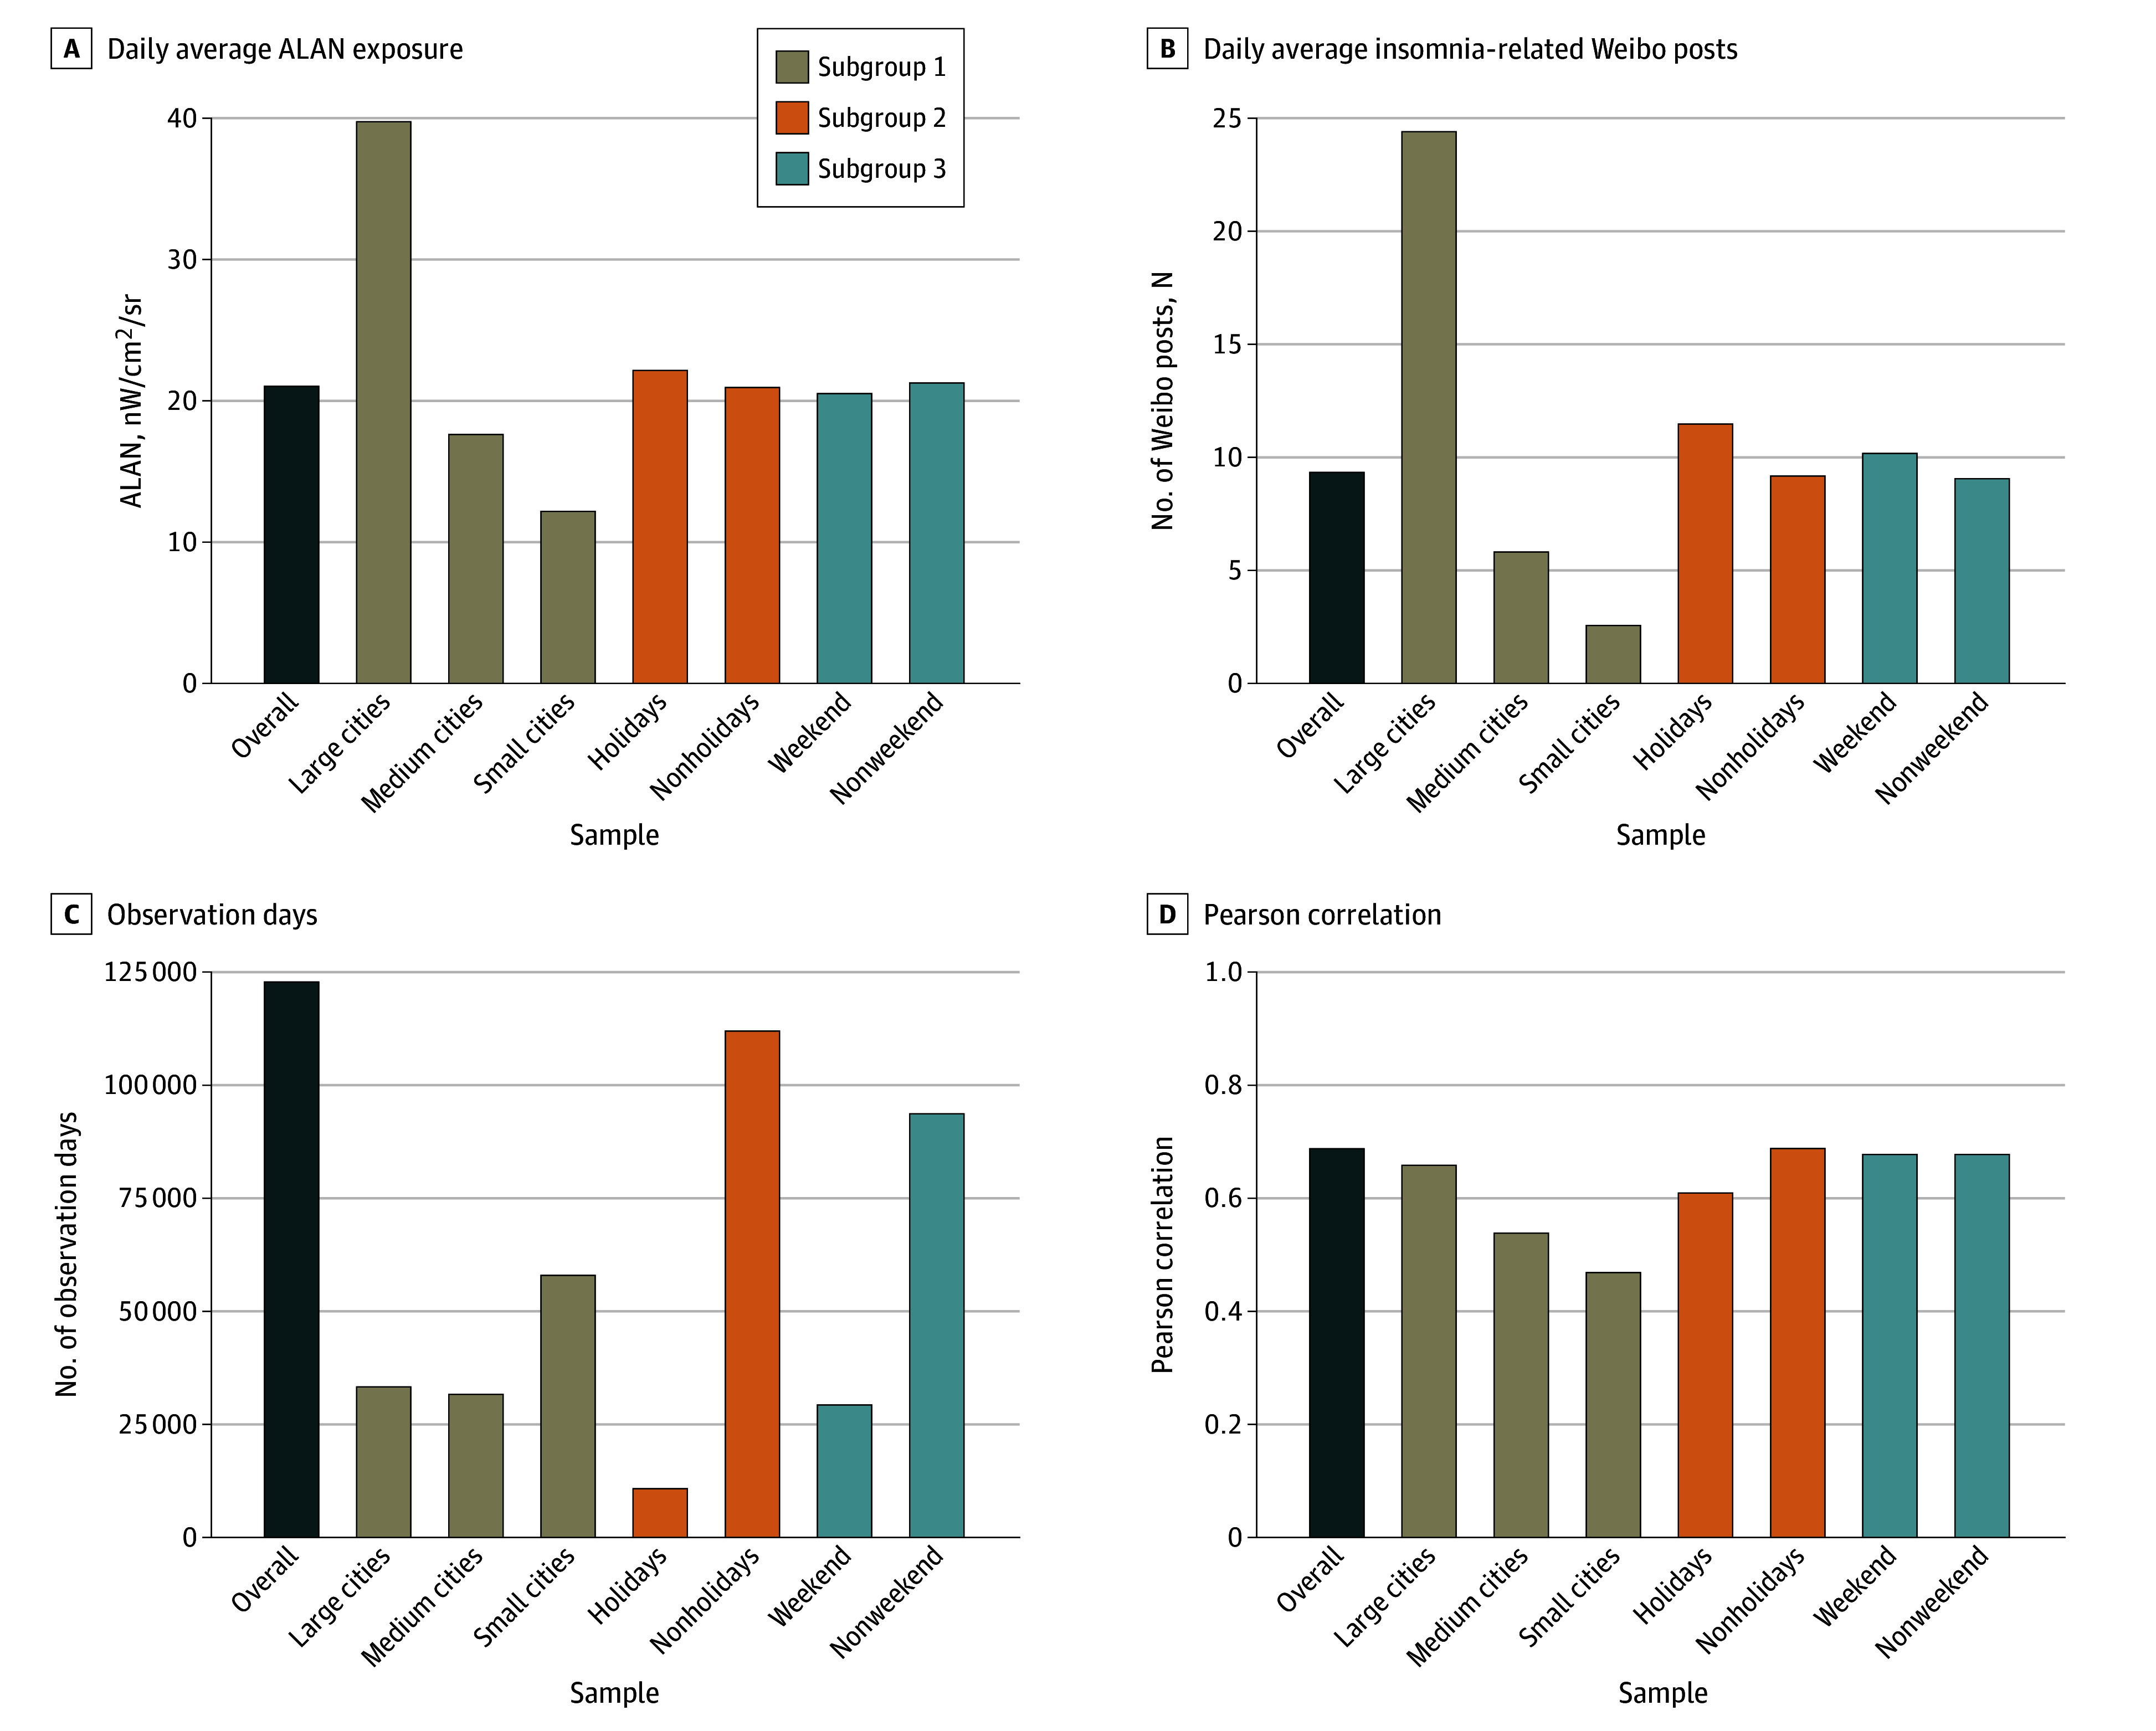
Design, setting, and participants: This cross-sectional study used social media data from Weibo (Sina), a social media platform, and satellite-derived nighttime light images. The study period spans from May 2022 to April 2023. The study encompasses 336 cities across China's mainland, providing a comprehensive national perspective. Data include insomnia-related posts from the platform users, representing a large and diverse population sample exposed to varying levels of ALAN.
Exposure: Outdoor ALAN exposure (in nanowatts per centimeters squared per steradian [nW/cm2/sr]) was measured using satellite-derived nighttime light images at a spatial resolution of 500 m.
Main outcomes and measures: The incidence of insomnia among residents at the city level was measured by the number of insomnia-related posts on social media. Multiple linear regression models were used to estimate the association between ALAN exposure and population insomnia, adjusting for population characteristics and meteorological factors at the city level.
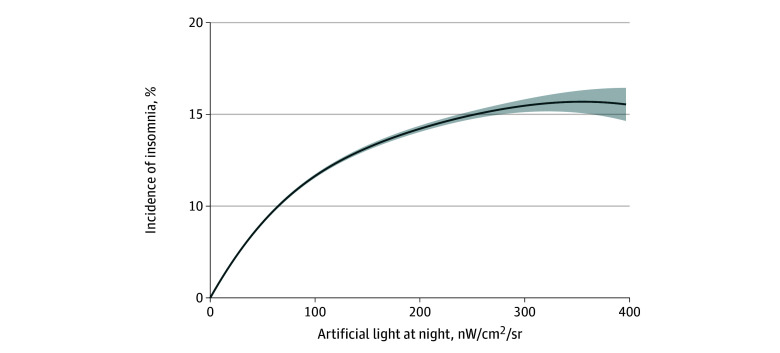
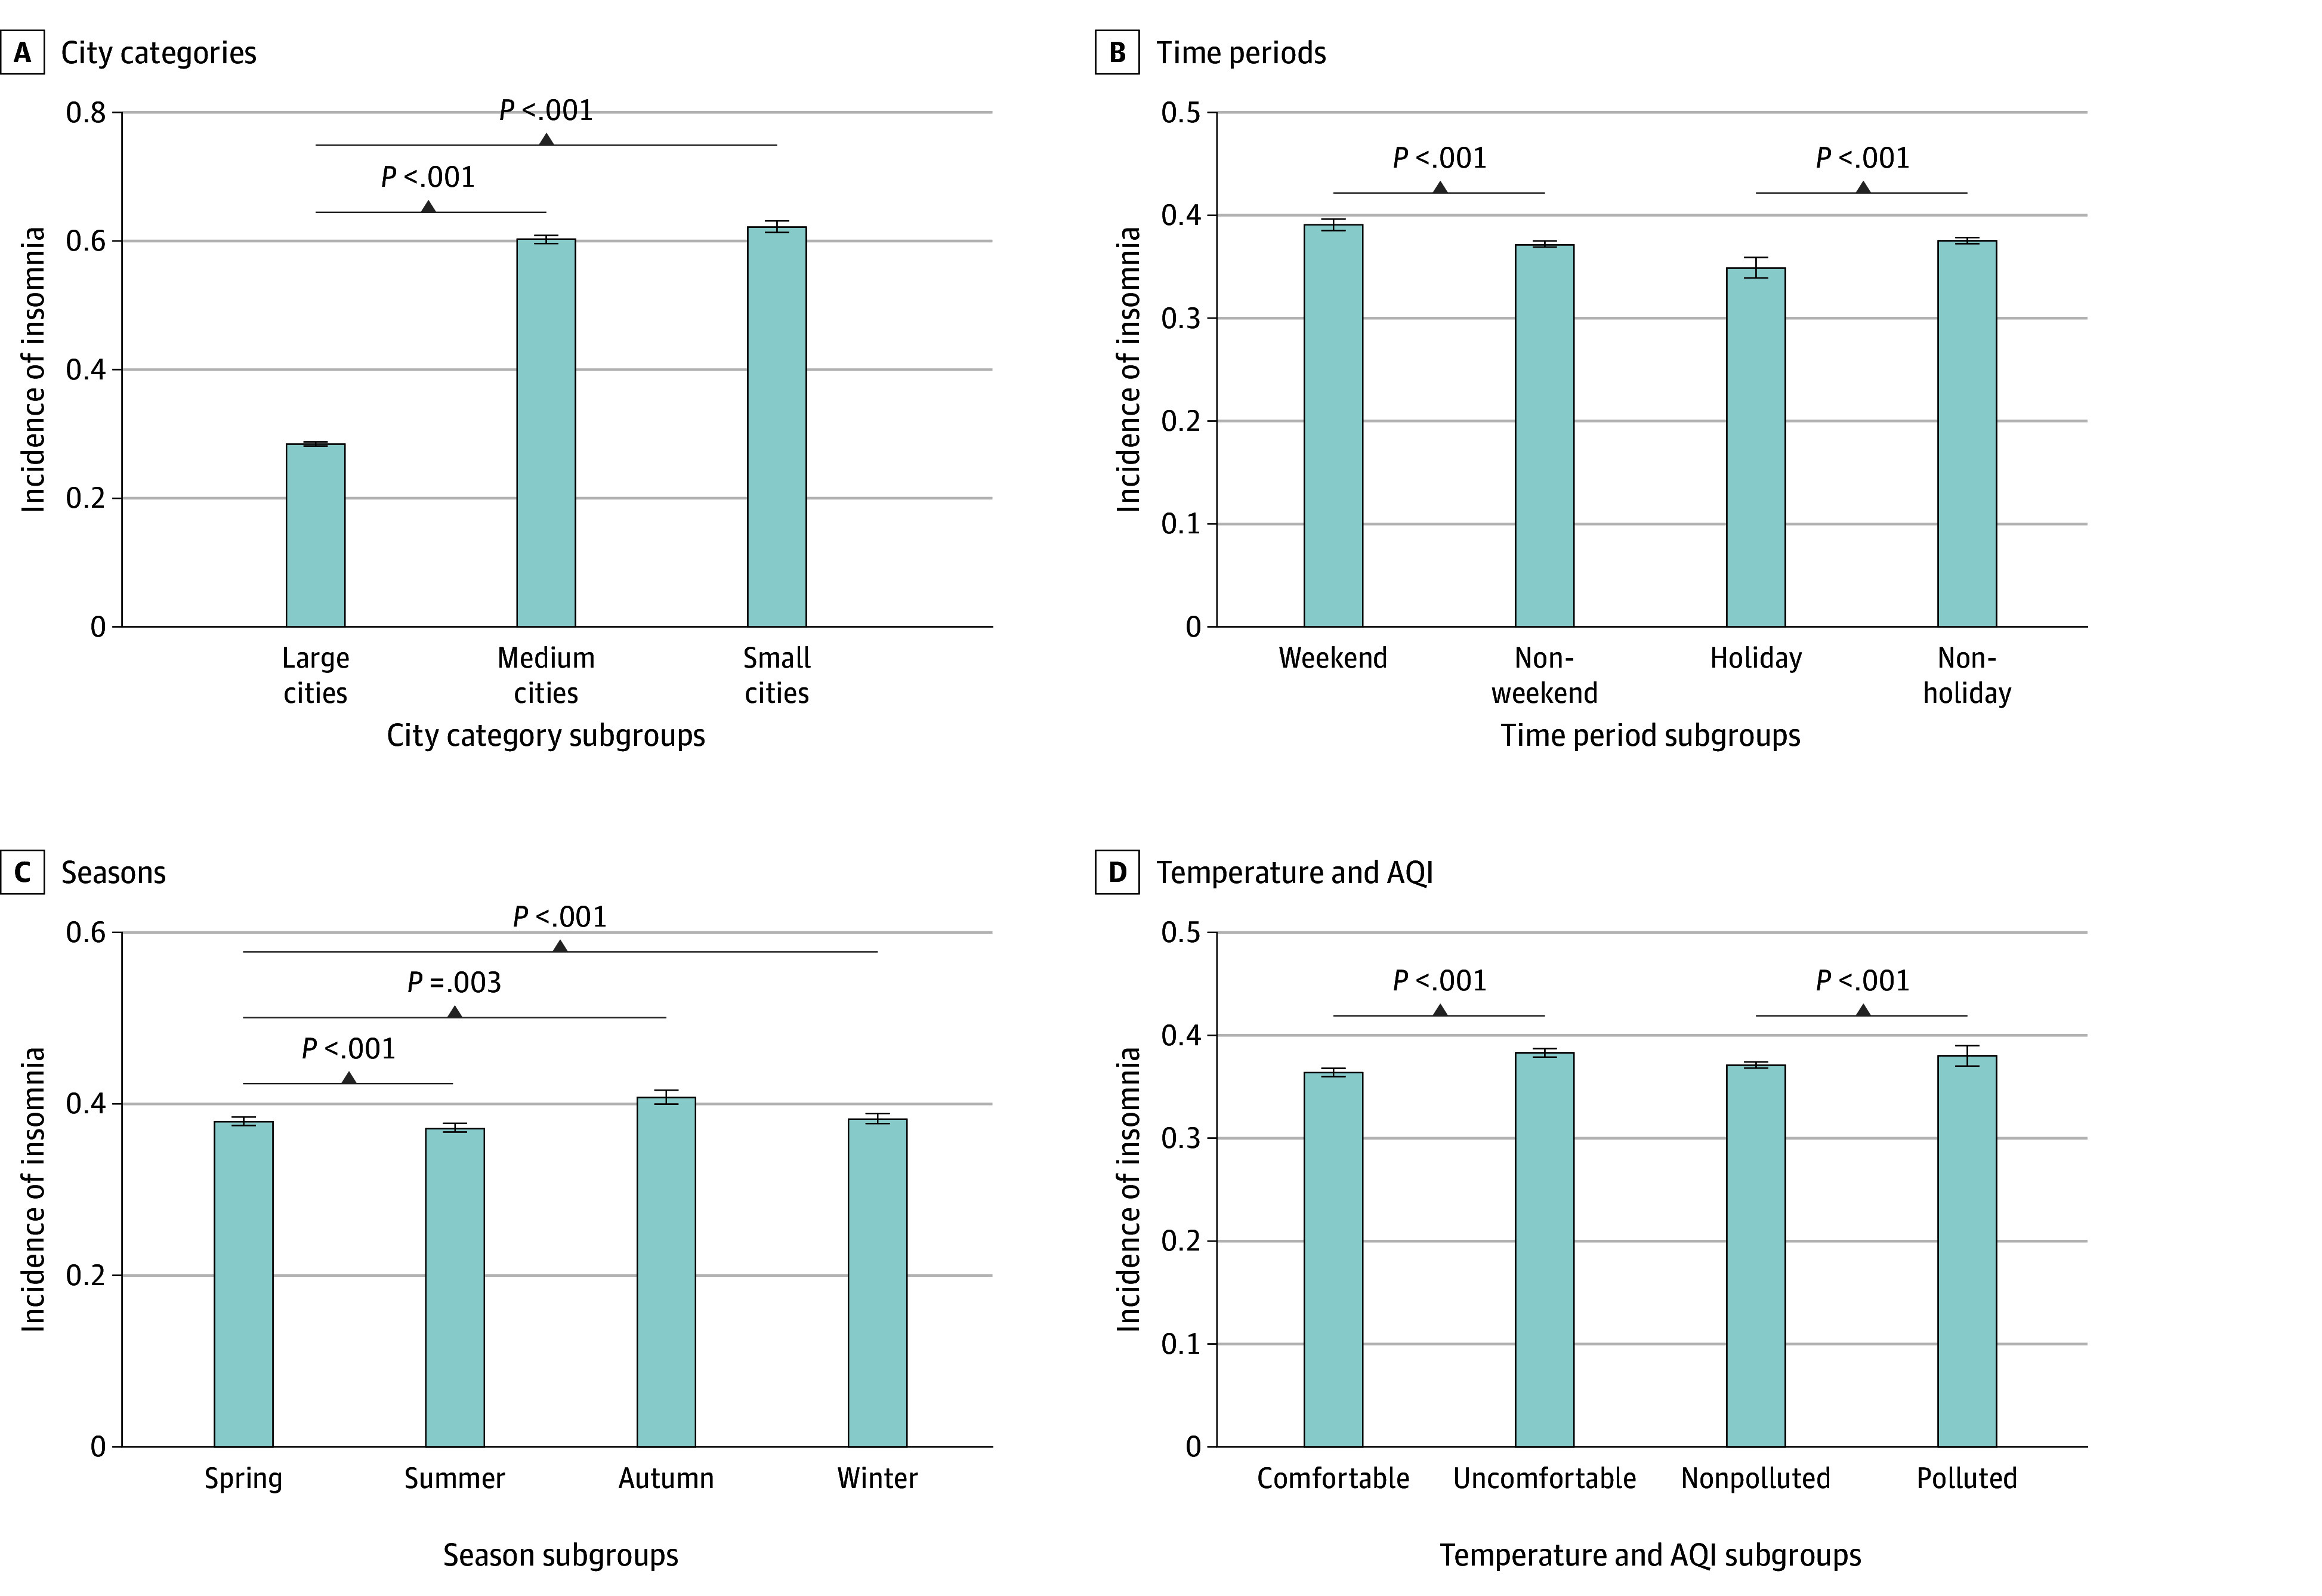
Results: The study included data from 1 147 583 insomnia-related posts. Daily mean ALAN exposure across the 336 cities ranged from 3.1 to 221.0 nW/cm2/sr. For each 5 nW/cm2/sr increase in ALAN exposure, the incidence of insomnia increased by 0.377% (95% CI, 0.372%-0.382%). The association was greater in less populated cities and under extreme temperature and poor air quality conditions. The observed exposure-response functions between ALAN exposure and insomnia demonstrated an upward trend, with steeper slopes observed at low exposures and leveling off at higher exposures.
Conclusions and relevance: This study provides evidence of the association between increased ALAN exposure and higher incidence of insomnia. These findings expand the current knowledge on adverse health outcomes of ALAN exposure and emphasize the potential health benefits of well-planned artificial nighttime lighting in China and other developing countries in the early stages of city planning.
Conflict of interest statement
Figures
Similar articles
-
Indoor and outdoor artificial light-at-night (ALAN) and cancer risk: A systematic review and meta-analysis of multiple cancer sites and with a critical appraisal of exposure assessment.Sci Total Environ. 2024 Dec 10;955:177059. doi: 10.1016/j.scitotenv.2024.177059. Epub 2024 Oct 20. Sci Total Environ. 2024. PMID: 39437923
-
Association between outdoor artificial light at night, circadian health, and LDL-C in intracranial artery atherosclerotic stenosis.Clin Epigenetics. 2025 Jul 28;17(1):132. doi: 10.1186/s13148-025-01938-5. Clin Epigenetics. 2025. PMID: 40722184 Free PMC article.
-
Melatonin for the promotion of sleep in adults in the intensive care unit.Cochrane Database Syst Rev. 2018 May 10;5(5):CD012455. doi: 10.1002/14651858.CD012455.pub2. Cochrane Database Syst Rev. 2018. PMID: 29746721 Free PMC article.
-
Individual-level interventions to reduce personal exposure to outdoor air pollution and their effects on people with long-term respiratory conditions.Cochrane Database Syst Rev. 2021 Aug 9;8(8):CD013441. doi: 10.1002/14651858.CD013441.pub2. Cochrane Database Syst Rev. 2021. PMID: 34368949 Free PMC article.
-
Pharmacotherapies for sleep disturbances in dementia.Cochrane Database Syst Rev. 2016 Nov 16;11(11):CD009178. doi: 10.1002/14651858.CD009178.pub3. Cochrane Database Syst Rev. 2016. Update in: Cochrane Database Syst Rev. 2020 Nov 15;11:CD009178. doi: 10.1002/14651858.CD009178.pub4. PMID: 27851868 Free PMC article. Updated.
References
-
- Gallaway T, Olsen RN, Mitchell DM. The economics of global light pollution. Ecol Econ. 2010;69(3):658-665. doi:10.1016/j.ecolecon.2009.10.003 - DOI
Publication types
MeSH terms
LinkOut - more resources
Full Text Sources
Medical
Research Materials
Miscellaneous
