Macro-scale patterns in functional connectivity associated with ongoing thought patterns and dispositional traits
- PMID: 39565648
- PMCID: PMC11578585
- DOI: 10.7554/eLife.93689
Macro-scale patterns in functional connectivity associated with ongoing thought patterns and dispositional traits
Abstract
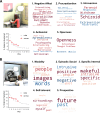
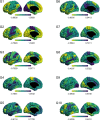
Complex macro-scale patterns of brain activity that emerge during periods of wakeful rest provide insight into the organisation of neural function, how these differentiate individuals based on their traits, and the neural basis of different types of self-generated thoughts. Although brain activity during wakeful rest is valuable for understanding important features of human cognition, its unconstrained nature makes it difficult to disentangle neural features related to personality traits from those related to the thoughts occurring at rest. Our study builds on recent perspectives from work on ongoing conscious thought that highlight the interactions between three brain networks - ventral and dorsal attention networks, as well as the default mode network. We combined measures of personality with state-of-the-art indices of ongoing thoughts at rest and brain imaging analysis and explored whether this 'tri-partite' view can provide a framework within which to understand the contribution of states and traits to observed patterns of neural activity at rest. To capture macro-scale relationships between different brain systems, we calculated cortical gradients to describe brain organisation in a low-dimensional space. Our analysis established that for more introverted individuals, regions of the ventral attention network were functionally more aligned to regions of the somatomotor system and the default mode network. At the same time, a pattern of detailed self-generated thought was associated with a decoupling of regions of dorsal attention from regions in the default mode network. Our study, therefore, establishes that interactions between attention systems and the default mode network are important influences on ongoing thought at rest and highlights the value of integrating contemporary perspectives on conscious experience when understanding patterns of brain activity at rest.
Keywords: human; macro-scale connectivity; neuroscience; personality traits; spontaneous thought; tri-partite network.
© 2024, Hardikar et al.
Conflict of interest statement
SH, BM, HS, RW, TX, ML, SV, DM, AT, BB, RV, AV, JS No competing interests declared
Figures


Update of
- doi: 10.1101/2022.10.11.511591
- doi: 10.7554/eLife.93689.1
- doi: 10.7554/eLife.93689.2
Similar articles
-
The relationship between individual variation in macroscale functional gradients and distinct aspects of ongoing thought.Neuroimage. 2020 Oct 15;220:117072. doi: 10.1016/j.neuroimage.2020.117072. Epub 2020 Jun 22. Neuroimage. 2020. PMID: 32585346 Free PMC article.
-
Patterns of thought: Population variation in the associations between large-scale network organisation and self-reported experiences at rest.Neuroimage. 2018 Aug 1;176:518-527. doi: 10.1016/j.neuroimage.2018.04.064. Epub 2018 May 4. Neuroimage. 2018. PMID: 29733956
-
Neuroticism and openness exhibit an anti-correlation pattern to dissociable default mode network: using resting connectivity and structural equation modeling analysis.Brain Imaging Behav. 2024 Aug;18(4):753-763. doi: 10.1007/s11682-024-00869-8. Epub 2024 Feb 27. Brain Imaging Behav. 2024. PMID: 38409462
-
Cooperation between the default mode network and the frontal-parietal network in the production of an internal train of thought.Brain Res. 2012 Jan 5;1428:60-70. doi: 10.1016/j.brainres.2011.03.072. Epub 2011 Apr 3. Brain Res. 2012. PMID: 21466793 Review.
-
Mapping cognitive and emotional networks in neurosurgical patients using resting-state functional magnetic resonance imaging.Neurosurg Focus. 2020 Feb 1;48(2):E9. doi: 10.3171/2019.11.FOCUS19773. Neurosurg Focus. 2020. PMID: 32006946 Free PMC article. Review.
Cited by
-
Thought contents during rest account for functional connectivity-behavior associations.Imaging Neurosci (Camb). 2025 Jun 20;3:IMAG.a.55. doi: 10.1162/IMAG.a.55. eCollection 2025. Imaging Neurosci (Camb). 2025. PMID: 40800825 Free PMC article.
-
The Relative Accuracy of Different Methods for Measuring Mind Wandering Subtypes: A Systematic Review.Brain Behav. 2025 Aug;15(8):e70764. doi: 10.1002/brb3.70764. Brain Behav. 2025. PMID: 40847464 Free PMC article. Review.
-
Reshaped functional connectivity gradients in acute ischemic stroke.Neuroimage Clin. 2025;45:103755. doi: 10.1016/j.nicl.2025.103755. Epub 2025 Feb 23. Neuroimage Clin. 2025. PMID: 40043442 Free PMC article.
References
-
- Achenbach TM, Rescorla LA. No TitleManual for the ASEBA Adult Forms & Profiles. Research Center for Children, Youth, & Families. University of Vermont; 2003.
-
- Beck A, Steer R, Brown G. Beck Depression Inventory-II. Beck Depress Invent; 1993.
MeSH terms
LinkOut - more resources
Full Text Sources
Medical

