. 2025 Jan 1;36(1):ar2.
doi: 10.1091/mbc.E24-04-0164. Epub 2024 Nov 20.

The CDK8 kinase module: A novel player in the transcription of translation initiation and ribosomal genes

Affiliations

The CDK8 kinase module: A novel player in the transcription of translation initiation and ribosomal genes

Brittany Friedson et al. Mol Biol Cell. .

Abstract

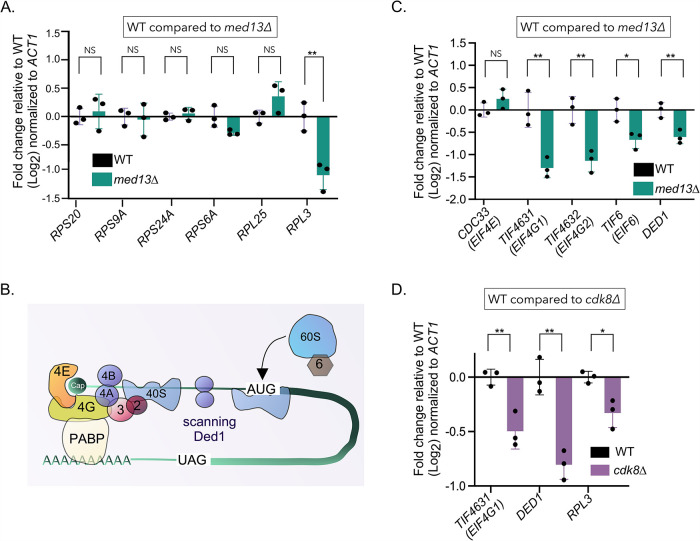
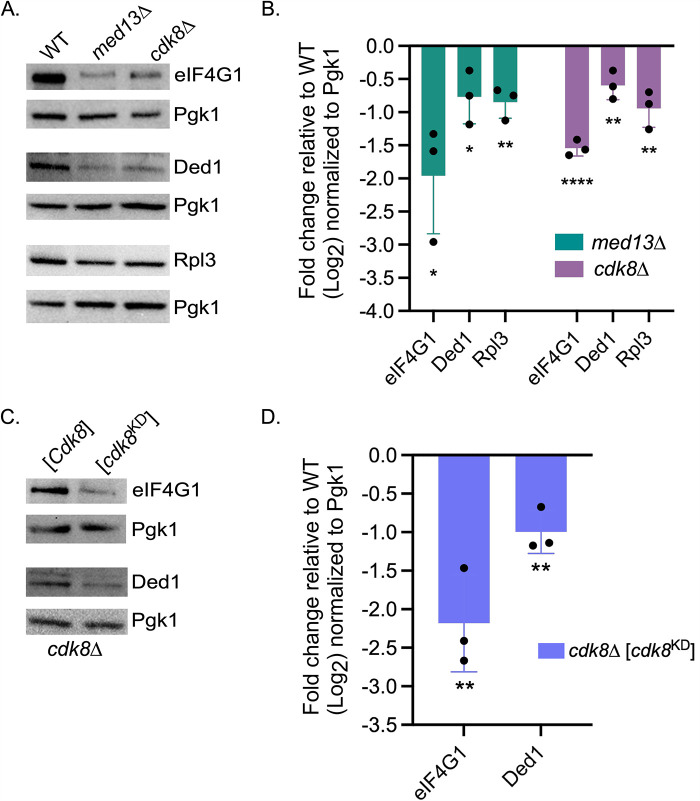
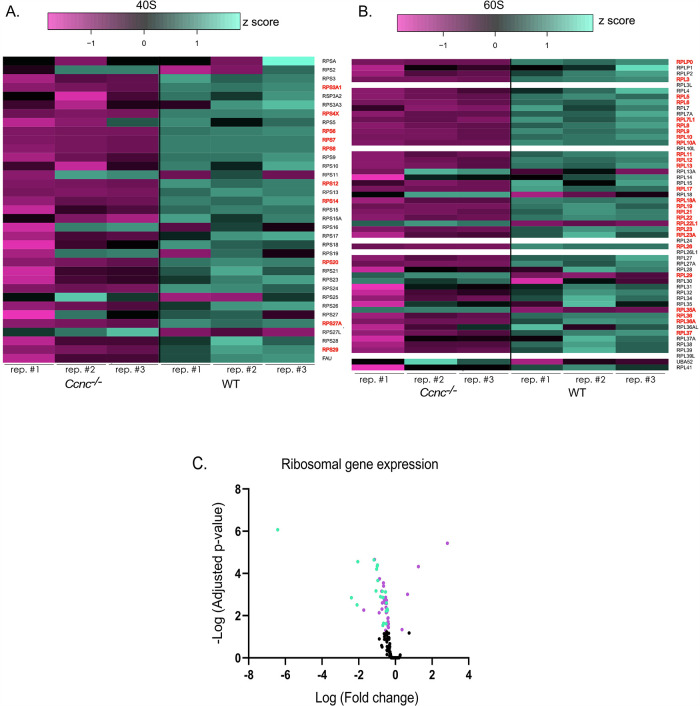
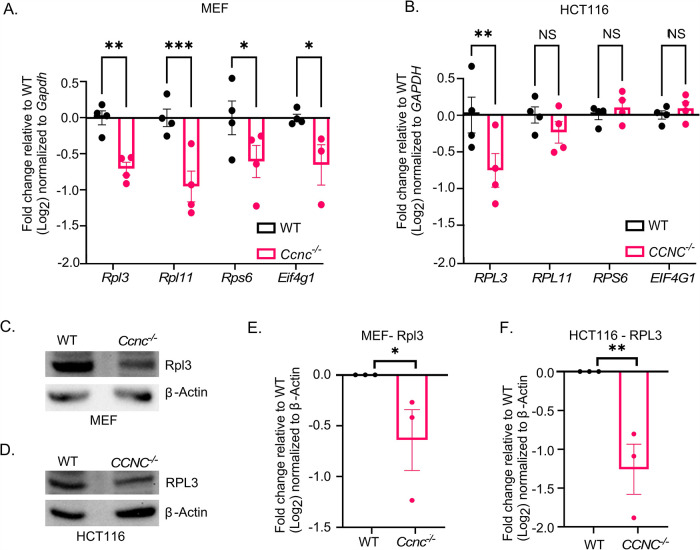
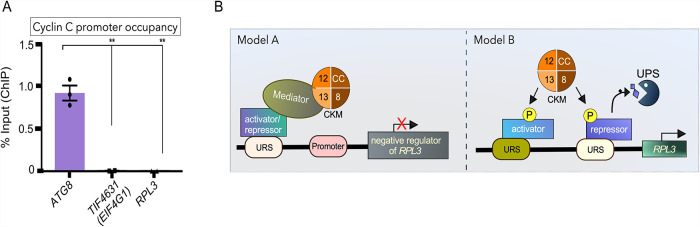
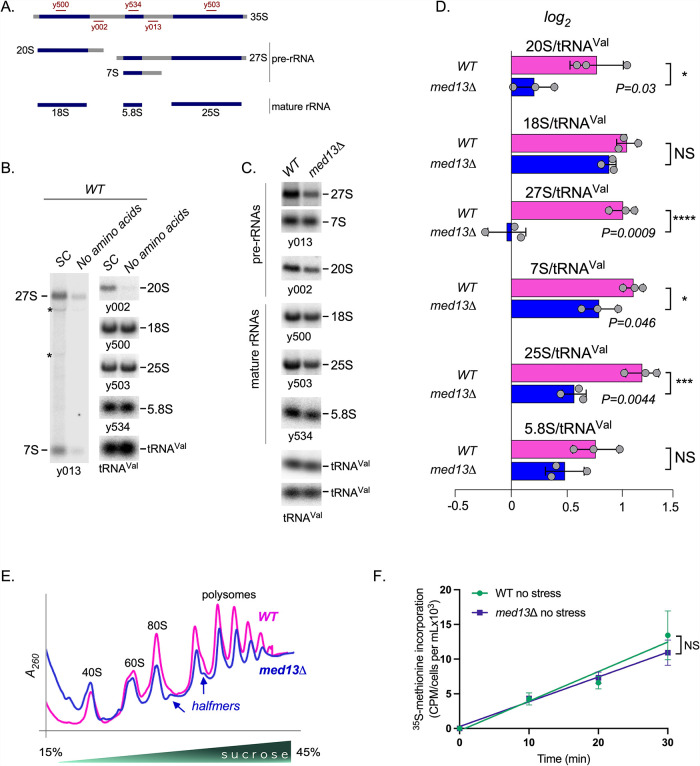
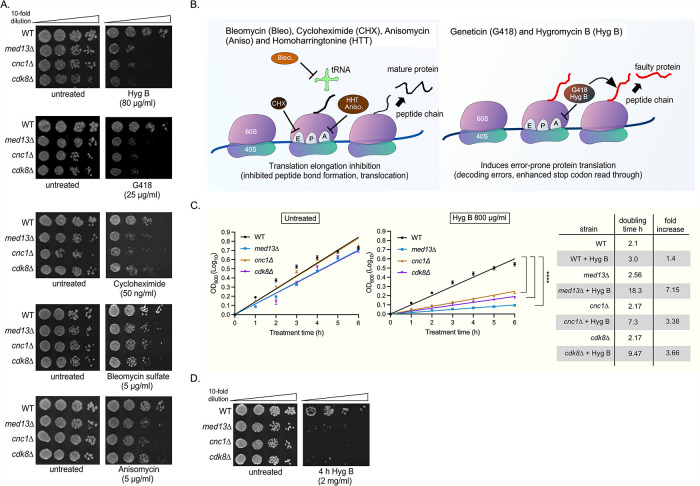
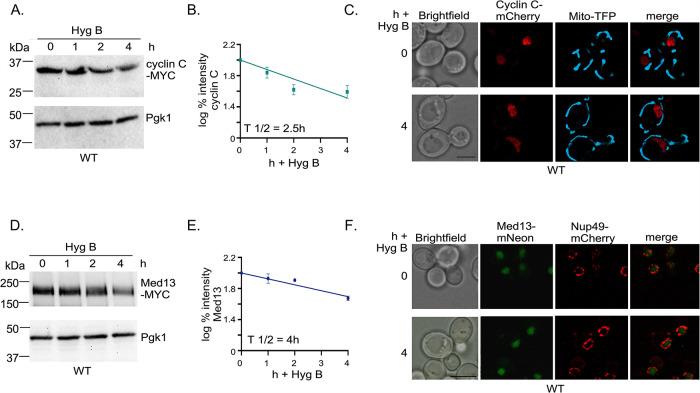
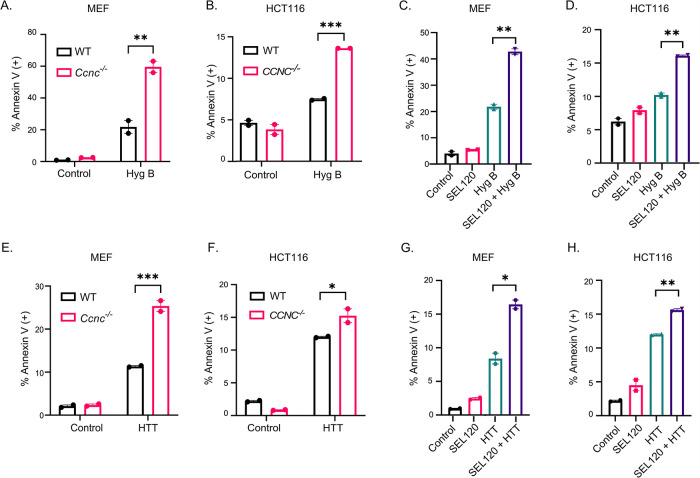
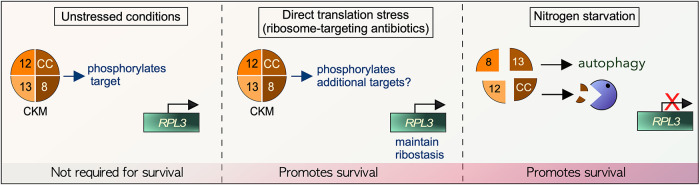
Survival following stress is dependent upon reprogramming transcription and translation. Communication between these programs following stress is critical for adaptation but is not clearly understood. The Cdk8 kinase module (CKM) of the Mediator complex modulates the transcriptional response to various stresses. Its involvement in regulating translational machinery has yet to be elucidated, highlighting an existing gap in knowledge. Here, we report that the CKM positively regulates a subset of ribosomal protein (RP) and translation initiation factor (TIF)-encoding genes under physiological conditions in Saccharomyces cerevisiae. In mouse embryonic fibroblasts and HCT116 cells, the CKM regulates unique sets of RP and TIF genes, demonstrating some conservation of function across species. In yeast, this is mediated by Cdk8 phosphorylation of one or more transcription factors which control RP and TIF expression. Conversely, the CKM is disassembled following nutrition stress, permitting repression of RP and TIF genes. The CKM also plays a transcriptional role important for promoting cell survival, particularly during translational machinery stress triggered by ribosome-targeting antibiotics. Furthermore, in mammalian cells, the activity of CDK8 and its paralogue, CDK19, promotes cell survival following ribosome inhibition. These results provide mechanistic insights into the CKM's role in regulating expression of a subset of genes associated with translation.


Figures

FIGURE 1:
FIGURE 1:
The CKM positively regulates the expression of several translation-associated genes in S. cerevisiae. (A) qRT-PCR analysis of the 40S (RSP20, RSP9A, RSP24A, and RSP6A) and 60S (RPL25 and RPL3) ribosomal protein-encoding genes in WT (RSY10) and med13∆ (RSY2444) cells in unstressed conditions. ∆∆Ct results for relative fold change (log2) values using WT unstressed cells as a control. Transcript levels are given relative to the internal ACT1 mRNA control. (B) Schematic of the TIFs members, Ded1, and ribosomal subunits. 4E: eIF4E, 4G: eIF4G1, 2: eIF2, 3: eIF3, 4A: eIF4A, 4B: eIF4B, 6: eIG6. (C) As in A, except that TIFs and DED1 were examined. (D) As in A and C, except that cdk8∆ (RSY2176) was analyzed. For all qRT-PCR assays, the error bars indicate the SD from the mean of two technical replicates from three independent cultures (N = 3). For all assays: *p  ≤ 0.05, **p ≤ 0.01; NS: Not Significant.
FIGURE 2:
FIGURE 2:
Protein levels of eIF4G1, Ded1, and Rpl3 in CKM mutants are decreased compared with WT in S. cerevisiae. (A) Western blot analysis of endogenous eIF4G1, Ded1, and Rpl3 in WT (RSY10), med13∆ (RSY2444), and cdk8∆ (RSY2176) cells. Pgk1 was used as a normalization control protein. Protein extracts were made from cells growing in physiological conditions until midlog phase. (B) Quantification of protein levels obtained in A. The bars indicate fold change (log2) protein expression relative to WT. Error bars indicate SD, N = 3 of biologically independent experiments. (C) As in A, except that endogenous eIF4G1 and Ded1 were analyzed in extracts made from cdk8∆ (RSY2176) cells expressing WT Cdk8 or Cdk8 kinase-dead mutant (D290A) from a plasmid, pUM511 or pUM516, respectively. (D) Quantification of protein levels detected in C using the same strategy as described in B. *p ≤ 0.05, **p ≤ 0.01, ****p ≤ 0.001.
FIGURE 3:
FIGURE 3:
Expression of numerous RP-encoding genes is decreased in Ccnc/ cell lines. Heatmap depicting the mean fold-change of genes encoding ribosomal proteins from both small 40S and large 60S ribosomal subunits (A and B, respectively). The heatmaps were generated by Heatmap2 using the normalized gene count data obtained from RNA-seq analyses of the three biological replicates (and technical duplicates) of the WT and Ccnc/ MEF cell lines (Stieg et al., 2019). Gene lists were obtained from the HUGO database. Genes that were significantly altered from the differential gene expression analysis are highlighted in red. False discovery rate (FDR) <0.05. (D) Volcano plot of heatmap results depicted in A and B The log fold change of ribosomal gene expression in Ccnc/ cell lines was plotted against the negative log of the adjusted p value for all the ribosomal genes. The genes which were not differentially expressed (p>0.05) are shown in black. Large subunit genes which are differentially expressed are labeled in purple, and small subunit genes are labeled in teal.
FIGURE 4:
FIGURE 4:
Expression of several translation-associated genes decreased in CCNC/- MEFs and HCT116 cell lines. (A) qRT-PCR analysis of Rpl3, Rpl11, Rps6, and Eif4g1 mRNA expression in WT and Ccnc/ MEF cells in unstressed conditions. ∆∆Ct for relative fold change (log2) compared with WT unstressed cells are shown. Transcript levels are given relative to the internal mRNA control. (B) As in A, except that HCT116 cells were analyzed. For all qRT-PCR assays, the error bars indicate the SD from the mean of two technical replicates from three independent cultures (N = 3). (C and D) Western blot analysis of RPL3 in WT and Ccnc/ MEF and CCNC/ HCT116 cells, respectively. For all blots, β-Actin levels were used as loading controls. (E–F) Quantification of protein levels obtained in C and D, respectively. Bars indicate fold change (log2) protein expression relative to WT control. Error bars indicate SD, N = 3 of biologically independent experiments. For all assays: *p ≤ 0.05, **p ≤ 0.01, ***p ≤ 0.005; NS: Not Significant.
FIGURE 5:
FIGURE 5:
The CKM does not directly control RP and TIF gene expression. (A) ChIP analysis was performed in yeast for endogenous cyclin C-TAP fusion (RSY1775) promoter occupancy of ATG8, TIF4631, and RPL3 genes. Three biological replicates were tested. **p ≤ 0.01. (B) Schematic outlying a model in which the CKM indirectly upregulates expression of a subset of TIF and RP-encoding genes, including RPL3, in physiological conditions. See text for details. 8: Cdk8; CC: cyclin C; 12: Med12; 13: Med13. URS: Upstream regulatory sequence.
FIGURE 6:
FIGURE 6:
Med13 is not required for translation under normal physiological conditions. (A) Simplified schematic representation of the main steps of the pre-rRNA processing pathway in yeast. The primary transcript (35S pre-rRNA) shown at the top is normally short-lived and rapidly cleaved. This leads to the formation of relatively stable 20S, 27S, and 7S pre-rRNAs, followed by further maturation and formation of mature 18S, 25S, and 5.8S rRNAs. Regions of pre-rRNA that correspond to mature rRNA sequences are shown in dark blue; the external and internal transcribed pre-rRNA spacers that undergo degradation during processing are shown in gray; the annealing sites for oligonucleotide probes used in this study for hybridizations are shown in red. Although probes against mature rRNAs also anneal to the pre-rRNAs, the amounts of the precursors are significantly lower than the levels of mature rRNAs and require longer exposure for detection, causing oversaturation of a signal derived from the abundant mature rRNAs. Therefore, we used y002 to analyze 20S pre-rRNA and y013 to analyze 27S and 7S pre-rRNA. (B) WT cells were grown to midlog phase in YPD at 30°C, washed, and shifted for 3 h to synthetic complete (SC) or synthetic medium depleted of amino acids. Total RNA extracted from cells was analyzed by northern hybridizations with indicated probes. Asterisk (*) indicates not-specific hybridization of the y013 probe with abundant 25S and 18S rRNAs. (C) RNA was extracted from WT and med13∆ cells grown to midlog phase in YPD at 30°C and resolved in duplicate. One blot was hybridized first with y002 (detects 20S pre-rRNA), then with y534 (detects mature 5.8S rRNA), then with the probe against tRNAVal. The second blot was first hybridized with y013 probe (detects 27S and 7S rRNA), then with y500 and y503 (detect 18S and 25S rRNA, respectively), then with the tRNAVal probe. Stripping of an old probe was done between the hybridizations. Data for both tRNAVal hybridizations are shown. Three biological replicas were used; representative hybridizations are shown. (D) Quantification of northern hybridization data from C are shown as log2 ratios of rRNA- or pre-rRNA-derived radioactive signals normalized to the corresponding tRNAVal signal detected in the same sample. Quantified data are plotted as bar graphs with log average ± SD for three biological replicas. p values were calculated by two-tailed, two-sample unequal variance t tests and are shown in the figure; NS: Not Significant. (E). Sucrose gradient centrifugation analysis of ribosomes extracted from WT and med13∆ cells grown in YPD to midlog phase. Cell lysates were centrifuged through a 15–45% (wt/wt) sucrose gradient and fractionated with the continuous measurement of absorbance at 254 nm (A260) to visualize ribosomal peaks. Free 40S, 60S, 80S monosomes, polysomal peaks, and halfmers are shown for each trace. (F). [35S]-radiolabeled methionine incorporation in WT and med13Δ cells grown under physiological conditions. Error bars indicate SD, N = 3 of biologically independent experiments; NS: Not Significant.
FIGURE 7:
FIGURE 7:
CKM mutants are sensitive to various translational inhibitors in S. cerevisiae. (A) WT (med13∆, cnc1∆), and cdk8∆ cells were grown to midlog phase in synthetic complete dextrose medium (SD-complete), adjusted to the same cell density, and 10-fold dilutions were plated onto either YPD medium or YPD medium supplemented with the drugs indicated. Hyg B – Hyg. B, G418 - Geneticin. (B) Schematic representation illustrating the effects of the drugs used in A on the distinct phases of protein synthesis. (C) Left-hand and middle panels: liquid culture cell growth assays of the strains indicated. Cultures were grown in SD-complete medium and supplemented or not with 800 μg/ml Hyg. B for 6 h at a temperature of 30°C. Error bars indicate SD, N = 3 of biologically independent experiments. Right-hand panel: Summary of the doubling times of the strains shown with and without treatment with 800 μg/ml Hyg. B. (D) As in A, except the strains were treated for 4 h with 2 mg/ml Hyg. B before 10-fold dilutions were plated onto YPD medium. ****p ≤ 0.001.
FIGURE 8:
FIGURE 8:
The CKM remains in the nucleus following exposure to Hyg. B. (A) Western blot analysis of extracts prepared from midlog WT (RSY10) cultures expressing cyclin C-MYC (pKC337) treated with 2 mg/ml Hyg. B in SD-complete medium for the indicated times. Pgk1 was used a normalization control protein. (B) Quantification of the results obtained in A to demonstrate degradation kinetics. The linear regression line indicates log% (log10) protein expression at 1, 2, and 4 h of 2 mg/ml Hyg. B treatment relative to 0 h. Error bars indicate SD, N = 3 of biologically independent experiments. (C) Fluorescence microscopy of cyclin C-mCherry localization in WT (RSY10) cells expressing the mitochondria marker Mito-TFP. Cells were visualized before (0 h) and after 4 h of 2 mg/ml Hyg. B treatment. Representative single-plane images are shown. Scale: 5 μm. (D and E). As in A, except that Med13-MYC was examined. (F) Fluorescence microscopy of Med13-mNeongreen localization in pep4∆ prb1-∆1.6R (RSY2305) cells expressing the nuclear marker Nup49-mCherry. Cells were visualized before (0 h) and after 4 h of 2 mg/ml Hyg. B treatment. Representative single-plane images are shown. Scale: 5 μm.
FIGURE 9:
FIGURE 9:
CCNC/ MEF and HCT116 cell lines are sensitized to translational inhibitors. (A) Annexin V cell death assays in WT or Ccnc/ MEF cells following treatment with 250 μg/ml Hyg. B for 24 h. (B) As is A, except that WT or CCNC/ HCT116 cells were treated with 500 μg/ml Hyg. B. (C) Annexin V cell death assays in WT MEF cells pretreated with 1 μM SEL120-34A or DMSO control for 24 h, before the addition of 250 μg/ml Hyg. B for 24 h. (D) As in C, except WT HCT116 cells were pretreated with 1 μM SEL120-34A (SEL120) or DMSO for 24 h, before adding with 1 mg/ml Hyg. B for 24 h. (E–H) As in A–D, except that cells were treated with 50 nM of HTT for 24 h. For all assays: *p ≤ 0.05, **p ≤ 0.01, ***p ≤ 0.005.
FIGURE 10:
FIGURE 10:
Model of outlining the role of the CKM in controlling RP-encoding gene expression. Left-hand panel: The CKM positively regulates a subset of RP and TIF genes in physiological conditions through either Mediator-dependent or independent mechanisms. One possibility is that CKM interaction with the Mediator inhibits the transcription of a repressor of a subset of RP and TIF genes. Alternatively, Cdk8 of the CKM may also phosphorylate one or more additional TFs, which can bind to the upstream regulatory sequence (URS) of RPL3 and a subset of other RP and TIF genes. This allows the CKM to repress a repressor (such as by triggering its degradation) or activate an activator of these genes. This role of the CKM is not essential for survival. Middle panel: CKM activity promotes survival in translation stress, including errors in translation elongation (inhibited peptide bond formation and translocation) and mistranslation. This may result from RP and TIF genes being constitutively expressed to maintain ribostasis. Cdk8 also may be required to phosphorylate other targets that regulate RP and TIF expression. Alternatively, the CKM may serve functions distinct from RP and TIF gene expression to promote survival following translation stress (see discussion for details). Right-hand panel: following nutrition stress, the translation machinery is predominantly repressed, and autophagy is induced to conserve energy for survival (Advani and Ivanov, 2019). The CKM is disassembled, and Med13 and cyclin C are degraded by autophagy and the proteasome, respectively. This disassembly may permit the accumulation of a repressor, which in turn represses RP genes (Mittal et al., 2017) (right-hand panel). Future studies would be required to test this model in nitrogen starvation. 8: Cdk8; CC: cyclin C; 12: Med12; 13: Med13. URS: Upstream regulatory sequence.

Similar articles

Cited by

References

    1. Abraham AK, Pihl A (1983). Effect of protein synthesis inhibitors on the fidelity of translation in eukaryotic systems. Biochim Biophys Acta 741, 197–203. - PubMed
    1. Adegbola A, Musante L, Callewaert B, Maciel P, Hu H, Isidor B, Picker-Minh S, Le Caignec C, Delle Chiaie B, Vanakker O, et al. (2015). Redefining the MED13L syndrome. Eur J Hum Genet 23, 1308–1317. - PMC - PubMed
    1. Adler AS, McCleland ML, Truong T, Lau S, Modrusan Z, Soukup TM, Roose-Girma M, Blackwood EM, Firestein R (2012). CDK8 maintains tumor dedifferentiation and embryonic stem cell pluripotency. Cancer Res 72, 2129–2139. - PubMed
    1. Advani VM, Ivanov P (2019). Translational control under stress: Reshaping the translatome. Bioessays 41, e1900009. - PMC - PubMed
    1. Alarcon C, Zaromytidou AI, Xi Q, Gao S, Yu J, Fujisawa S, Barlas A, Miller AN, Manova-Todorova K, Macias MJ, et al. (2009). Nuclear CDKs drive Smad transcriptional activation and turnover in BMP and TGF-beta pathways. Cell 139, 757–769. - PMC - PubMed

MeSH terms

LinkOut - more resources