. 2024 Dec 4;146(48):32942-32952.
doi: 10.1021/jacs.4c07274. Epub 2024 Nov 20.

Spatial Control over Reactions via Localized Transcription within Membraneless DNA Nanostar Droplets

Affiliations

Spatial Control over Reactions via Localized Transcription within Membraneless DNA Nanostar Droplets

Eli Kengmana et al. J Am Chem Soc. .

Abstract

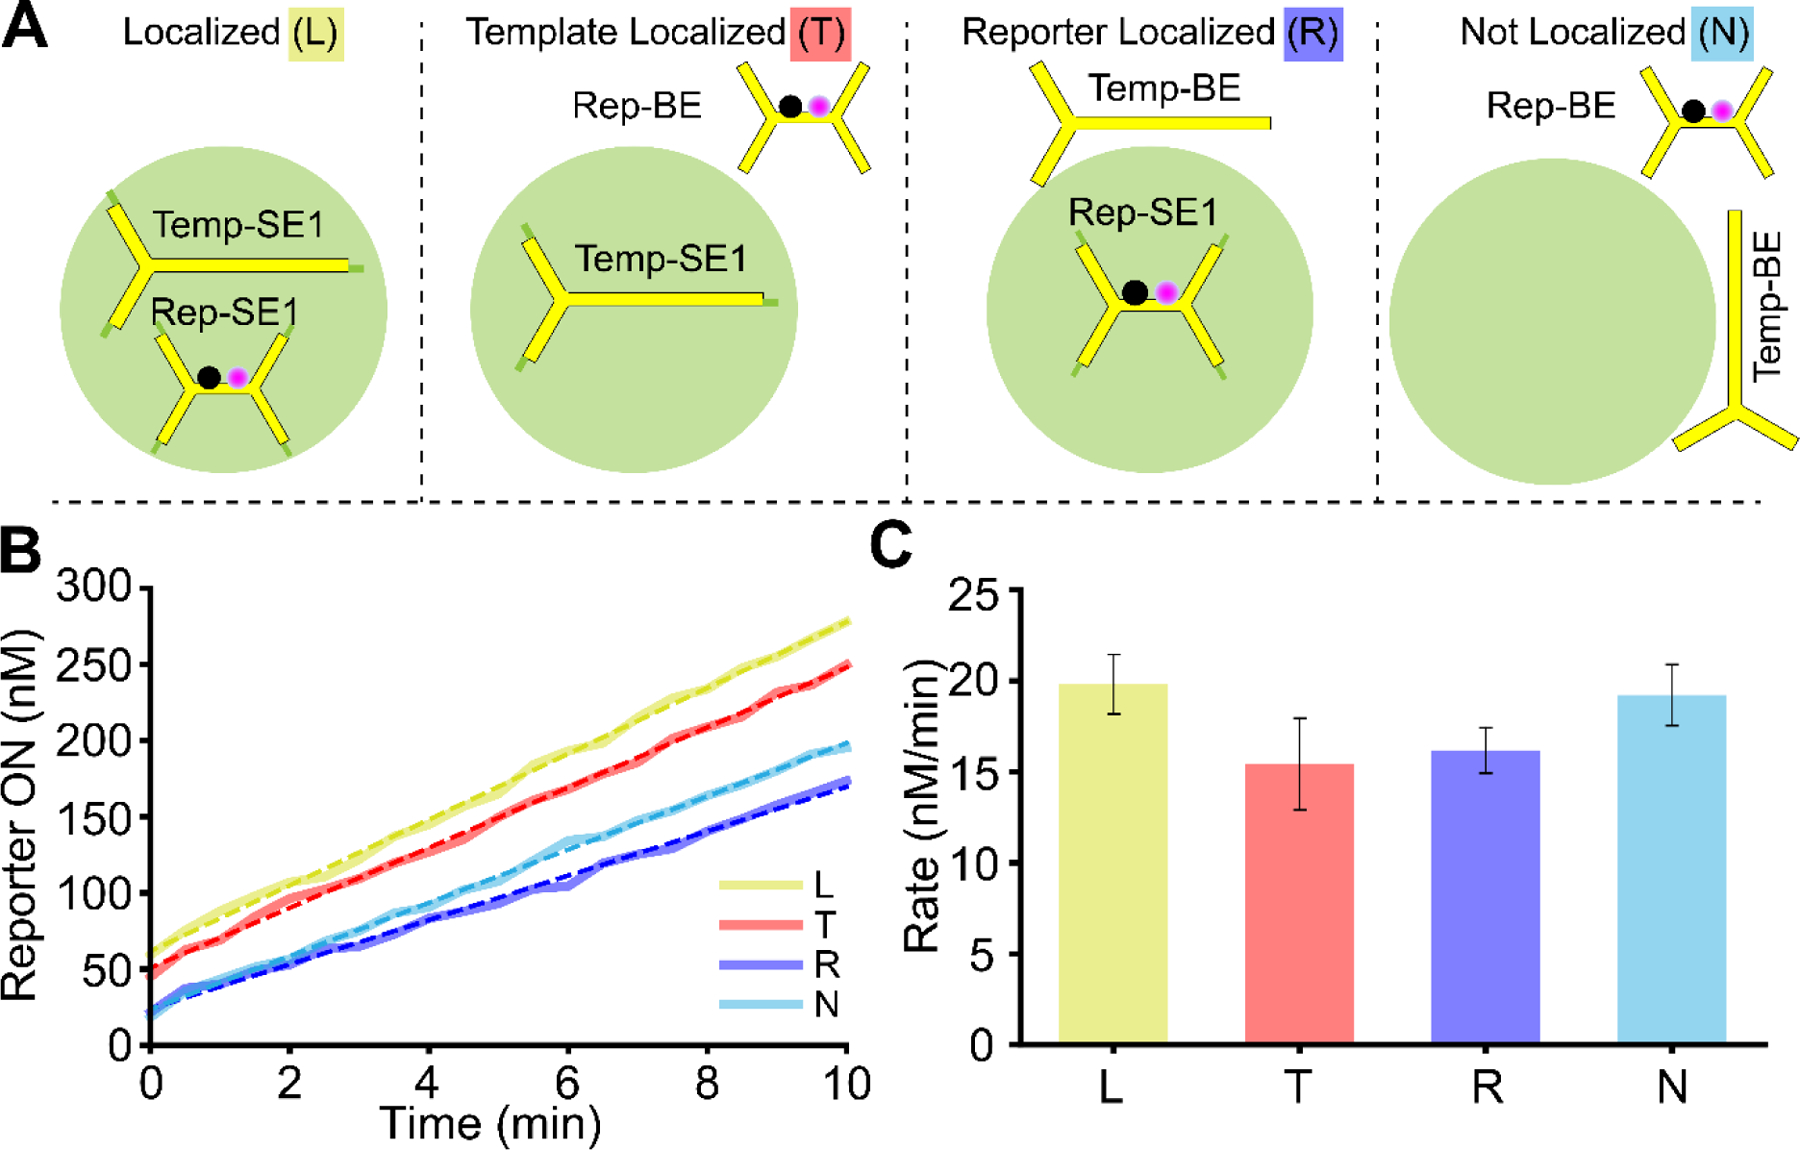
Biomolecular condensates control where and how fast many chemical reactions occur in cells by partitioning reactants and catalysts, enabling simultaneous reactions in different spatial locations of a cell. Even without a membrane or physical barrier, the partitioning of the reactants can affect the rates of downstream reaction cascades in ways that depend on reaction location. Such effects can enable systems of biomolecular condensates to spatiotemporally orchestrate chemical reaction networks in cells to facilitate complex behaviors such as ribosome assembly. Here, we develop a system for developing such control in synthetic systems. We localize different transcription templates within different phase-separated, membraneless DNA nanostar (NS) droplets─programmable, in vitro liquid-liquid phase separation systems for partitioning of substrates and localization of reactions to membraneless droplets. When RNA produced within such droplets is also degraded in the bulk, droplet-localized transcription creates RNA concentration gradients. Consistent with the formation of these gradients, toehold-mediated strand displacement reactions involving transcripts are 2-fold slower far from the site of transcription than when nearby. We then demonstrate how multiple such gradients can form and be maintained independently by simultaneous transcription reactions occurring in tandem, each localized to different NS droplet types. Our results provide a means for constructing reaction systems in which different reactions are spatially localized and controlled without the need for physical membranes. This system also provides a means for generally studying how localized reactions and the exchange of reaction products might occur between protocells.


Conflict of interest statement

Competing Interests Statement

The authors declare no competing interests.

Figures

Figure 1:
Figure 1:. DNA nanostar (NS) transcription system.
(A) YS1’s 3 component strands each present the sticky end sequence SE1 (GCTAGC). YS1 complexes are first annealed in a low-salt solution, then added to a higher salt solution at 37 °C to form D1. (See Materials and Methods.) (B) FRAP of D1 in transcription buffer, 2.5 µM NTPs, and 21.5 mM magnesium acetate at 37 °C using confocal microscopy and FRAP. The dashed vertical line indicates the time to 50% recovery. 10% of YS1 was labeled with FAM. Scale bars are 5 µm. (C) Schematic of transcription and toehold-mediated strand displacement (TMSD) inside D1. Solid lines indicate ssDNA, dashed lines indicate ssRNA. Base pairing is indicated by perpendicular connecting lines between pairs. (i) The nanostar Temp-SE1 has one arm containing a template for the transcription of the sequence rA. The T7 RNAP promoter sequence is indicated by a box with an arrow on top. (ii) rA reacts with the reporter complex Rep-SE1. Rep-SE1 has low fluorescence (i.e. is OFF). The reaction with rA produces Rep-F-SE1 and Rep-Q-SE1; Rep-F-SE1 has high fluorescence (i.e. is ON). (D) Measured concentration of ON reporter over time resulting from either combining template Temp-SE1 and Rep-SE1 or a corresponding “linear” template LinTemp and reporter LinRep, lacking nanostar arms and sticky ends. No YS1 was present in either reaction. Arrow indicates the time at which T7 RNAP was added to initiate the reaction. N=3 for both cases. Shaded regions indicate standard deviation. (E) RNases A/T1 degrade ssRNA.
Figure 2:
Figure 2:. Temp-SE1 and Rep-SE1 colocalize to droplets and can participate in transcription and TMSD reactions inside droplets.
(A) Experiment schematics. Temp-SE1 (NS template), the reporter Rep-SE1, and the products of a reaction between the transcribed sequence and the reporter were each combined with YS1, and the partition coefficients of each complex were then measured. (B) Confocal fluorescence micrographs of the labeled complexes from (A) and the corresponding partition coefficients P and their standard errors of the mean (SEM). Each complex whose partition coefficients was measured had a FAM fluorescent label. YS1 was unlabeled. Scale bars = 20 µm. (C) Schematic of an experiment to assess whether YS1 and Temp-SE1 remain partitioned to D1 during transcription and whether transcribed RNA can react with the reporter. (D) Confocal microscopy images of droplets containing 5 µM YS1, 100 nM Temp-SE1, and 1000 nM Rep-SE1 before (top) and 32 minutes after (bottom) T7 RNAP addition showing fluorescently labeled YS1 (green), Temp-SE1 (blue), and Rep-SE1 (magenta). The contrast of the images of Temp-SE1 before and after transcription were adjusted equally for clarity (Figure S7). Scale bars = 50 µm.
Figure 3:
Figure 3:. Observed rates of reaction between reporter (Rep) and rA when Temp and Rep are each either localized or not localized to droplets.
(A) Schematic showing different experiments in which a template, reporter, both, or neither are localized to D1. (B) The concentration of Reporter ON (reacted Rep) in the 10 minutes after T7 RNAP addition for the scenarios in (A). N=3 experimental replicates for each scenario. Dashed lines are linear fits. (C) The initial rates at which the reporter is turned on, obtained using the linear fits in (B). Error bars indicate standard error of the mean. N=3 for each scenario.
Figure 4:
Figure 4:. Reporters colocalized with transcription templates react faster with transcript than those localized to a different type of droplet.
(A) Schematics of experiments in which the transcription template is colocalized with D1 (Temp-SE1), D2 (Temp-SE2), or where it does not localize to a droplet (Temp-BE). Rep-SE1 and Rep-SE2 were labeled with Atto488 and TexasRed fluorophores, respectively. (B) Kinetic profiles of the reporter fluorescence of Rep-SE1 (green) and Rep-SE2 (cyan) over 10 minutes after T7 RNAP addition for the 3 scenarios outlined in (A). Linear fits are shown as dashed lines of the corresponding color. (C) Rates of fluorescence increase from Rep-SE1 (green) and Rep-SE2 (cyan) for the scenarios in (A). Error bars indicate standard error of the mean, N=3 for each scenario. (D) Schematic of experiments monitoring transcription in each type of droplet via fluorescence confocal microscopy. Rep-SE1 and Rep-SE2 are both labeled with TexasRed. 10% of YS1 (D1) is labeled with Atto488. YS2 is unlabeled. (E) Confocal fluorescence micrographs of Scenario 1 (top) and Scenario 2 (bottom) shown in D, each captured 30 minutes after the initiation of transcription. The contrast of the Rep channel images is adjusted for clarity (Figure S7). Scale bars are 50 µm. The images showing Rep in D1 or Rep in D2 are made by masking the NR channel using positive and negative masks, respectively, consisting of the Atto488 channel capturing YS1 (Supplementary. Note 1). (F) Histograms of the minimum distances between droplets and bulk solution (Droplet-to-bulk and bulk-to-droplet) or between D1 and D2 in confocal micrographs of transcription reactions. Insets describe the measurements graphically; the blunt end of the arrow is the pixel of interest, and the arrowhead is the nearest pixel in the destination phase. Dashed vertical lines indicate average distance.
Figure 5:
Figure 5:. Segregation of different transcription reactions by localizing their templates to different droplet types creates distinct reaction microenvironments.
(A) Schematic of an experiment in which two different RNA molecules are transcribed from templates colocalized to two different droplet types. The rates of reaction of both RNAs were measured using localized reporters (Rep-A and Rep-B) in both droplets. Rep-A-SE1, Rep-A-SE2, Rep-B-SE1, and Rep-B-SE2 were all added in equimolar concentrations at 250 nM. Rep-A and Rep-B are fluorescently labeled with Atto488 and TexasRed, respectively. Temp-A-SE1 and Temp-B-SE2 are fluorescently labeled with Alexa405 and Alexa647 fluorophores respectively. YS1 and YS2, which form D1 and D2, are both unlabeled. (B) Confocal fluorescence micrographs of droplets for the experiment depicted in A before transcription is initiated. Temp-A-SE1 (blue), Temp-B-SE2 (red), and a merged image of the two channels are shown. Scale bar = 50 µm. Temp-A-SE1 channel contrast is adjusted for clarity (Figure S7). (C) Confocal fluorescence micrographs before (left column) and 25 minutes after (right column) T7 RNAP addition for the experiment depicted in A. Rep-A and Rep-B fluorescence are indicated by yellow and magenta, respectively. Scale bars = 50 µm. (D) Density scatter plots of Rep-A and Rep-B fluorescence intensity before transcription (left) and 25 minutes after transcription (right) obtained from their respective image channels in (C). To omit background pixels from the scatterplot, fluorescence intensity values below 1000 a.u. and 3000 a.u. for before and 25 minutes after transcription, respectively, were not included in the plot. (E) Box and whisker plots of the fluorescence for Rep-A and Rep-B before transcription and 25 minutes after transcription. Blue and red boxes indicate levels of fluorescence in NSDs containing Temp-A-SE1 and Temp-B-SE2, respectively. Black horizontal lines in the colored boxes indicate the median. White squares indicate the average. Black dots indicate outliers. Whiskers indicate 1.5 times the interquartile range.
Scheme 1:
Scheme 1:
Localizing a model reaction, transcription, within droplets leads to faster rates of downstream reactions (here the reaction of RNA with a reporter) in and near the droplets where transcription occurs (and therefore higher fluorescence) compared to the rate of the downstream reaction in distal droplets.

References

    1. Lyon AS; Peeples WB; Rosen MK A Framework for Understanding the Functions of Biomolecular Condensates across Scales. Nat. Rev. Mol. Cell Biol 2021, 22 (3), 215–235. 10.1038/s41580-020-00303-z. - DOI - PMC - PubMed
    1. Kent S; Brown K; Yang C; Alsaihati N; Tian C; Wang H; Ren X Phase-Separated Transcriptional Condensates Accelerate Target-Search Process Revealed by Live-Cell Single-Molecule Imaging. Cell Rep. 2020, 33 (2), 108248. 10.1016/j.celrep.2020.108248. - DOI - PMC - PubMed
    1. Tatomer DC; Terzo E; Curry KP; Salzler H; Sabath I; Zapotoczny G; McKay DJ; Dominski Z; Marzluff WF; Duronio RJ Concentrating Pre-mRNA Processing Factors in the Histone Locus Body Facilitates Efficient Histone mRNA Biogenesis. J. Cell Biol 2016, 213 (5), 557–570. 10.1083/jcb.201504043. - DOI - PMC - PubMed
    1. Woodruff JB; Ferreira Gomes B; Widlund PO; Mahamid J; Honigmann A; Hyman AA The Centrosome Is a Selective Condensate That Nucleates Microtubules by Concentrating Tubulin. Cell 2017, 169 (6), 1066–1077.e10. 10.1016/j.cell.2017.05.028. - DOI - PubMed
    1. Hirose T; Virnicchi G; Tanigawa A; Naganuma T; Li R; Kimura H; Yokoi T; Nakagawa S; Bénard M; Fox AH; Pierron G NEAT1 Long Noncoding RNA Regulates Transcription via Protein Sequestration within Subnuclear Bodies. Mol. Biol. Cell 2014, 25 (1), 169–183. 10.1091/mbc.e13-09-0558. - DOI - PMC - PubMed

LinkOut - more resources