. 2024 Nov 22;10(47):eadr5807.
doi: 10.1126/sciadv.adr5807. Epub 2024 Nov 20.

Structure of the human TSC:WIPI3 lysosomal recruitment complex

Affiliations

Structure of the human TSC:WIPI3 lysosomal recruitment complex

Charles Bayly-Jones et al. Sci Adv. .

Abstract

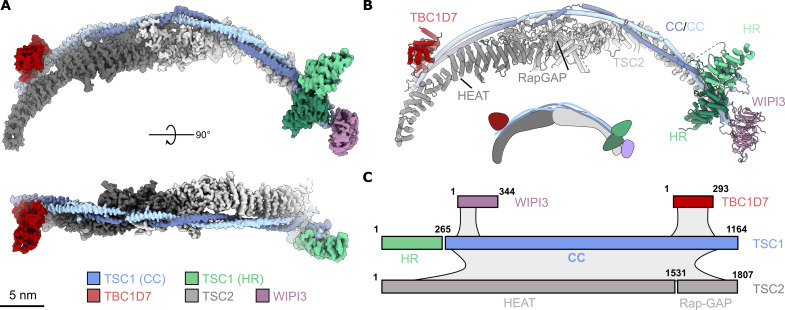
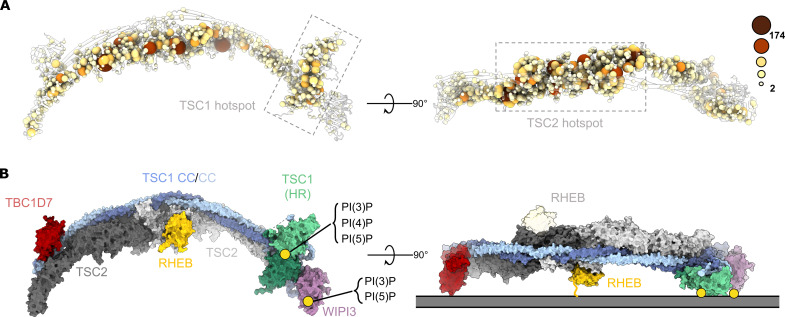
Tuberous sclerosis complex (TSC) is targeted to the lysosomal membrane, where it hydrolyzes RAS homolog-mTORC1 binding (RHEB) from its GTP-bound to GDP-bound state, inhibiting mechanistic target of rapamycin complex 1 (mTORC1). Loss-of-function mutations in TSC cause TSC disease, marked by excessive tumor growth. Here, we overcome a high degree of continuous conformational heterogeneity to determine the 2.8-Å cryo-electron microscopy (cryo-EM) structure of the complete human TSC in complex with the lysosomal recruitment factor WD repeat domain phosphoinositide-interacting protein 3 (WIPI3). We discover a previously undetected amino-terminal TSC1 HEAT repeat dimer that clamps onto a single TSC wing and forms a phosphatidylinositol phosphate (PIP)-binding pocket, which specifically binds monophosphorylated PIPs. These structural advances provide a model by which WIPI3 and PIP-signaling networks coordinate to recruit TSC to the lysosomal membrane to inhibit mTORC1. The high-resolution TSC structure reveals previously unrecognized mutational hotspots and uncovers crucial insights into the mechanisms of TSC dysregulation in disease.


Figures

Fig. 1.
Fig. 1.. Overall structure of the TSC:WIPI3 complex.
(A) High-resolution reconstruction (composite) of the TSC:WIPI3 complex. Scale bar, 5 nm. (B) Cartoon model of the TSC:WIPI3 complex [oriented as in (A)]. Below, a two-dimensional (2D) schematic of the TSC:WIPI3 architecture. (C) Schematic showing the domain structure of the TSC components, as well as approximate interfaces and interactions (gray shading) between subunits. CC, coiled coil; HR, HEAT repeat.
Fig. 2.
Fig. 2.. The TSC1 HR domain and the structural basis of WIPI3 binding.
(A) Focused view of the TSC HR dimer. A single subunit of the TSC1 HR dimer mediates contacts to the TSC1 CC domain and the TSC2 HRs. Two regions of the large extended loop (TSC1 IDR1) shield the exposed second binding site of the TSC1 N-terminal dimer. Top: Schematic of the TSC1 HR dimer in context of TSC. (B) The TSC1 HR dimer clamps onto a hydrophobic helix of the TSC1 CC domain. The second TSC1 helix is hidden for clarity [shown in (A), dark blue]. (C) Key contacts in the TSC1 HR dimer interface mediated by the first TSC1 extended loop (IDR1). (D) Focused view of the WIPI3:TSC1 interaction as resolved by cryo-EM. (E) The 3.17-Å crystal structure of WIPI3 in complex with the TSC1 WIR motif. Bottom: Schematic of the WIPI3 binding site in context of TSC.
Fig. 3.
Fig. 3.. The TSC1 HR dimer is a monophosphorylated PIP selective membrane association domain.
(A) Cartoon rendering of the TSC N-terminal PIP-binding domain and the WIPI3:TSC interaction. Inset: Illustration of the PIP binding sites of WIPI3 and the TSC1 HR dimer. (B) Surface rendering colored by coulomb potential. Several positively charged regions are presented on the surface. (C) The symmetrical arrangement of conserved lysine and arginine residues define an electro-positive recessed pocket. (D) Immunoblot of full length TSC probed against phosphatidylinositol lipid membrane strips illustrating specificity for monophosphorylated phosphatidylinositols. LPA, lysophosphatidic acid; LPC, lysophosphatidylcholine; PI, phosphatidylinositol; PE, phosphatidylethanolamine; PC, phosphatidylcholine; PA, phosphatidic acid; PS, phosphatidylserine; SIP, sphingosine-1-phosphate. (E) Densitometry analysis of replicate phosphatidylinositol lipid membrane strips. WT, wild type. AA, TSC K238A, R204A. Symbols show values from independent experimental replicates, the bold line shows the mean, and error bars show SEM; n.s., not significant; P values were determined using ordinary one-way analysis of variance (ANOVA) with Šidák’s multiple comparisons test (***P < 0.0002 and ****P < 0.0001). (F) Steady-state binding of TSC to 5% molar PI(3)P lipid bilayer (L1 chip) with 1,2-dioleoyl-sn-glycero-3-phosphocholine:1,2-dioleoyl-sn-glycero-3-phosphoethanolamine. Symbols show values from independent experimental replicates. RU, response units. (G) Stead-state affinity measurement of wild-type TSC (one-to-one binding model, solid line) estimates an apparent dissociation constant (Kd) of 237 nM, compared to 353 nM for both TSC K238A, R204A (AA) and TSC R204E (RE). (H) Plateau values of maximal response, RMAX, corresponding to model fit (F). Symbols show values from independent biological replicates, and the bold line shows the mean.
Fig. 4.
Fig. 4.. TSC:WIPI3 disease–associated mutations and model of the TSC:WIPI3:RHEB lysosomal mTORC1 inhibitory complex.
(A) Cα atoms of all disease-associated missense mutations are rendered as spheres of size and color proportional to the frequency of observation (COSMIC, LOVD, and HGMD) (–57). Disease-associated mutations cluster to the TSC1 HR PIP-binding dimer (left), as well as the TSC2 Rap-GAP central core (right). (B) Surface rendering of the complete human TSC with RHEB modelled according to AlphaFold (58). The binding sites of RHEB, TSC1:PI(3)P, and WIPI3:PI(3)P define a membrane binding plane that is consistent with a singly occupied RHEB-binding model of the TSC:WIPI3:RHEB lysosomal mTORC1 inhibitory complex.

References

    1. Laplante M., Sabatini D. M., mTOR signaling in growth control and disease. Cell 149, 274–293 (2012). - PMC - PubMed
    1. Zhang Y., Gao X., Saucedo L. J., Ru B., Edgar B. A., Pan D., Rheb is a direct target of the tuberous sclerosis tumour suppressor proteins. Nat. Cell Biol. 5, 578–581 (2003). - PubMed
    1. Inoki K., Li Y., Xu T., Guan K. L., Rheb GTPase is a direct target of TSC2 GAP activity and regulates mTOR signaling. Genes Dev. 17, 1829–1834 (2003). - PMC - PubMed
    1. Tee A. R., Manning B. D., Roux P. P., Cantley L. C., Blenis J., Tuberous sclerosis complex gene products, Tuberin and Hamartin, control mTOR signaling by acting as a GTPase-activating protein complex toward Rheb. Curr. Biol. 13, 1259–1268 (2003). - PubMed
    1. Castro A. F., Rebhun J. F., Clark G. J., Quilliam L. A., Rheb binds tuberous sclerosis complex 2 (TSC2) and promotes S6 kinase activation in a rapamycin- and farnesylation-dependent manner. J. Biol. Chem. 278, 32493–32496 (2003). - PubMed

MeSH terms

Substances

LinkOut - more resources