. 2024 Nov 22;10(47):eadq6342.
doi: 10.1126/sciadv.adq6342. Epub 2024 Nov 20.

Hepatovirus translation requires PDGFA-associated protein 1, an eIF4E-binding protein regulating endoplasmic reticulum stress responses

Affiliations

Hepatovirus translation requires PDGFA-associated protein 1, an eIF4E-binding protein regulating endoplasmic reticulum stress responses

Takayoshi Shirasaki et al. Sci Adv. .

Abstract

The overexpression and misfolding of viral proteins in the endoplasmic reticulum (ER) may cause cellular stress, thereby inducing a cytoprotective, proteostatic host response involving phosphorylation of eukaryotic translation initiation factor 2 subunit alpha (eIF2α). Here, we show that hepatitis A virus, a positive-strand RNA virus responsible for infectious hepatitis, adopts a stress-resistant, eIF2α-independent mechanism of translation to ensure the synthesis of viral proteins within the infected liver. Cap-independent translation directed by the hepatovirus internal ribosome entry site and productive hepatovirus infection of mice both require platelet-derived growth factor subunit A (PDGFA)-associated protein 1 (PDAP1), a small phosphoprotein of unknown function with eIF4E-binding activity. PDAP1 also interacts with eIF1A and is essential for translating stress-resistant host messenger RNAs that evade the proteostatic response to ER stress and that encode proteins promoting the survival of stressed cells.


Figures

Fig. 1.
Fig. 1.. PDAP1 is an essential hepatovirus host factor.
(A) Immunoblots showing PDAP1 expressed in PDAP1-deficient (PDAP1-KO1.4 and PDAP1-KO-2) versus control (sgCtrl) cells transduced with nontargeting sgRNA. (B) HAV RNA quantified by RT-PCR in PDAP1-KO1.4 and control sgCtrl cells 72 hours after inoculation of gradient-purified quasi-enveloped (eHAV) or naked (nHAV) 18f virus. Cells were transduced with PDAP1-Flag–expressing lentivirus or empty vector (EV) prior to HAV challenge. (C) NLuc expressed by the 18f-NLuc reporter virus in PDAP1-KO1.4 versus sgCtrl cells, with or without PDAP1 reconstituted as in (B). LU, light units. (D) Infectious virus released from PDAP1-KO1.4 and sgCtrl cells 24 hours after infection [with and without PDAP1 reconstitution as in (C)] was quantified by inoculating dilutions of cell culture supernatant fluids onto naïve Huh-7.5 cells, with NLuc activity measured 72 hours later. Data shown in (B) to (D) are means ± SD of N = 3 technical replicates from representative experiments. (E) (Left) HAV RNA abundance and (right) fold change in innate immune response gene transcript abundance 15 hours after intravenous virus challenge of male AlbCre+Pdap1f/f or B6 mice. N = 4, P values by two-sided t test. GE, genome equivalents. (F) HAV RNA abundance in feces of male Ifnar1−/− versus AlbCre+Pdap1f/fIfnar1−/− mice (N = 5 to 6) determined by RT-qPCR 5 and 7 days after virus inoculation (dpi). LOD, limit of detection. (G) Viral RNA abundance in livers of male Ifnar1−/−, AlbCre+Pdap1f/fIfnar1−/−, or B6 mice (N = 5 to 8) inoculated with 2 × 10⁶ GE virus 7 dpi. P value by two-sided Mann-Whitney test. (H) Serum ALT activities in Ifnar1−/− or AlbCre+Pdap1f/fIfnar1−/− mice 4 and 7 dpi. ULN, upper limit of normal. Each symbol in (E) and (F) represents an individual animal; columns represent means ± SD. (I) Representative H&E-stained sections of livers from Ifnar1−/− or AlbCre+Pdap1f/fIfnar1−/− mice 7 days after intravenous virus challenge. Arrows denote apoptotic hepatocytes with surrounding inflammatory cells. Scale bars, 50 μm.
Fig. 2.
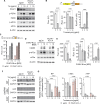
Fig. 2.. PDAP1 is required for HAV IRES-mediated translation.
(A) (Left) Quasi-enveloped (eHAV) and naked virus (nHAV) attached to control sgCtrl and PDAP1-KO1.4 cells at 4°C, measured by RT-PCR. (Right) Cell uptake of HAV at 37°C. GE, genome equivalent. (B) FLuc expressed by sub-genomic HAV replicon RNA. GAA, lethal 3Dpol mutation. (C) HAV RNA decay in sgCtrl and PDAP1-KO1.4 cells electroporated with 18f viral RNA containing a lethal 3Dpol mutation. RNA abundance measured by RT-qPCR. Data are means ± SD of N = 3 technical replicates. (D) circRNA IRES reporter transcript with split G/FP sequence flanking the IRES and upstream intron and downstream inverse repeat sequences (REP) driving backsplicing. (E) Immunoblots of GFP expressed by HAV, HCV, PV, EMCV, and KSHV circRNA IRES reporter plasmids transfected into sgCtrl or PDAP1-KO1.4 cells. (F) IRES-mediated translation efficiency in PDAP1-KO1.4 versus sgCtrl cells (100%), calculated as GFP/GAPDH abundance normalized to circRNA transcripts quantified by specific RT-qPCR. Data are means ± SEM from N = 3 to 6 independent transfections. *P < 0.05; **P < 0.01; ***P < 0.001, by one-sample t test and Wilcoxon test. (G) HAV RNA associated with polysomes in sgCtrl cells, PDAP1-KO1.4 cells, or PDAP1-KO1.4 cells transduced with lentivirus expressing PDAP1-Flag. Cells were harvested 5 hours after infection, and ribosomes were separated on a 10 to 50% sucrose gradient. Below are immunoblots of PDAP1-Flag and eIF4E in fractions from HAV-infected PDAP1-KO1.4 cells expressing PDAP1-Flag, with and without 50 mM EDTA. (H) Translation efficiency (percent RNA associated with polysomes) of HAV and β-actin mRNA in PDAP1-KO1.4 cells, relative to sgCtrl cells (100%) in two independent experiments. (I) [35S]-Met/Cys incorporated into trichloroacetic acid–precipitable material over 30-min incubation in PDAP1-KO1.4 cells normalized to sgCtrl cells (100%), with or without HAV infection. CHX, 100 μg/ml cyclohexamide (CHX). Data are means ± SD of N = 3 technical replicates. *P < 0.05; **P < 0.01; ***P < 0.001, by t test.
Fig. 3.
Fig. 3.. PDAP1 is an eIF4E-binding protein.
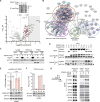
(A) AlphaFold prediction of the PDAP1 structure showing the canonical 4E-binding motif and serine residues identified as sites of phosphorylation (AlphaFold Protein Structure Database Q13442) (32). aa, amino acid. (B) Amino acid alignment of PDAP1 with known eIF4E-binding proteins, including 4E-T and C8orf33. The YXXXXLΦ motif is boxed in red, with other conserved Lys/Arg residues boxed in blue. (C) Immunoblots of proteins immunoprecipitated (IP) by anti-Flag from lysates of cells expressing PDAP1-Flag or empty vector (“−”), with or without HAV infection. (D) Glutathione bead pull-down of bacterially expressed PDAP1 mixed with GST-eIF4E and GST-eIF4E coimmunoprecipitation with PDAP1. Purified recombinant proteins were mixed with a 300-fold molar excess of human serum albumin. (E) Immunoblots of proteins pulled down with glutathione beads from lysates of PDAP1-KO1.4 cells expressing PDAP1-Flag, PDAP1-Y124A-Flag, or empty vector (“−”) following addition of bacterially expressed GST-eIF4E. sgCtrl, control cells. (F) (Left) GFP expressed by the HAV circRNA IRES-GFP reporter in PDAP1-KO1.4 and control cells transfected with PDAP1-Flag, PDAP1-Y124A-Flag or empty vectors (“−”). (Right) Estimated IRES activity calculated as (GFP/GAPDH)/circRNA quantified by RT-PCR. P value by two-way ANOVA, N = 3 independent experiments. AU, arbitrary units. (G) 18f/NLuc reporter virus replication in PDAP1-KO1.4 cells reconstituted with wild-type or Y124A mutant PDAP1. EV, empty vector. (H) MS intensities of phosphorylated PDAP1 peptides identified by LC-MS following phospho-peptide enrichment of lysates from mock-infected or HAV-infected Huh-7.5 cells. Data are means of two technical replicates of each of three independent samples. Adjusted P value by ANOVA. (I) Impact of phospho-mimetic and phospho-ablative mutations on lentivirus-expressed PDAP1-Flag rescue of 18f-NLuc reporter virus replication in PDAP1-KO1.4 cells. P values by nonparametric Friedman test with Dunn’s correction for multiple comparisons.
Fig. 4.
Fig. 4.. PDAP1 protein and RNA interactions.
(A) (Top) SDS-PAGE gel of anti-Flag precipitates from lysates of HAV-infected cells transfected with the empty vector versus PDAP1-Flag expression vector. (Bottom) Volcano plot of proteins identified by LC-MS in in-gel digests of anti-Flag precipitates. (B) STRING v12.0 prediction of physical complexes formed by proteins >8-fold enriched in anti-Flag precipitates from cells with or without HAV infection [shaded zone in (A)]. The thickness of connecting lines corresponds to confidence of the physical interaction. Proteins associated with the Kyoto Encyclopedia of Genes and Genomes (KEGG) pathway for ribosome biogenesis are shown in green (hsa03008, Q = 2.53 × 10⁻⁵), spliceosome in blue (hsa03040, Q = 1.69 × 10⁻⁶) or Gene Ontology (GO) for large ribosome subunit biogenesis in magenta (GO 0042273, Q = 5.20 × 10⁻⁹), and stress granule regulation in yellow (GO 0063029, Q = 7.8 × 10⁻⁴) or green (GO 1903608, Q = 5.55 × 10⁻⁵). (C) Immunoblots of anti-Flag precipitates from lysates of cells transfected with the PDAP1-Flag expression vector or empty vector. A postribosome 100K supernatant and ribosome-enriched pellet were generated by high-speed centrifugation. L13A, large ribosomal subunit protein uL13. (D) Coimmunoprecipitation of recombinant C-terminally His-tagged rPDAP1-His and N-terminally His-tagged rHis-eIF1A, both produced in bacteria, with anti-PDAP1 or anti-eIF1A. Input mixtures contained a >300-fold molar excess of human serum albumin. (E) HAV circRNA IRES reporter activity in cells transfected with four siRNAs targeting eIF1A transcripts. Bars show GFP normalized to circRNA abundance. N = 3 experiments. P values by ANOVA. Below are immunoblots for GFP, eIF1A, and GAPDH (loading control) from a representative experiment. AU, arbitrary units. (F) NLuc activity 5 days after quasi-enveloped 18f-NLuc reporter virus infection of cells transfected previously with siRNAs targeting eIF1A. Immunoblots for eIF1A and β-actin (loading control) are shown below. LU, light units. (G) Immunoblots of proteins in lysates of sgCtrl and PDAP1-KO1.4 cells coprecipitating with an RNA probe comprising the complete 5′UTR of 18f virus linked to biotin at its 3′ end.
Fig. 5.
Fig. 5.. PDAP1-dependent translation and cell stress.
(A) Immunoblots of sgCtrl and PDAP1-KO1.4 cell lysates collected 12 hours after tunicamycin (Tm) treatment. (B) Dicistronic HAV IRES reporter activity in tunicamycin-treated Huh-7.5 cells. Cells were transfected with plasmid DNA 1 hour after addition of tunicamycin and harvested 24 hours later for FLuc and RLuc assays. N = 3 technical replicates from a representative experiment. P values by one-way ANOVA. LU, light units; AU, arbitrary units. (C) NLuc activity reflecting replication of the CHIKV-NLuc reporter virus in sgCtrl and PDAP1-KO1.4 cells 24 hours after infection. MOI, multiplicity of infection. (D) Immunoblots of CHIKV capsid protein, p-eIF2a, and eIF2a in lysates from sgCtrl and PDAP1-KO1.4 cells 24 hours after CHIKV-NLuc infection. (E) Dicistronic HAV IRES reporter [see (B)] activity in CHIKV-NLuc–infected sgCtrl cells. Cells were transfected with plasmid DNA 1 hour after infection and harvested 24 hours later for FLuc and RLuc assays. P values by one-way ANOVA. Data shown represent N = 3 technical replicates. (F) Immunoblots of GFP expressed by circRNA IRES reporters containing BiP, c-Myc, and XIAP IRES sequences in tunicamycin-treated sgCtrl versus PDAP1-KO1.4 cells. (G) BiP, c-Myc, and XIAP translational efficiencies in sgCtrl and PDAP1-KO1.4 cells, with and without tunicamycin treatment, based on GFP expression normalized to circRNA abundance measured by RT-qPCR. P values by two-way ANOVA, with corrections for multiple comparisons using the Benjamini, Krieger, and Yekutieli method. N = 3 independent experiments.
Fig. 6.
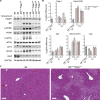
Fig. 6.. ER stress response in mice with hepatocyte-targeted Pdap1 knockout.
(A) Immunoblots of PDAP1 and stress response–related proteins in liver tissues from AlbCre+Pdap1f/f and B6 mice 24 hours after intraperitoneal inoculation of a single dose (1 mg/kg) of tunicamycin. (B) Fold change in intrahepatic Pdap1 and stress-related host gene (Hsap5, Atf4, Ddit3, and Xiap) transcript levels in B6 and AlbCre+Pdap1f/f mice, quantified by RT-PCR relative to Actb transcript levels, 24 and 72 hours (h) after administration of tunicamycin. Heavily shaded columns on the left represent relative transcript levels in untreated AlbCre+Pdap1f/f versus B6 mice. Each symbol represents an individual animal. (C) H&E-stained sections of liver from (left) B6 or (right) AlbCre+Pdap1f/f mice 72 hours after administration of tunicamycin. Scale bars, 100 μm.

References

    1. S. M. Lemon, in Fields Virology: RNA Viruses, P. M. Howley, D. M. Knipe, Eds. (Wolters Kluwer, ed. 7, 2022), pp. 22–58.
    1. Brown E. A., Day S. P., Jansen R. W., Lemon S. M., The 5′ nontranslated region of hepatitis A virus: Secondary structure and elements required for translation in vitro. J. Virol. 65, 5828–5838 (1991). - PMC - PubMed
    1. Brown E. A., Zajac A. J., Lemon S. M., In vitro characterization of an internal ribosomal entry site (IRES) present within the 5′ nontranslated region of hepatitis A virus RNA: Comparison with the IRES of encephalomyocarditis virus. J. Virol. 68, 1066–1074 (1994). - PMC - PubMed
    1. Whetter L. E., Day S. P., Elroy-Stein O., Brown E. A., Lemon S. M., Low efficiency of the 5′ nontranslated region of hepatitis A virus RNA in directing cap-independent translation in permissive monkey kidney cells. J. Virol. 68, 5253–5263 (1994). - PMC - PubMed
    1. Ali I. K., McKendrick L., Morley S. J., Jackson R. J., Activity of the hepatitis A virus IRES requires association between the cap-binding translation initiation factor (eIF4E) and eIF4G. J. Virol. 75, 7854–7863 (2001). - PMC - PubMed

Substances