. 2024 Nov 20;16(774):eadq5091.
doi: 10.1126/scitranslmed.adq5091. Epub 2024 Nov 20.

Disrupting the RNA polymerase II transcription cycle through CDK7 inhibition ameliorates inflammatory arthritis

Affiliations

Disrupting the RNA polymerase II transcription cycle through CDK7 inhibition ameliorates inflammatory arthritis

Xi Chen et al. Sci Transl Med. .

Abstract

Macrophages are key drivers of inflammation and tissue damage in autoimmune diseases including rheumatoid arthritis. The rate-limiting step for transcription of more than 70% of inducible genes in macrophages is RNA polymerase II (Pol II) promoter-proximal pause release; however, the specific role of Pol II early elongation control in inflammation, and whether it can be modulated therapeutically, is unknown. Genetic ablation of a pause-stabilizing negative elongation factor (NELF) in macrophages did not affect baseline Pol II occupancy but enhanced the transcriptional response of paused anti-inflammatory genes to lipopolysaccharide followed by secondary attenuation of inflammatory signaling in vitro and in the K/BxN serum transfer mouse model of arthritis. To pharmacologically disrupt the Pol II transcription cycle, we used two covalent inhibitors of the transcription factor II H-associated cyclin-dependent kinase 7 (CDK7), THZ1 and YKL-5-124. Both reduced Pol II pausing in murine and human macrophages, broadly suppressed induction of pro- but not anti-inflammatory genes, and rapidly reversed preestablished inflammatory macrophage polarization. In mice, CDK7 inhibition ameliorated both acute and chronic progressive inflammatory arthritis. Lastly, CDK7 inhibition down-regulated a pathogenic gene expression signature in synovial explants from patients with rheumatoid arthritis. We propose that interfering with Pol II early elongation by targeting CDK7 represents a therapeutic opportunity for rheumatoid arthritis and other inflammatory diseases.


Conflict of interest statement

Competing interests: N.S.G. is a founder, science advisory board member (SAB), and equity holder in Syros, C4, Allorion, Lighthorse, Inception, Matchpoint, Shenandoah (board member), Larkspur (board member), and Soltego (board member). The Gray lab receives research funding from Springworks. T.Z. is a scientific founder, equity holder, and consultant of Matchpoint and equity holder of Shenandoah. L.T.D. is a member of the NIH industry-sponsored Accelerating Medicines Partnership (AMP) consortium and receives research funding from BMS. The other authors declare that they have no competing interests. YKL-5-124 is covered by patent number US10870651B2.

Figures

Fig. 1.
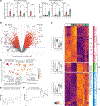
Fig. 1.. CDK7 inhibition attenuates the assembly of Pol II promoter-proximal pausing complexes in BMMΦ.
(A) BMMΦ were treated with THZ1 or YKL-5-124 (250 nM each for 4 to 6 hours, as shown), and occupancy of NELF-E (left) and Pol II (middle) at the TSS of the indicated genes was assessed by ChIP-qPCR using signal with nonspecific IgG as background. NELF-E or Pol II signal in DMSO vehicle-treated BMMΦ was set to 1, and the NELF-E/Pol II ratio of means is shown on the right. n = 3; error bars are SEM; data were analyzed by Student’s t test; **P < 0.01; ***P < 0.001; ****P < 0.0001. (B to D) NELF-E ChIP-seq (n = 3) was performed in BMMΦ treated with YKL-5-124 or DMSO for 6 hours. (B) The upset plot shows total numbers of unfiltered shared (left column) or unique (middle and right columns) peaks (bottom) and their distribution (%) relative to the indicated genomic elements (top). Utr5, 5′ untranslated region. (C) The volcano plot shows the filtered NELF-E peaks down-regulated (left; logFC < −0.6, P < 0.05; n = 471) or up-regulated (right; logFC > 0.6, P < 0.05; n = 867) in YKL-treated BMMΦ. Promoter-proximal peaks (−500 to +200 nt relative to the TSS) are highlighted in red. Labeled in blue are peaks found near promoters of representative paused inflammation-related genes (gene_name location relative_to_TSS). (D) The read density distribution is shown for the indicated genes. (E) BMMΦ were treated with YKL-5-124 or DMSO for 6 hours with or without LPS for the last 0.5 hours, as indicated; occupancy of TFIIE (left) and Pol II (middle) at the TSS of the indicated genes was analyzed by ChIP-qPCR (n = 3) as in (A). Data are shown as means ± SEM; data were analyzed by Student’s t test; *P < 0.05; **P < 0.01; ***P < 0.001.
Fig. 2.
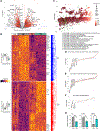
Fig. 2.. CDK7 inhibition in BMMΦ precludes LPS-mediated up-regulation of proinflammatory genes and down-regulation of homeostatic and anti-inflammatory genes.
(A) BMMΦ were pretreated with THZ1 or vehicle for 4 hours followed by incubation with LPS for 6 hours (Tnf and Il1a) or 12 hours (the rest), where indicated. Expression of proinflammatory (left) and anti-inflammatory (right) genes was assessed by RT-qPCR and presented as an FC over that in unstimulated MΦ. n = 3 to 7; data are shown as means ± SEM. Data were analyzed by Student’s t test; *P < 0.05; **P < 0.01; ***P < 0.001. (B) BMMΦ were treated with LPS for 6 hours after a 6-hour pretreatment with YKL-5-124 or vehicle, and gene expression was analyzed by RNA-seq (n = 3). A volcano plot shows genes up-regulated (right; logFC > 0.6, unadjusted P < 0.05, n = 1482) or down-regulated (left; n = 897) by YKL-5-124 pretreatment. Highlighted in blue are representative DEGs involved in pro- or anti-inflammatory functions. (C) Shown is a heatmap of mean-centered and row-scaled log-transformed expression values (in counts per million) for genes differentially expressed at 6 hours of LPS treatment ± YKL-5-124 pretreatment [as in (B)] across conditions: v, vehicle; L, LPS; Y, YKL-5-124; YL, LPS and YKL-5-124; with highlighted genes from (B) marked. Hierarchical clustering was performed using Euclidean distance and complete linkage clustering algorithm. Violin plots show cluster-wide distribution of z-score–transformed gene expression stratified by treatment. (D) QuSAGE of YKL-5-124–up-regulated or YKL-5-124–down-regulated pathways (unadjusted P < 0.05, n = 38 each) from (B) ranked by logFC with the size of the circle proportional to the number of genes in the pathway and color coded according to P value. Representative inflammation-related pathways are highlighted. (E and F) Examples of down-regulated (E) or up-regulated (F) pathways from (D); means ± SD of expression of individual pathway-defining genes are shown.
Fig. 3.
Fig. 3.. CDK7 inhibition attenuates the Pol II transcription cycle of hMΦ at baseline and after inflammatory polarization.
(A) hMΦ were treated with THZ1 or YKL-5-124, and NELF-E occupancy at the TSS of the indicated paused genes was assessed by ChIP-qPCR with the average signal with nonspecific IgG as background and the signal in DMSO-treated hMΦ set to 1 (n = 3 or 4). Data are shown as means ± SEM; data were analyzed by Student’s t test; ****P < 0.0001. (B and C) NELF-E ChIP-seq was performed in hMΦ treated with THZ1, YKL-5-124, or DMSO for 3 hours. (B) Shown is a volcano plot for filtered NELF-E peaks up-regulated (right) or down-regulated (left) by YKL-5-124 with promoter-proximal peaks shown in red (n = 4; logFC > 0.6, FDR < 0.05). Highlighted are peaks associated with the TSS of representative paused genes. Inset shows the % and number of peaks significantly down-regulated (FDR < 0.05) by YKL-5-124 stratified by genomic location. (C) Read density distribution for the indicated genes is shown. (D to F) hMΦ were treated ± YKL-5-124 for 5 hours or polarized with TNF and IFN-γ for 24 hours with or without YKL-5-124 added for the last 5 hours of treatment. (D) Pol II and pS5 Pol II occupancy at the TSS of the indicated genes was analyzed by ChIP-qPCR as in (A) with the signal in DMSO-treated hMΦ set to 1 (n = 4 or 5). Data are shown as means ± SEM; data were analyzed by Student’s t test; *P < 0.05; **P < 0.01; ***P < 0.001; ****P < 0.0001; n.s., not significant. (E) Genome-wide Pol II and pS5 Pol II occupancy was evaluated by ChIP-seq and is plotted as heatmaps anchored on YKL-5-124–sensitive promoter-proximal NELF-E peaks (n = 476) from (B) with the average read density shown on top. (F) Read density distribution for the indicated genes is shown.
Fig. 4.
Fig. 4.. YKL-5-124 reverses the established inflammatory transcriptome in hMΦ.
(A) hMΦ were cultured with or without TNF + IFN-γ for 24 hours with YKL-5-124 added for the last 3 or 6 hours, as shown. The expression of the indicated genes was assessed by RT-qPCR and presented relative to that in untreated hMΦ (set at 1). n = 4; data are shown as means ± SEM and were analyzed by one-way analysis of variance (ANOVA) with Dunnett’s multiple comparisons test; **P < 0.01; ***P < 0.001; ****P < 0.0001. (B) hMΦ were cultured as in (A). RNA-seq shows DEGs up-regulated (right; n = 486) or down-regulated (left; n = 1822) by 6-hour YKL-5-124 treatment with representative inflammation-related genes highlighted (logFC > 0.6, unadjusted P < 0.05). (C) QuSAGE (unadjusted P < 0.05) of pathways from (B) up-regulated (top; n = 47) or down-regulated (bottom; n = 408) by YKL-5-124, plotted as described in Fig. 2D. (D) Examples of pathways from (C) with key DEGs highlighted; means ± SD of expression of individual pathway-defining genes are shown.
Fig. 5.
Fig. 5.. CDK7 inhibition alleviates acute and chronic progressive inflammatory arthritis in mice.
(A) After the induction of K/BxN-ST arthritis, mice were dosed daily with YKL-5-124 (10 mg/kg) or vehicle (Veh); n = 10 per group. The results of a locally estimated scatterplot smoothing (LOESS) regression show the relationship between ankle thickness changes or clinical scores and time (span = 0.75; degree = 2), stratified by treatments. Data from two independent experiments are pooled. The regression curves represent the center of the predictive values, and the ribbon bands indicate 95% confidence interval. (B to G) WT (gray) or hTNFtg mice dosed with THZ1 (10 mg/kg, teal) or Veh (red) three times per week starting at 8 weeks of age. Ankle thickness FC and clinical scores were measured three times per week. (B) The results of LOESS regression show the relationship between ankle thickness FC relative to the first measurement (= 1; left) or clinical scores (right) and time, stratified by treatments and analyzed as in (A) (n = 4). (C) Shown are 3D models of micro–computed tomography (μCT) top and side view images of lower limbs at 20 weeks of age with osteophytes (yellow arrows) and sites of bone erosion (teal arrows) indicated. (D) μCT images were quantified as ankle surface area/volume (1/mm) ratio (n = 3). (E) Representative images of H&E-stained sections of ankles at 20 weeks of age. Scale bars, 100 μm. Orange bars indicate tenosynovial hyperplasia; immune cell infiltration is marked by green arrows. [(F) and (G)] Synovial inflammation (F) and immune cell infiltration (G) scoring is shown as described in Materials and Methods. n = 6. Data in [(D), (F), and (G)] are shown as means ± SEM. Data were analyzed by one-way ANOVA with Šidák’s multiple comparisons test (D) or Student’s t test [(F) and (G)]; **P < 0.01; ***P < 0.001.
Fig. 6.
Fig. 6.. YKL-5-124 reduces inflammatory gene expression in synovial cells derived from patients with RA ex vivo.
Cell suspensions were prepared from synovial tissue samples collected from patients with RA, placed in culture, and treated with YKL-5-124 or DMSO for 3 (n = 4) or 6 (n = 8) hours. Total RNA was prepared and analyzed by RNA-seq. (A) The volcano plot shows DEGs up-regulated (right; logFC > 0.6, FDR < 0.05, n = 1008) or down-regulated (left; logFC < −0.6, FDR < 0.05, n = 932) by YKL-5-124 at 6 hours. Highlighted are representative DEGs involved in pro- or anti-inflammatory functions. (B) The heatmap shows mean-centered and row-scaled log-transformed expression values (in counts per million) for genes differentially expressed in (A) across conditions (v, vehicle; and Y, YKL-5-124 for 3 or 6 hours, as indicated) with genes highlighted in (A) marked. The heatmap was generated as in Fig. 2C with violin plots showing cluster-wide distribution of z-score–transformed gene expression stratified by treatment. (C) QuSAGE of up-regulated (top; unadjusted P < 0.05, n = 219) or down-regulated (n = 799) pathways at 6 hours of YKL-5-124 treatment. (D to F) Examples of down-regulated pathways with key genes highlighted. Pathways shown include chemokine receptors and chemokines (D), IFN-α/β signaling (E), and inflammasomes (F). Error bars, SD. (G) The effect of the 6-hour YKL-5-124 treatment on the expression of IL6 (n = 6), IL1B (n = 6), and MRC1 (n = 4) in synovial samples was validated by RT-qPCR; data are presented as means ± SEM and were analyzed by Student’s t test; *P < 0.05; **P < 0.001.

References

    1. Medzhitov R, Inflammation 2010: New adventures of an old flame. Cell 140, 771–776 (2010). - PubMed
    1. Nathan C, Ding A, Nonresolving inflammation. Cell 140, 871–882 (2010). - PubMed
    1. Myasoedova E, Crowson CS, Kremers HM, Therneau TM, Gabriel SE, Is the incidence of rheumatoid arthritis rising?: Results from Olmsted County, Minnesota, 1955–2007. Arthritis Rheum 62, 1576–1582 (2010). - PMC - PubMed
    1. Mikuls TR, Rheumatoid arthritis incidence: What goes down must go up? Arthritis Rheum 62, 1565–1567 (2010). - PubMed
    1. Kennedy A, Fearon U, Veale DJ, Godson C, Macrophages in synovial inflammation. Front. Immunol 2, 52 (2011). - PMC - PubMed

Publication types

MeSH terms