. 2024 Dec:78:103427.
doi: 10.1016/j.redox.2024.103427. Epub 2024 Nov 12.

Fluorescent gold nanoclusters possess multiple actions against atherosclerosis

Affiliations

Fluorescent gold nanoclusters possess multiple actions against atherosclerosis

Yi-Nan Lee et al. Redox Biol. 2024 Dec.

Abstract

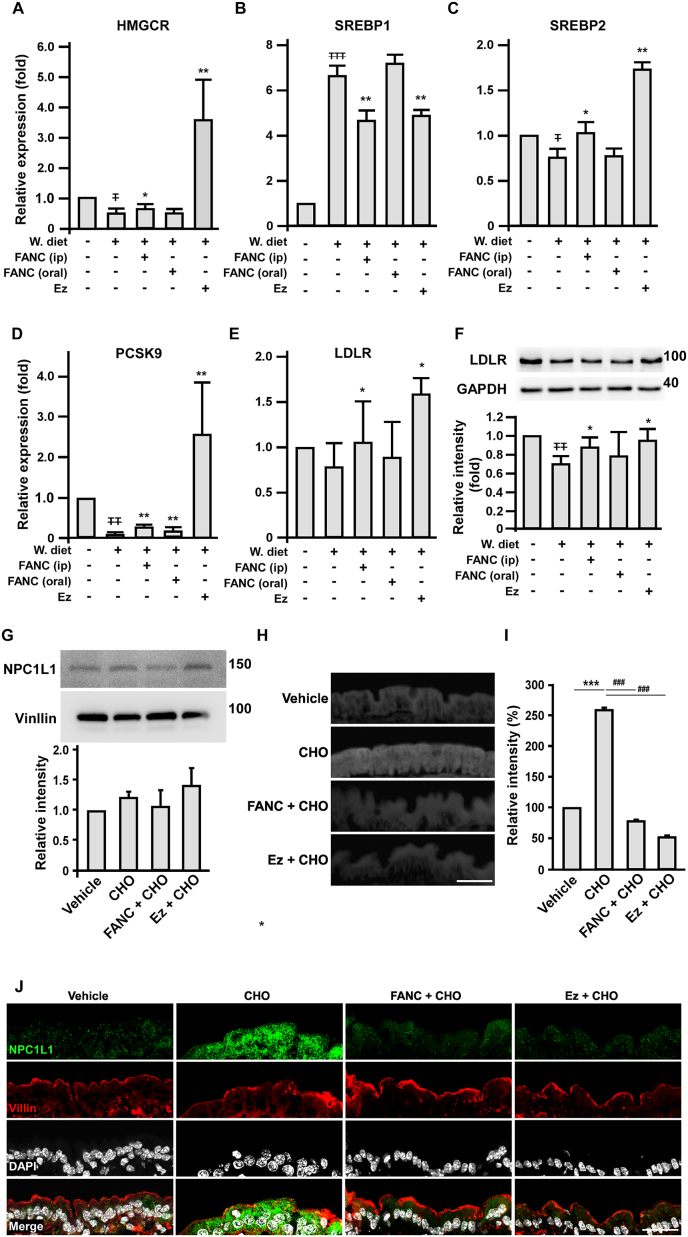
Atherosclerosis caused major morbidity and mortality worldwide. Molecules possessing lipid-lowering and/or anti-inflammatory properties are potential druggable targets against atherosclerosis. We examined the anti-atherosclerotic effects of fluorescent gold nanoclusters (FANC), which were dihydrolipoic acid (DHLA)-capped 2-nm gold nanoparticles. We evaluated the 8-week effects of FANC in Western-type diet-fed ApoE-deficient mice by either continuous intraperitoneal delivery (20 μM, 50 μl weekly) or via drinking water (300 nM). FANC reduced aortic atheroma burden, serum total cholesterol, and oxidative stress markers malondialdehyde and 4-hydroxynonenal levels. FANC attenuated hepatic lipid deposit, with changed expression of lipid homeostasis-related genes HMGCR, SREBP, PCSK9, and LDLR in a pattern similar to mice treated with ezetimibe. FANC also inhibited intestinal cholesterol absorption, resembling the action of ezetimibe. The lipid-lowering and anti-atherosclerotic effects of FANC reappeared in Western-type diet-fed LDLr-deficient mice. FANC bound insulin receptor β (IRβ) via DHLA, leading to AKT activation. However, unlike insulin, which also bound IRβ to activate AKT to induce HO-1, activation of AKT by FANC was independent of HO-1 expression in human aortic endothelial cells (HAECs). Alternatively, FANC up-regulated NRF2, interfered the binding of KEAP1 to NRF2, and promoted KEAP1 degradation to free NRF2 for nuclear entry to induce HO-1 that suppressed the expression of ICAM-1 and VCAM-1. Consistently, FANC suppressed ox-LDL-induced enhanced attachment of THP-derived macrophages onto HAECs. In macrophages, FANC up-regulated ABCA1, and reversed ox-LDL-induced suppression of cholesterol efflux. FANC effected in vitro at nano moles. In conclusion, our findings showed novel actions and multiple mechanisms of FANC worked coherently against atherosclerosis.

Keywords: Anti-inflammation; Cholesterol-lowering; KEAP1; Nanomole; Plaque burden.


Conflict of interest statement

Declaration of competing interest The authors declare that they have no known competing financial interests or personal relationships that could have appeared to influence the work reported in this paper.

Figures

Fig. 1
Fig. 1
Effects of FANC on atherosclerotic lesions and serum total cholesterol in ApoE-deficient mice fed different diets (A) Arterial trees of wild type (Wt) and ApoE-deficient (ApoE-/-) mice treated with PBS or FANC (20 μM) intraperitoneally via osmotic minipumps at a constant rate (0.25 μl/h) and fed chow or Western-type diet (W. diet) for 8 weeks were stained with Sudan-IV (red) to show atherosclerotic lesions. n = 5 for Wt and n = 6 for each ApoE-/- mice group (i.e. n = 6, 6, 6, 6 for chow, FANC, W. diet, W. diet + FANC, respectively). Scale bar, 0.5 cm. (B) Quantification of atherosclerotic lesion area in arterial trees. (C) Effects of FANC on W. diet-induced hypercholesterolemia. Sera were collected at the end of experiment. ∗, p<0.05; ∗∗, p<0.01. (For interpretation of the references to colour in this figure legend, the reader is referred to the Web version of this article.)
Fig. 2
Fig. 2
Comparison of FANC administration routes on Western-type diet-induced atherosclerotic lesions and lipid profile changes in ApoE-deficient mice ApoE-deficient (ApoE-/-) mice concomitantly fed Western-type diet (W. diet) and treated with FANC intraperitoneally (FANC (ip)) or orally (FANC (oral) for 8 weeks were compared. Mice treated with Ezetimibe (Ez, 0.005%, w/w) were used as control. (A) Aortic sinuses were sectioned and stained with oil-red O. The signal appearing in plaque areas were measured and quantified. Representative images were sections from 3 aorta roots of each group (n = 3, 3, 3, 3, 3 of chow, W. diet, W. diet + FANC (ip), W. diet + FANC (oral), W. diet + Ez), Scale bar, 500 μm. (B) to (E) Effects of different FANC administration routes on W. diet-induced lipid profile changes. Sera were collected at the end of experiments. n = 7 for chow-fed mice, n = 9 for W. diet-fed animals, n =11 for FANC (ip), n = 9 for FANC (oral) and n = 10 for Ez group. , compared with chow diet; ∗, compared with W. diet; and ∗, p<0.05; ∗∗, p<0.01; ∓∓∓ and ∗∗∗, p<0.001. (For interpretation of the references to colour in this figure legend, the reader is referred to the Web version of this article).
Fig. 3
Fig. 3
Effects of FANC on cholesterol homeostasis-related genes and proteins in hypercholesterolemic mice and on intestinal cholesterol absorption in wild-type mice (A) to (E), Quantitative PCR (qPCR) of relative expression of HMGCR, SREBP1, SREBP2, PCSK9 and LDLR in livers of Western-type diet fed ApoE deficient mice with indicated treatments. n = 7 for chow-fed mice, n = 9 for W. diet-fed animals, n =11 for FANC (ip), n = 9 for FANC (oral) and n = 10 for Ez group. (F) Western blot analysis of LDLR protein from liver extracts. Values are mean ± SD of triplicate assays from 3 independent experiments. , compared with chow diet; ∗, compared with W. diet; and ∗, p<0.05; ∓∓ and ∗∗, p<0.01; ∓∓∓, p<0.001. (G) NPC1L1 protein expression and (H) sections of intestine from FANC or Ezetimibe pretreated wild-type mice at 1 h post cholesterol feeding and stained with filipin to detect cholesterol absorption. Six mice were assigned for each group. Scale bar, 50 μm. (I) Quantification of intestinal filipin staining. n=3. (J) Effects of FANC and Ezetimibe on cholesterol-mediated NPC1L1 distribution subjacent to brush border. Tissue sections were treated with antibodies against NPC1L1 (green) and Villin (red) to mark brush border, and with DAPI (gray) for nuclei staining. n=3 for each group. CHO, cholesterol. ∗, compared with vehicle; #, compared with CHO group; ∗∗∗ and ###, p<0.001. (For interpretation of the references to colour in this figure legend, the reader is referred to the Web version of this article.)
Fig. 4
Fig. 4
FANC activate NRF2-mediated HO-1 and NQO-1 expression (A) Activation of NRF2 (green labels) by FANC. HAECs were treated with indicated concentration of FANC (nM), DHLA (μM) or tBHQ (μM) for 6 h. Cells were stained with anti-NRF2 antibodies and DAPI for nuclear staining (red labels). Scale bar, 50 μm. (B) and (C) ML-385 inhibited FANC-induced HO-1 and NQO-1 transcription. HAECs and macrophages were treated with ML-385 (10 μM) for 1 h and then FANC for 4 h followed by qPCR analysis. (D) FANC induced HO-1 expression. HAECs were treated with FANC (100 nM) for 1 and 16 h followed by Western blot assay. Values are mean ± SD of triplicate assays from 3 independent experiments. ∗ and #, p<0.05; ∗∗, p<0.01; ∗∗∗ and ###, p<0.001. (For interpretation of the references to colour in this figure legend, the reader is referred to the Web version of this article.)
Fig. 5
Fig. 5
FANC promote KEAP1 degradation and release from NRF2 immunocomplexes (A) Effects of FANC on KEAP1 stability. HAECs were treated with indicated concentrations of FANC or tBHQ (50 μM) in the presence of cycloheximide (CHX, 100 μg/ml). Cells were harvested at the indicated time points and immunoblots were probed with anti-KEAP1 antibodies. (B) Quantification of relative level of KEAP1. Band intensities of KEAP1 at various time points were quantified and normalized to those without CHX treatment (set as 100% at t0). (C) FANC promoted KEAP1 eluted from NRF2 immunocomplexes in a dose-dependent manner. NRF2 immunocomplexes were incubated with indicated concentrations (nM) of FANC. Proteins either in immunocomplexes (beads) or in supernatants (Sup.) were identified by anti-NRF2 and anti-KEAP1 antibodies, respectively. (D) Determination the interaction between FANC and KEAP1 by tandem immunoprecipitation. At the first run of immunoprecipitation, NRF2 was pulled down by anti-NRF2 antibodies and eluted by FANC or Flag-tagged FANC (FANC-FLAG). Equal amount of NRF2 were left in beads (upper panel). At the second run of immunoprecipitation, FANC or FANC-FLAG eluates were either pulled down by control IgG (Ctrl IgG), anti-FLAG antibodies (α-FLAG ab) or anti-DHLA antibodies (α-DHLA ab). The immunoblot was probed with anti-KEAP1 antibodies (middle panel). Lower panel, the duplicated immunoblot as middle panel was probed with anti-ubiquitin (UBi) antibodies. Consistent results were obtained from three independent experiments. (E) Scheme explains thioesterification occurred between KEAP1 and FANC (i), while the reaction was blocked by FLAG-tagged FANC (ii).
Fig. 6
Fig. 6
Effects of FANC and insulin on AKT activation and pro-inflammatory adhesion molecule expression in human aortic endothelial cells (A) Dot blot assay to determine the binding of FANC to IRβ. Immunoprecipitated anti-IRβ and control IgG were incubated with indicated concentrations (nM) of FANC. The pull-down FANC were detected by anti-DHLA antibodies. Lower panel, quantification of relative chemiluminescence from three independent experiments. ∗, p<0.05 compared to the leftmost bar. (B) Effects of FANC and DHLA on AKT activation. HAECs were respectively treated with 100 nM of FANC and 8 μM of DHLA for 30 min. Activation of AKT was determined and quantified by the ratio of p-AKT/AKT. ∗∗, p<0.01 compared with control. ##, p<0.01 compared with FANC group. (C) Effects of IRβ depletion on FANC and DHLA-mediated AKT activation. HAECs were transfected with nonsense (NS) or IRβ silencing RNA (siIRβ) for 16 h. Cells were treated with FANC or DHLA for 2 h and harvested to assay the expression of IR-β and AKT activation. UT, untreated cells. ∗, compared with UT; #, compared with FANC group. ∗ and #, p<0.05; ∗∗∗ and ###, p<0.001. (D) Activation kinetics of AKT under insulin, DHLA, and FANC treatment. HAECs were treated with insulin (100 nM), DHLA (8 μM) or FANC (100 nM) to determine the ratio of p-AKT/AKT. ∗, compared with t0, #, compared with t15, T, compared with t60, ∗∗ and TT, p<0.01. ∗∗∗, ### and TTT, p<0.001. (E) Effects of MK2206 on FANC and insulin-mediated AKT activation and HO-1 induction. HAECs were pretreated with MK2206 (1 μM) for 16 h. Lysates were harvested after 15 min of FANC or insulin treatments to determine AKT activation. For HO-1 induction, cells were collected after 6 h of FANC or insulin treatment. ∗, compared with UT; #, compared with FANC group. ∗∗ and ##, p<0.01.∗∗∗, p<0.001. (F) Effects of HO-1 depletion on FANC-mediated ICAM-1 and VCAM-1 expression. HAECs were transfected with HO-1 silencing RNA (siHO-1) for 16 h, followed by treatment with 100 nM FANC for 16 h. Cells were harvested to assay the expression of HO-1, ICAM-1 and VCAM-1. Values are mean ± SD of triplicate assays from 3 independent experiments. ∗, compared with UT; #, compared with FANC only group. ∗and #, p<0.05; ∗∗ and ##, p<0.01.
Fig. 7
Fig. 7
Effects of FANC on macrophage ABCA1 expression, cholesterol efflux, and ox-LDL-induced adhesion onto endothelial cells plus endothelial pro-inflammatiory adhesion molecule expression (A) FANC enhanced ABCA1 expression in THP-1-derived macrophages. Cells were incubated with indicated concentrations (nM) of FANC or tBHQ (100 nM) for 16 h. Compared with leftmost bar, ∗, p<0.05; ∗∗, p<0.01. (B) FANC enhanced cholesterol efflux. THP-1-derived macrophages were treated with FANC (100 nM) and ox-LDL (100 μg/ml) for 16 h. The fluorescence intensity of the medium and cell lysates was detected by fluorometry. ∗, p<0.05 (C) FANC attenuated ox-LDL-induced pro-inflammatory adhesion molecule expression. HAECs were pretreated with 100 nM of FANC or MK2206 (1 μM) for 24 h followed by treatment with 100 μg/ml of ox-LDL for 16 h ∗ and #, compared with UT; , compared with ox-LDL only group. ∗∗, ## and ∓∓, p<0.01; ∗∗∗, p<0.001. (D) FANC inhibited ox-LDL-induced macrophage adhesion onto HAECs. HAECs were pretreated with 100 nM FANC for 24 h, followed by treatment with 100 μg/ml of ox-LDL for 16 h. THP-1 derived macrophages were loaded with Calcein-AM (1 μM, green) and incubated with HAECs to perform adhesion assay. (E) Analysis of attached macrophage number on HAECs. ∗∗, p<0.01; ∗∗∗, p<0.001. Values are mean ± SD of triplicate assays from 3 independent experiments. (For interpretation of the references to colour in this figure legend, the reader is referred to the Web version of this article.)

References

    1. Makover M.E., Shapiro M.D., Toth P.P. There is urgent need to treat atherosclerotic cardiovascular disease risk earlier, more intensively, and with greater precision: a review of current practice and recommendations for improved effectiveness. Am J Prev Cardiol. 2022;12 - PMC - PubMed
    1. Geovanini G.R., Libby P. Atherosclerosis and inflammation: overview and updates. Clin. Sci. (Lond.) 2018;132(12):1243. - PubMed
    1. Taleb S. Inflammation in atherosclerosis. Arch Cardiovasc Dis. 2016;109(12):708. - PubMed
    1. Piani F., et al. Diagnostic and prognostic role of CD93 in cardiovascular disease: a systematic review. Biomolecules. 2023;13(6):910. - PMC - PubMed
    1. Borén J., Williams K.J. The central role of arterial retention of cholesterol-rich apolipoprotein-B-containing lipoproteins in the pathogenesis of atherosclerosis: a triumph of simplicity. Curr. Opin. Lipidol. 2016;27(5):473. - PubMed

Publication types

LinkOut - more resources