. 2024 Nov 19;5(11):101829.
doi: 10.1016/j.xcrm.2024.101829.

Sepsis pathogenesis and outcome are shaped by the balance between the transcriptional states of systemic inflammation and antimicrobial response

Affiliations

Sepsis pathogenesis and outcome are shaped by the balance between the transcriptional states of systemic inflammation and antimicrobial response

Rachel Brandes-Leibovitz et al. Cell Rep Med. .

Abstract

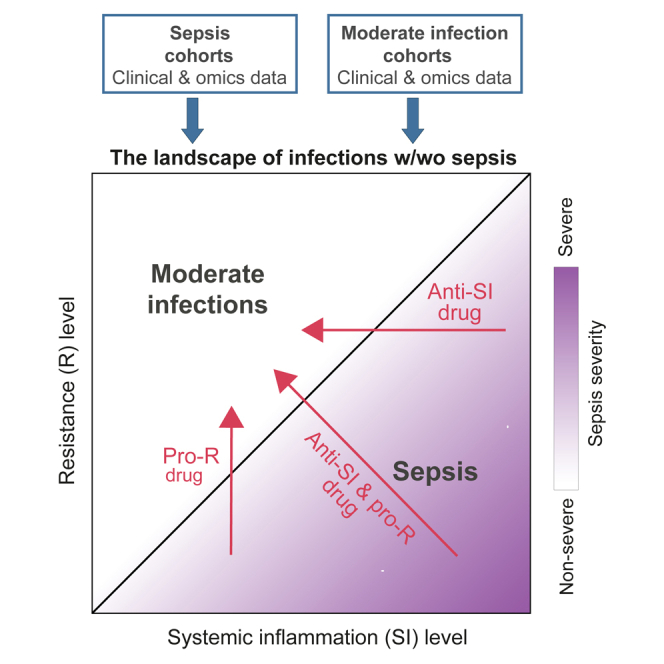
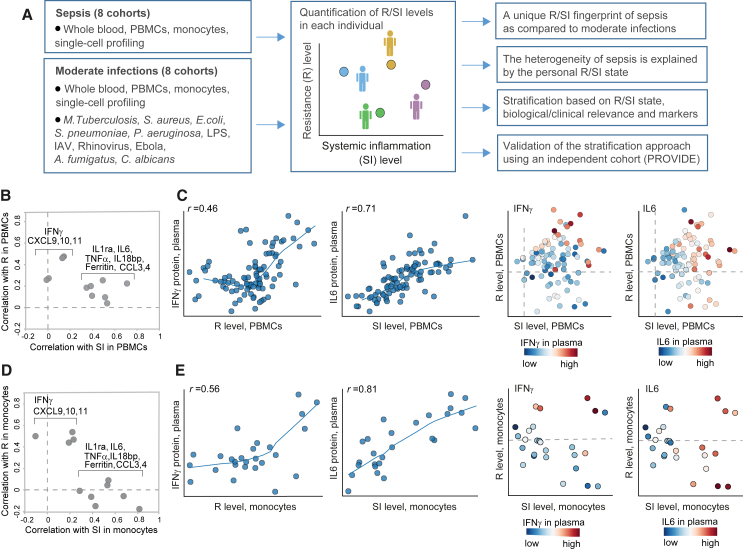
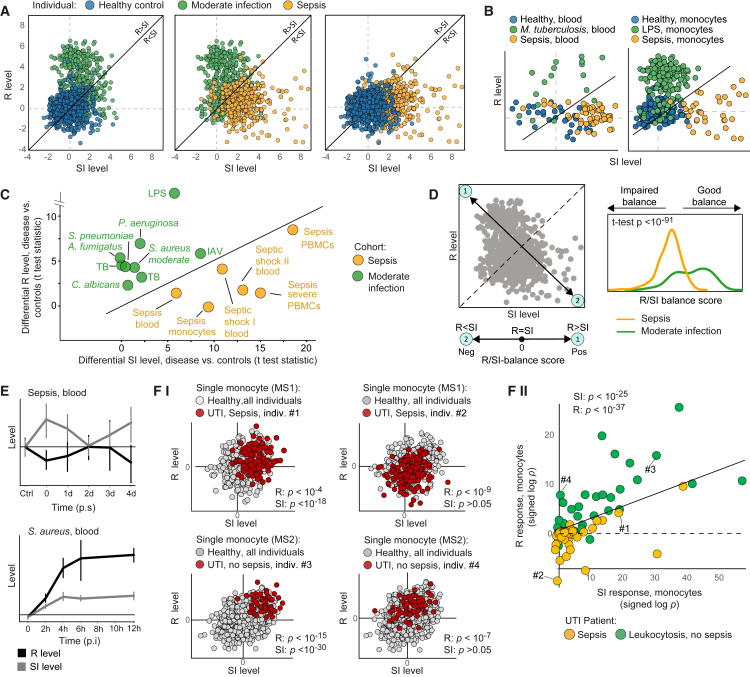
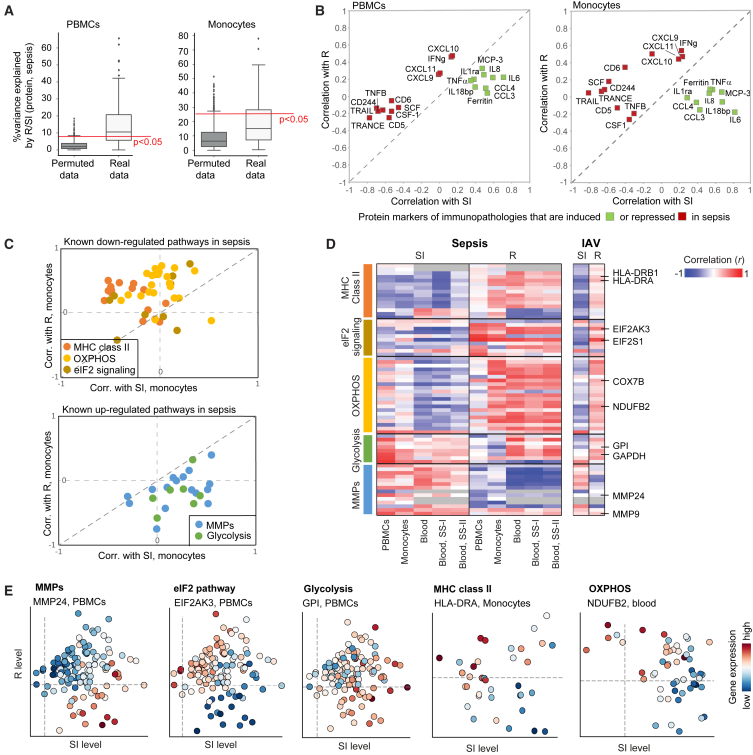
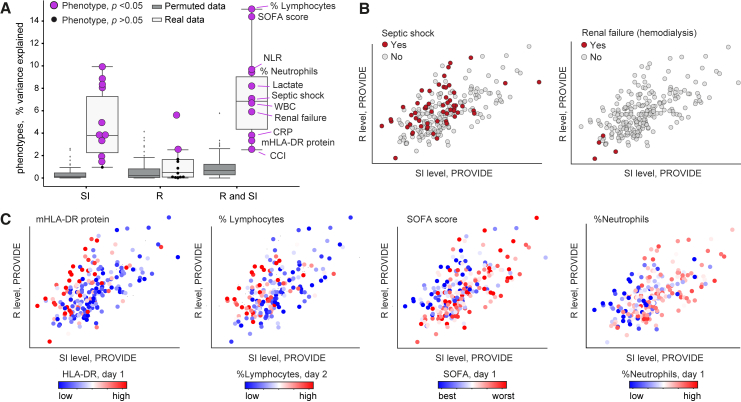
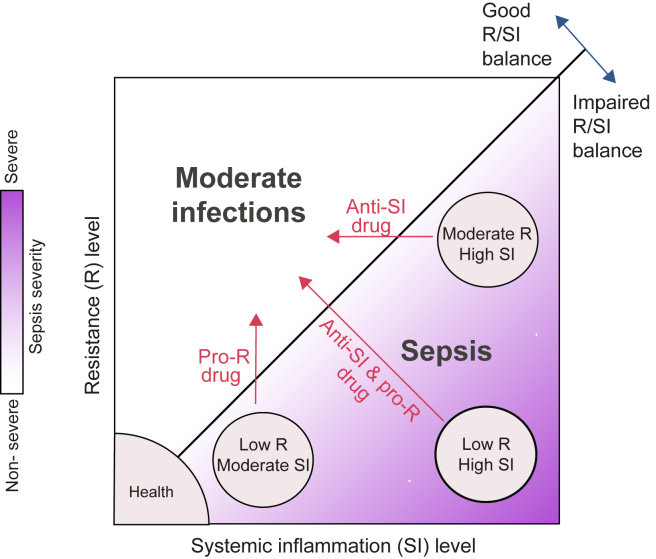
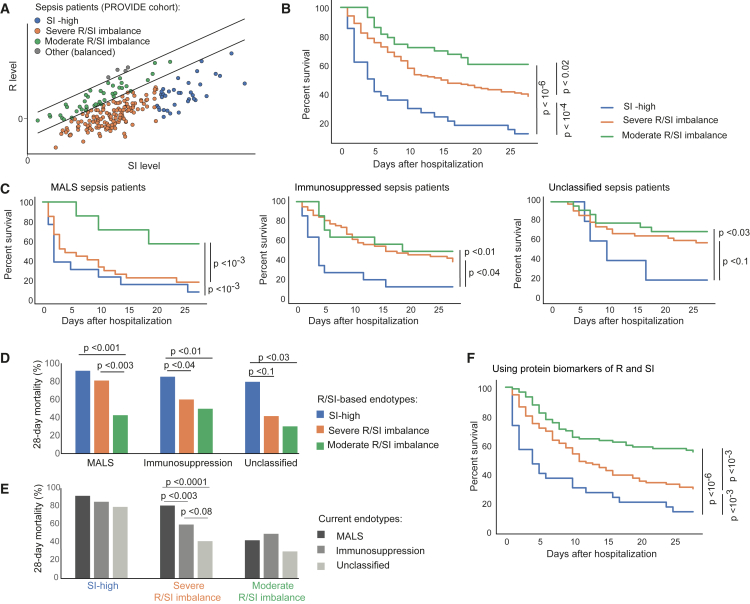
Patients with sepsis differ in their clinical presentations and immune dysregulation in response to infection, but the fundamental processes that determine this heterogeneity remain elusive. Here, we aim to understand which types of immune dysregulation characterize patients with sepsis. To that end, we investigate sepsis pathogenesis in the context of two transcriptional states: one represents the immune response to eliminate pathogens (resistance, R) and the other is associated with systemic inflammation (SI). We find that patients with sepsis share a molecular fingerprint of a low R-to-SI balance-i.e., a low R relative to the level of SI. Differences between patients with sepsis are explained by the wide diversity of R and SI states that fall under this fingerprint, such as patients with high SI, patients with low R, or both. We show how this R/SI framework can be used to guide patient stratification that is relevant to disease prognosis and management, outperforming existing classifications of sepsis.

Keywords: immune response; immunotheraphy; infection; patient stratification; personalized medicine; precision medicine; sepsis; septic shock; systemic inflammation.


Conflict of interest statement

Declaration of interests Tel Aviv University has filed a patent application on markers of resistance and systemic inflammation and uses thereof with I.G.-V., R.B.-L., G.Y., M.G.N., and E.J.G.-B. as inventors (PCT/IL2024/050850), which has been filed in the Israel PCT Receiving Office.

Figures

None
Graphical abstract
Figure 1
Figure 1
Global transcriptional states of systemic inflammation and resistance in patients with sepsis (A) Schematic of methodology: integrative analysis of sepsis and moderate infections, including the PBMCs/monocytes data from the FUSE cohort. Personal levels of resistance (R) and systemic inflammation (SI) were calculated for each subject. (B) R and SI are associated with two distinct inflammatory states in sepsis. The scatterplot compares, for each protein (a dot), its correlation with SI levels (x axis) and its correlation with R levels (y axis). Correlations (r) were calculated across patients with sepsis from the FUSE cohort; R and SI levels were calculated using expression profiles in PBMCs. Included are selected pro-inflammatory plasma protein markers. IL-6 and IFNγ are exemplified in C. Findings are consistent with previous studies (Figure S1F). (C) Associations of the plasma IFNγ and IL-6 proteins with R and SI levels in PBMCs of patients with sepsis. Left: scatterplots for R or SI levels (x axis) against protein abundance (y axis) across individuals with sepsis (dots). Right: scatterplot for the SI and R levels (x and y axis, respectively) of each patient with sepsis (a dot), where each patient is colored by its plasma level of a certain protein (indicated on top). R and SI levels were calculated using the expression profiles in PBMCs from the FUSE cohort. (D and E) Validation in monocytes. Plots D and E are shown as in plots B and C, respectively, but for R/SI levels that were calculated using expression profiles of blood-derived monocytes (rather than PBMCs). Data of patients with sepsis from the FUSE cohort. Related to Figure S1.
Figure 2
Figure 2
Sepsis is marked by a dysbalanced cell state of low R relative to the SI level In (A)–(D), data from multiple independent cohorts of either blood, PBMCs, or monocyte profiling (datasets #1–#10 in STAR Methods). (A and B) The levels of SI (x axis) and R (y axis) across individuals (dots) from all cohorts (A) or specific cohorts (B). (C) Differential R and SI levels (disease versus controls, standard t test statistics) across cohorts (dots). Abbreviations: TB, M. tuberculosis. (D) The “R/SI-balance score” is a biomarker of sepsis. Left: the R/SI-balance score is defined as R minus SI—that is, the score is decreasing along the top-left-to-bottom-right diagonal, where positive and negative scores indicate R > SI and R < SI, respectively. Right: the distributions of individuals by their R/SI-balance scores, revealing lower balance scores in sepsis (an “impaired” R/SI balance) compared to moderate infections (a “good” R/SI balance). (E) R and SI levels across time points during infection. Included are time-series dataset (datasets #12 and #13 in STAR Methods). Error bars: 95% confidence intervals. p.i., post infection; p.s., post symptoms. Related to Figure S2. (F) R and SI responses to uronary tract infection (UTI) at single-cell resolution (dataset #17 in STAR Methods). (F–I) For each single monocyte (a dot), the plot presents its R and SI levels; each plot presents specific monocyte subpopulation (MS1 or MS2) for all controls (gray) or one patient (red). Presented are p values (t test) for the bias in single-cell R/SI levels in one patient versus all controls (for a given monocyte subpopulation). These p values (log10-scaled and signed by direction) are referred to as the R (or SI) response. (F-II) Each dot provides the R and SI responses for a single patient and a certain monocyte subpopulation. R/SI responses of individuals #1–#4 (indicated in plot F-II) are exemplified in plot F–I. Patients with sepsis (yellow) and moderate infection (green) UTI are included. p values (indicated on top) are detailed in Figure S3.
Figure 3
Figure 3
The heterogeneity of genes and plasma proteins in sepsis is associated with the impaired R/SI state Phenotypic variation in sepsis, either in plasma protein concentrations (A and B) or in PBMCs/monocytes mRNA levels (C–E), is associated with the low R and high SI cell state. Measurements of monocytes and PBMCs are from the FUSE dataset. (A) Boxplots for the percentage of inter-individual variance in proteins that is explained by a linear combination of R and SI, using either real (white) or permuted (gray) data. R/SI levels were calculated either using transcriptomes from PBMCs (left) or monocytes (right). (B) Protein markers of immunopathology in sepsis are associated with the impaired R/SI balance. The scatterplot compares, for each protein marker of immunopathology (a dot), its correlation with SI levels (x axis) and R levels (y axis) across patients with sepsis. R and SI levels were calculated using expression profiles in either PBMCs (left) or monocytes (right). Included are markers for immune dysfunctions that have a known up- or down-regulation in sepsis (color coded). (C–E) Analysis of previously reported pathways that are up- or down-regulated in sepsis. (C) The scatterplots compare, for the expression of each gene (a dot), its correlation with SI levels (x axis) and R levels (y axis). Correlations were calculated using data in monocytes across patients with sepsis. (D) Shown are correlations (color-coded) between each gene (a row) and the SI or R levels (columns), calculated based on transcriptomes in each cohort (columns; datasets #1–#5 in STAR Methods). Abbreviations: SS-I/II, septic shock I and II. (E) Examples of selected genes from D, as shown in Figures 1C and 1E. Genes are indicated on top. Related to Figure S4.
Figure 4
Figure 4
The heterogeneity of clinical parameters within sepsis is associated with the impaired R/SI cell state Data are shown for several physiological phenotypes across the PROVIDE clinical trial: SOFA scores in day 1 of hospitalization, quantity of the mHLA-DR protein in day 1 of hospitalization, the percentage of circulatory lymphocytes in day 2 of hospitalization, as well as septic shock, CCI, percentage of neutrophils, NLR, WBCs, lactate, CRP, and renal failure in day 1 of hospitalization. (A) Boxplots for the percentages of inter-individual variance in phenotypes that are explained by either SI (left), R (middle), or the linear combination of R and SI (right), using either real (white) and permuted (gray) data. Each phenotype (a dot) is colored by purple/black for a significant/insignificant (empirical p < 0.05) percentage of explained variation. (B and C) Scatterplots for SI and R levels (x and y axis, respectively) of each patient with sepsis (a dot), where each patient is colored by its level of a certain clinical parameter (indicated on top). The plots demonstrate the utility of the R and SI levels as biomarkers for the pathophysiology of sepsis. Related to Figure S5.
Figure 5
Figure 5
A model of sepsis based on the molecular states of R and SI The molecular state of a low R-to-SI balance is a fingerprint of sepsis, as opposed to infections of moderate severity. The heterogeneity in sepsis is explained by the wide diversity of R/SI levels that fall under the broad fingerprint of sepsis (e.g., patients with high SI, patients of severe R/SI imbalance). The model suggests that each patient with sepsis should be treated either with a pro-R drug, an anti-SI drug, or both.
Figure 6
Figure 6
Stratification of patients with sepsis based on their R/SI cell states Analysis of patients with sepsis from the PROVIDE clinical trial. (A) Three R/SI-based endotypes are indicated. The prognostic capacity of these endotypes is demonstrated in (B)–(F). (B) The prognostic capacity of the R/SI-based endotypes. Kaplan-Meier survival curves for the endotypes (color coded). (C–E) The R/SI-based classification adds prognostic information beyond the current classification. (C) Prognostic capacity of the R/SI-based endotypes within previously defined immune states.,, Presented are Kaplan-Meier survival curves for the R/SI-based endotypes. Plots are shown as in B but each plot shows the survival curve within one previously defined endotype (indicated on top). (D) The percentage of 28-day mortality of each R/SI-based endotype (color coded) within previously defined subset of patients (x axis). (E) The percentage of 28-day mortality of each previously defined subset (color coded) within each of the R/SI-based endotypes (x axis). (F) 28-day prognostic capacity of the R/SI-based endotypes when using biomarkers of R and SI. Results are calculated and presented as in B (for the same individuals and endotypes), except from R and SI that were assessed using biomarkers: averaging CXCL11 and IFNγ plasma protein levels for R, and averaging IL-6 and IL-8 plasma protein levels for SI. In B–F, comparison p values were calculated using the log rank test and insignificant results (p > 0.1) were excluded for simplicity. Related to Figure S5.

References

    1. Singer M., Deutschman C.S., Seymour C.W., Shankar-Hari M., Annane D., Bauer M., Bellomo R., Bernard G.R., Chiche J.-D., Coopersmith C.M., et al. The Third International Consensus Definitions for Sepsis and Septic Shock (Sepsis-3) JAMA. 2016;315:801–810. - PMC - PubMed
    1. Rudd K.E., Johnson S.C., Agesa K.M., Shackelford K.A., Tsoi D., Kievlan D.R., Colombara D.V., Ikuta K.S., Kissoon N., Finfer S., et al. Global, regional, and national sepsis incidence and mortality, 1990-2017: analysis for the Global Burden of Disease Study. Lancet. 2020;395:200–211. - PMC - PubMed
    1. van der Poll T., van de Veerdonk F.L., Scicluna B.P., Netea M.G. The immunopathology of sepsis and potential therapeutic targets. Nat. Rev. Immunol. 2017;17:407–420. - PubMed
    1. Kyriazopoulou E., Leventogiannis K., Norrby-Teglund A., Dimopoulos G., Pantazi A., Orfanos S.E., Rovina N., Tsangaris I., Gkavogianni T., Botsa E., et al. Macrophage activation-like syndrome: an immunological entity associated with rapid progression to death in sepsis. BMC Med. 2017;15:172. - PMC - PubMed
    1. Boomer J.S., To K., Chang K.C., Takasu O., Osborne D.F., Walton A.H., Bricker T.L., Jarman S.D., Kreisel D., Krupnick A.S., et al. Immunosuppression in patients who die of sepsis and multiple organ failure. JAMA. 2011;306:2594–2605. - PMC - PubMed