. 2024 Nov 19;5(11):101827.
doi: 10.1016/j.xcrm.2024.101827.

Solid tumor immunotherapy using NKG2D-based adaptor CAR T cells

Affiliations

Solid tumor immunotherapy using NKG2D-based adaptor CAR T cells

Jana Obajdin et al. Cell Rep Med. .

Abstract

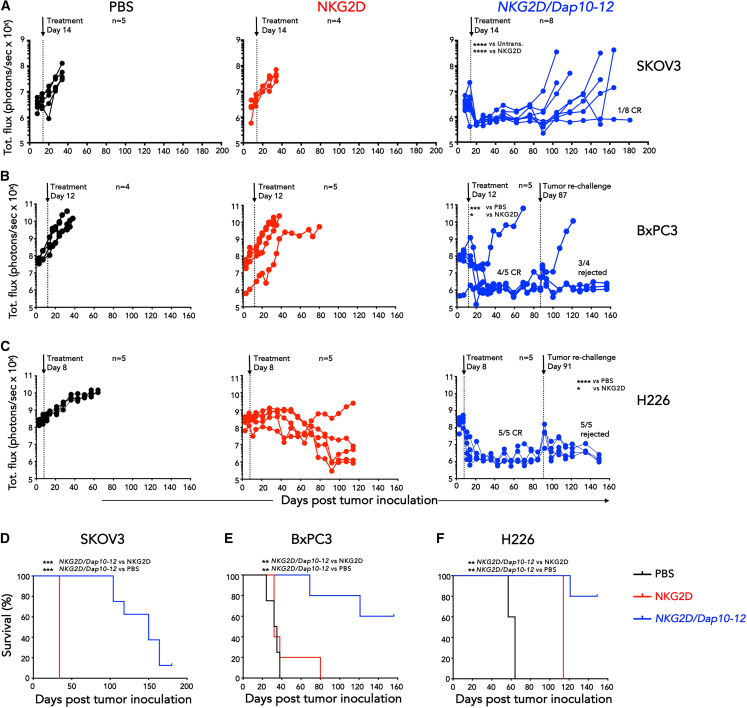
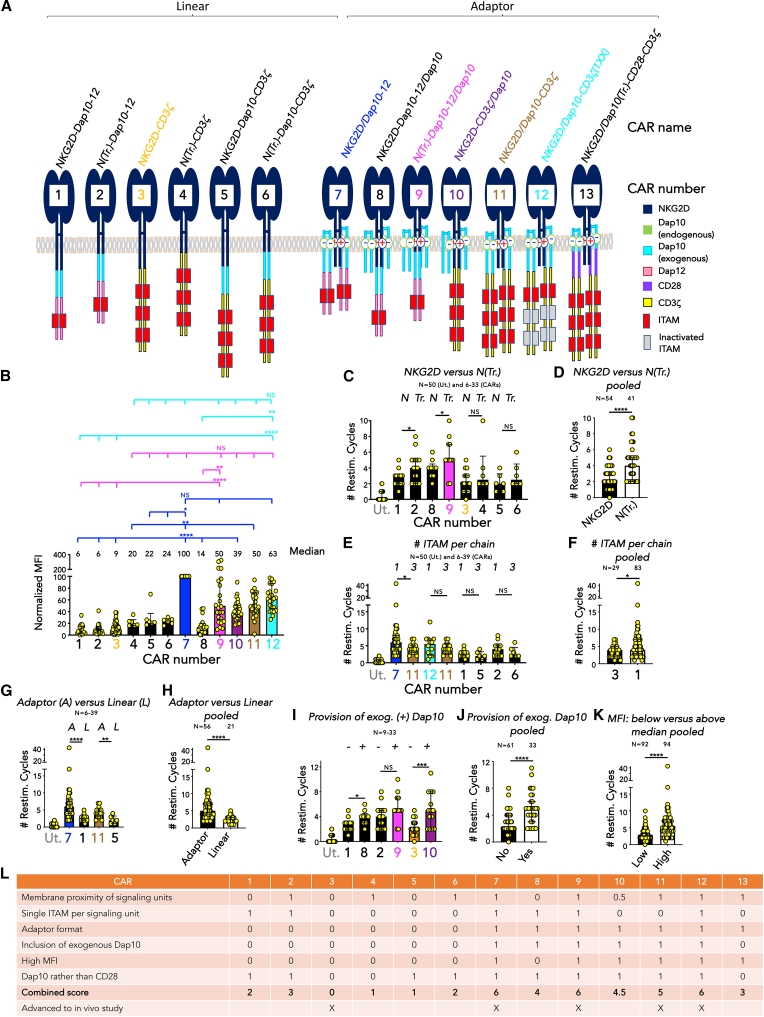
NKG2D ligands (NKG2DLs) are broadly expressed in cancer. To target these, we describe an adaptor chimeric antigen receptor (CAR) termed NKG2D/Dap10-12. Herein, T cells are engineered to co-express NKG2D with a fusion protein that comprises Dap10 joined to a Dap12 endodomain. NKG2D/Dap10-12 T cells elicit compelling efficacy, eradicating or controlling NKG2DL-expressing tumors in several established xenograft models. Importantly, durable responses, long-term survival, and rejection of tumor re-challenge are reproducibly achieved. Efficacy is markedly superior to a clinical stage CAR analog, comprising an NKG2D-CD3ζ fusion. Structure-function analysis using an extended CAR panel demonstrates that potency is dependent on membrane proximity of signaling units, high NKG2D cell surface expression, adaptor structure, provision of exogenous Dap10, and inclusion of one rather than three immune tyrosine activation motifs per signaling unit. Potent therapeutic impact of NKG2D/Dap10-12 T cells is also underpinned by enhanced oxidative phosphorylation, reduced senescence, and transcriptomic re-programming for increased ribosomal biogenesis.

Keywords: Dap10; Dap12; NKG2D; adaptor; chimeric antigen receptor.


Conflict of interest statement

Declaration of interests J.M. is CSO, scientific founder, and shareholder of Leucid Bio. M.G., F.K., C.M.H., R.M., C.B., C.T., and D.M.D. are employees of Leucid Bio while P.D. is a former Leucid Bio employee. D.L.-Y. is undertaking a PhD studentship funded by Leucid Bio and has acted as a consultant for Leucid Bio. J.M., D.M.D., D.L.-Y., and F.K. are co-inventors on patent filings in relation to adaptor CAR technology.

Figures

None
Graphical abstract
Figure 1
Figure 1
In vitro characterization of NKG2D/Dap10-12 CAR T cells (A) Structure of NKG2D/Dap10-12 CAR, making comparison with the NKG2D/Dap10 complex. NKG2D encoded by the NKG2D/Dap10-12 vector is also expected to associate with endogenous Dap10 present in T cells, giving rise to additional complexes, two of which are shown. (B) Flow cytometric analysis of NKG2D expression in CD4+ T cells following transduction with the NKG2D/Dap10-12 CAR or NKG2D alone, making comparison with untransduced cells (median + interquartile range). Number of biological replicates is indicated on this and subsequent panels. ∗∗∗∗p < 0.0001 (Kruskal-Wallis). (C) Normalized MFI of NKG2D expression in CD4+ T cells following transduction with the NKG2D/Dap10-12 CAR or NKG2D alone. Data (median + interquartile range) were normalized to expression in NKG2D/Dap10-12 CAR T cells (set to 100). ∗∗∗∗p < 0.0001 (Mann-Whitney). (D) CD4/CD8 analysis on day 10 of culture (median + interquartile range). ∗∗∗∗p < 0.0001 (Mann-Whitney). (E) NKG2D/Dap10-12 CAR T cells were labeled with CDTR and incubated with an equal number of CFSE-labeled T cells that expressed NKG2D/Dap10-12, NKG2D or were untransduced. Proportions of these cells remaining in the co-culture were analyzed by flow cytometry after 48 h (representative of three independent replicates). (F) Expression of KLRG1 (median + interquartile range) on NKG2D/Dap10-12 CAR T cells, making comparison with control cells that were untransduced or in which NKG2D alone was over-expressed. ∗∗p < 0.01 (Friedman test). (G) Expression of CD57 (median + interquartile range) on the same T cell populations. ∗p < 0.05; ∗∗p < 0.01 (Friedman test). (H) Expression of CD27 (mean ± SEM) on the same T cell populations. ∗p < 0.05; ∗∗∗∗p < 0.0001 (one-way ANOVA). (I) Cytotoxicity assays were carried out in which the indicated T cells were co-cultivated for 24 h at the specified target to effector ratio with listed tumor cell lines. Tumor cell viability was determined using a 3-(4,5-dimethylthiazol-2-yl)-2,5-diphenyl-2H-tetrazolium bromide (MTT) assay (mean ± SEM). ∗∗∗∗p < 0.0001 (two-way ANOVA). (J) Indicated T cells were co-cultivated for 24 h at a 1:1 target to effector ratio with BxPC3 tumor cells, supplemented with increasing concentrations of recombinant MICA (mean ± SEM, n = 2). Tumor cell viability was determined as in (I). Data are representative of three independent replicates. (K) IL-2 concentration was analyzed in supernatants collected after 24 h from co-cultures of indicated tumor cells and T cells (target to effector ratio 1:1; median + interquartile range). ∗p < 0.05; ∗∗p < 0.01; ∗∗∗∗p < 0.0001; NS - not significant (Kruskal-Wallis). (L) IFN-γ concentration was analyzed in supernatants collected after 72 h from co-cultures described in (K) (median + interquartile range). ∗∗p < 0.01; ∗∗∗p < 0.001; ∗∗∗∗p < 0.0001 (Kruskal-Wallis). (M) Maximum (Max.) fold expansion of indicated T cells following twice weekly re-stimulation on specified tumor cell lines (median + interquartile range). ∗∗∗∗p < 0.0001; NS, not significant (Kruskal-Wallis). (N) Number of effective re-stimulation (restim.) cycles achieved by indicated T cells when re-stimulated twice weekly on specified tumor cell lines. Re-stimulations were considered successful if <60% of tumor cells remained viable (median + interquartile range). ∗∗∗p < 0.001; ∗∗∗∗p < 0.0001 (Kruskal-Wallis). See Figures S1–S4 for additional data.
Figure 2
Figure 2
In vivo anti-tumor activity of NKG2D/Dap10-12 CAR T cells (A) Firefly luciferase (ffLuc)-expressing SKOV-3 cells (5 × 105 cells) were established i.p. in female NSG mice for 14 days prior to i.p. administration of 10 million of the indicated T cell populations, or PBS. Tumor burden was monitored using bioluminescence imaging (BLI), and complete response (CR) numbers are indicated. Number of biological replicates is indicated on this and subsequent panels. ∗∗∗∗p < 0.0001 (two-way ANOVA post-treatment to day 34). (B) ffLuc-expressing BxPC3 cells (1 × 105 cells) were established i.p. in NSG mice for 12 days prior to i.p. administration of 10 million of the indicated T cell populations, or PBS. Tumor burden was monitored using BLI, and CR numbers are indicated. ∗p < 0.05; ∗∗∗p < 0.001 (two-way ANOVA post-treatment to day 32). Re-challenge with a similar dose of BxPC3 cells was performed in tumor-free mice on day 87. Rejection frequency is indicated. (C) ffLuc-expressing H226 mesothelioma cells (1 × 106 cells) were established i.p. in NSG mice for 8 days prior to i.p. administration of 10 million of the indicated T cell populations, or PBS. Tumor burden was monitored using BLI, and CR numbers are indicated. ∗p < 0.05; ∗∗∗∗p < 0.0001 (two-way ANOVA post-treatment to day 52). Re-challenge with a similar dose of H226 cells was performed in tumor-free mice on day 91. Rejection frequency is indicated. (D–F) Survival of mice described in (A–C), respectively. ∗∗p < 0.01; ∗∗∗p < 0.001 (Log rank/Mantel-Cox).
Figure 3
Figure 3
Anti-tumor activity of adaptor and linear NKG2D-based CAR T cells (A) Structure of NKG2D-CD3ζ (analog of the clinical stage CYAD-01 CAR), NKG2D-CD3ζ/Dap10, NKG2D/Dap10-12 CARs, and NKG2D. (B) Flow cytometric analysis of NKG2D expression in CD4+ T cells 10 days following transduction with the indicated CARs or NKG2D alone (median + interquartile range). Number of biological replicates is indicated on this and subsequent panels. ∗∗p < 0.01; ∗∗∗∗p < 0.0001; NS, not significant (Kruskal-Wallis). (C) Normalized MFI of NKG2D expression in CD4+ T cells 10 days following transduction with the indicated CARs or NKG2D alone (median + interquartile range). Data were normalized in each experiment to expression in NKG2D/Dap10-12 CAR T cells, which was set to 100. ∗∗∗p < 0.001; ∗∗∗∗p < 0.0001; NS, not significant (Kruskal-Wallis). (D) Number of twice weekly re-stimulation (restim.) cycles achieved by indicated T cells on specified tumor cell lines (median + interquartile range). ∗∗p < 0.01; ∗∗∗∗p < 0.0001; NS, not significant (Kruskal-Wallis test). (E) IL-2 concentration was analyzed in supernatants collected after 24 h from co-cultures of indicated tumor cells and T cells (target to effector ratio 1:1; median + interquartile range). ∗∗p < 0.01; ∗∗∗∗p < 0.0001; NS, not significant (Kruskal-Wallis). (F) IFN-γ concentration was analyzed in supernatants collected after 72 h from co-cultures described in E (median + interquartile range). ∗p < 0.05; ∗∗∗p < 0.001; ∗∗∗∗p < 0.0001; NS, not significant (Kruskal-Wallis). (G) ffLuc-expressing BxPC3 cells (1 × 105 cells) were established i.p. in NSG mice for 11 days prior to i.p. administration of 4 million of the indicated T cell populations, or PBS. Tumor burden was monitored using BLI. ∗p < 0.05; ∗∗p < 0.01; ∗∗∗p < 0.001; NS, not significant (two-way ANOVA post-treatment). (H) Survival of mice described in (G). ∗p < 0.05; ∗∗∗p < 0.001 (Log rank/Mantel-Cox). (I) Seahorse mitochondrial stress testing of indicated T cells, adding specified inhibitors as indicated (mean ± SEM, n = 3–7). ∗p < 0.05; ∗∗p < 0.01; ∗∗∗p < 0.001 (two-way ANOVA, comparing NKG2D/Dap10-12 CAR T cells to the indicated comparator group at time points 7–9). (J) Spare respiratory (resp.) capacity of T cells described in (I) (mean ± SEM, n = 3–7). ∗p < 0.05 (unpaired t test). See Figure S5 for additional data.
Figure 4
Figure 4
In vivo comparison of NKG2D/Dap10-12 and NKG2D-CD3ζ CARs (A) Mesothelioma PDX_008 was engrafted s.c. in NSG mice. After 108 days 10 million of the indicated T cell populations or PBS were injected i.v. Tumor volume was monitored by caliper measurements. Number of biological replicates and CRs are indicated on this and subsequent panels. ∗∗∗∗p < 0.0001 (two-way ANOVA post-treatment). (B) ffLuc-expressing Kuramochi (1 × 105 cells) were established i.p. in NSG mice for 17 days prior to i.p. administration of 5 million of the indicated T cell populations, or PBS. A second dose of 5 million T cells or PBS was administered i.v. on day 18. Tumor burden was monitored using BLI, and CR numbers are indicated. ∗p < 0.05; ∗∗p < 0.01; ∗∗∗p < 0.001 (two-way ANOVA post-treatment). Re-challenge with a similar dose of Kuramochi cells was performed in tumor-free mice on day 86. Rejection frequency is indicated. (C) ffLuc-expressing A2780 (1 × 105 cells) were established i.p. in NSG mice for 6 days prior to i.p. administration of 2 million of the indicated T cell populations, or PBS. A second dose of 2 million T cells or PBS was administered i.v. on day 7. Tumor burden was monitored using BLI, and CR numbers are indicated. ∗∗p < 0.01; ∗∗∗∗p < 0.0001 (two-way ANOVA post-treatment). Re-challenge with a similar dose of A2780 cells was performed in tumor-free mice on day 56. Rejection frequency is indicated. (D–F) Survival of mice described in (A–C), respectively. ∗p < 0.05; ∗∗∗p < 0.001 (Log rank/Mantel-Cox). See Figure S6 for additional data.
Figure 5
Figure 5
Evaluation of structural attributes in NKG2D-based CAR function (A) Structure, nomenclature, and numbering of an extended linear and adaptor NKG2D-based CAR panel. (B) Normalized MFI of NKG2D expression in CD4+ T cells 10 days following transduction with the indicated CARs (numbering scheme shown in A; median + interquartile range). Data were normalized to expression in NKG2D/Dap10-12 CAR T cells (CAR number 7), which was set to 100. Numbers of biological replicates: 23 (CAR 1), 26 (2), 55 (3), 6 (4), 6 (5), 6 (6), 72(7), 17 (8), 26 (9), 29 (10), 31 (11), 26 (12). ∗p < 0.05; ∗∗p < 0.01; ∗∗∗∗p < 0.0001; NS, not significant (Kruskal-Wallis). (C) Number of twice weekly re-stimulation (restim.) cycles on Ren tumor cells, making comparison between otherwise structurally matched CARs that contain full length (N) or endodomain truncated (Tr.) NKG2D (NTr.). Ut, untransduced control T cells (median + interquartile range). Numbers of biological replicates: 50 (Ut), 15 (CAR 1), 17 (2), 9 (8), 12 (9), 33 (3), 6 (4), 6 (5), 6 (6). ∗p < 0.05; NS, not significant (Kruskal-Wallis). (D) Data in (C) have been pooled, making comparison between all CARs that contain full length (N) or endodomain truncated NKG2D (NTr.; median + interquartile range). Numbers of biological replicates are indicated. ∗∗∗∗p < 0.0001 (Kruskal-Wallis). (E) Number of restim. cycles (median + interquartile range) on Ren tumor cells, making comparison between otherwise structurally matched NKG2D-based CARs that contain 1 or 3 ITAMs per CAR endodomain chain. Numbers of biological replicates: 50 (Ut), 39 (CAR 7), 17 (11), 12 (12), 17 (11), 15 (1), 6 (5), 17 (2), 6 (6). ∗p < 0.05; NS, not significant (Kruskal-Wallis). (F) Pooled analysis of data shown in (E) (median + interquartile range). Numbers of biological replicates are indicated. ∗p < 0.05 (Kruskal-Wallis). (G) Number of restim. cycles (median + interquartile range) on Ren tumor cells, making comparison between otherwise structurally matched NKG2D-based CARs with an adaptor (A) or linear (L) conformation. Numbers of biological replicates: 50 (Ut), 39 (CAR 7), 15 (1), 17 (11), 6 (5). ∗∗∗∗p < 0.0001; ∗∗p < 0.01 (Kruskal-Wallis). (H) Pooled analysis of data shown in (G) (median + interquartile range). Numbers of biological replicates are indicated. ∗∗∗∗p < 0.0001 (Kruskal-Wallis). (I) Number of restim. cycles (median + interquartile range) on Ren tumor cells achieved by NKG2D-based CAR T cells expressed alone (−) or together with exogenous Dap10 (+). Numbers of biological replicates: 50 (Ut), 15 (CAR 1), 9 (8), 17 (2), 12 (9), 33 (3), 14 (10). ∗p < 0.05; ∗∗∗p < 0.001; NS, not significant (Kruskal-Wallis). (J) Pooled analysis of data shown in (I) (median + interquartile range). Numbers of biological replicates are indicated. ∗∗∗∗p < 0.0001 (Kruskal-Wallis). (K) Pooled analysis of all NKG2D-based CARs shown in (A), comparing number of restim. cycles (median + interquartile range) achieved by CAR T cells with normalized MFI below or above the median value. Numbers of biological replicates are indicated. ∗∗∗∗p < 0.0001 (Kruskal-Wallis). (L) CARs shown in (A) were scored for the indicated attributes in order to select candidates for in vivo comparison. Although scoring poorly, CAR 3 (NKG2D-CD3ζ) was also advanced in light of the extensive clinical data pertaining to this CAR. See Figure S7 for additional data.
Figure 6
Figure 6
In vivo comparison of optimized NKG2D-based CAR T cells in a stringent s.c. pancreatic tumor xenograft model (A) BxPC3 cells (1 × 105 cells) were established s.c. in NSG mice for 17 days prior to i.v. administration of 10 million of the indicated T cell populations, or PBS. Tumor volume was monitored using calipers. CR numbers are indicated. ∗∗∗∗p < 0.0001; NS, not significant (two-way ANOVA, tumor burden post-treatment). Numbers of biological replicates are indicated. (B) Survival of mice described in (A). ∗∗∗p < 0.001; ∗∗∗∗p < 0.0001; NS, not significant (Log rank/Mantel-Cox).
Figure 7
Figure 7
RNA sequencing analysis of NKG2D/Dap10-12 CAR T cells making comparison with CD3ζ-based CAR T cells (A) The indicated CAR and control T cell populations were stimulated for 24 h on immobilized MICA prior to RNA extraction and bulk sequencing analysis (n = 3 donors). Principal-component analysis (PCA) is shown. (B) Data shown in (A) but restricted to the four CAR T cell populations only. (C) Volcano plot indicating differential gene expression when comparing stimulated NKG2D/Dap10-12 T cells with all stimulated CD3ζ-containing CAR T cell populations. Significantly upregulated or downregulated genes (false discovery rate [FDR] < 0.05) are indicated in red. (D) Gene set enrichment analysis (GSEA) running score plot of the ribosome gene signature (KEGG database) based on the comparison between NKG2D/Dap10-12 T cells with CD3ζ-based CARs. The associated normalized enrichment score (NES) and FDR are reported. (E) GSEA running score plot of expression of the oxidative phosphorylation pathway (KEGG database) based on the comparison between NKG2D/Dap10-12 T cells with CD3ζ-based CARs. NES and FDR are reported. (F) Heatmap of Z score transformed counts per millions of GSEA core enrichment genes of the ribosome signature (KEGG database) in NKG2D/Dap10-12 T cells compared to CD3ζ-based CARs. Genes and samples are listed based on unsupervised hierarchical clustering of the underlying expression data. (G) Heatmap of Z score transformed counts per millions of GSEA core enrichment genes of the oxidative phosphorylation pathway (KEGG database) in NKG2D/Dap10-12 T cells compared to CD3ζ-based CARs. Genes and samples are listed based on unsupervised hierarchical clustering of the underlying expression data. (H) Lollipop plot summarizing biologically relevant and statistically significant (FDR < 0.05) GSEA results based on the gene expression changes between NKG2D/Dap10-12 and CD3ζ-based CAR T cells. Results for selected KEGG, REACTOME, and HALLMARK pathways are shown as circles, while position on the x axis indicates the NES. Circle color represents the associated FDR, and circle size corresponds to the overlap between the members of the signatures and the genes tested for differential expression in the current study.

References

    1. Tan G., Spillane K.M., Maher J. The Role and Regulation of the NKG2D/NKG2D Ligand System in Cancer. Biology. 2023;12:1079. doi: 10.3390/biology12081079. - DOI - PMC - PubMed
    1. Sheppard S., Guedes J., Mroz A., Zavitsanou A.M., Kudo H., Rothery S.M., Angelopoulos P., Goldin R., Guerra N. The immunoreceptor NKG2D promotes tumour growth in a model of hepatocellular carcinoma. Nat. Commun. 2017;8 doi: 10.1038/ncomms13930. - DOI - PMC - PubMed
    1. Guerra N., Tan Y.X., Joncker N.T., Choy A., Gallardo F., Xiong N., Knoblaugh S., Cado D., Greenberg N.M., Raulet D.H. NKG2D-deficient mice are defective in tumor surveillance in models of spontaneous malignancy. Immunity. 2008;28:571–580. doi: 10.1016/j.immuni.2008.02.016. - DOI - PMC - PubMed
    1. Adami A., Maher J. An overview of CAR T-cell clinical trial activity to 2021. Immunother. Adv. 2021;1 doi: 10.1093/immadv/ltab004. - DOI - PMC - PubMed
    1. Zhang T., Lemoi B.A., Sentman C.L. Chimeric NK-receptor-bearing T cells mediate antitumor immunotherapy. Blood. 2005;106:1544–1551. doi: 10.1182/blood-2004-11-4365. - DOI - PMC - PubMed

MeSH terms

Substances