. 2024 Dec 16;34(24):5728-5738.e4.
doi: 10.1016/j.cub.2024.10.062. Epub 2024 Nov 19.

A tug-of-war between germ cell motility and intercellular bridges controls germline cyst formation in mice

Affiliations

A tug-of-war between germ cell motility and intercellular bridges controls germline cyst formation in mice

Ezra W Levy et al. Curr Biol. .

Abstract

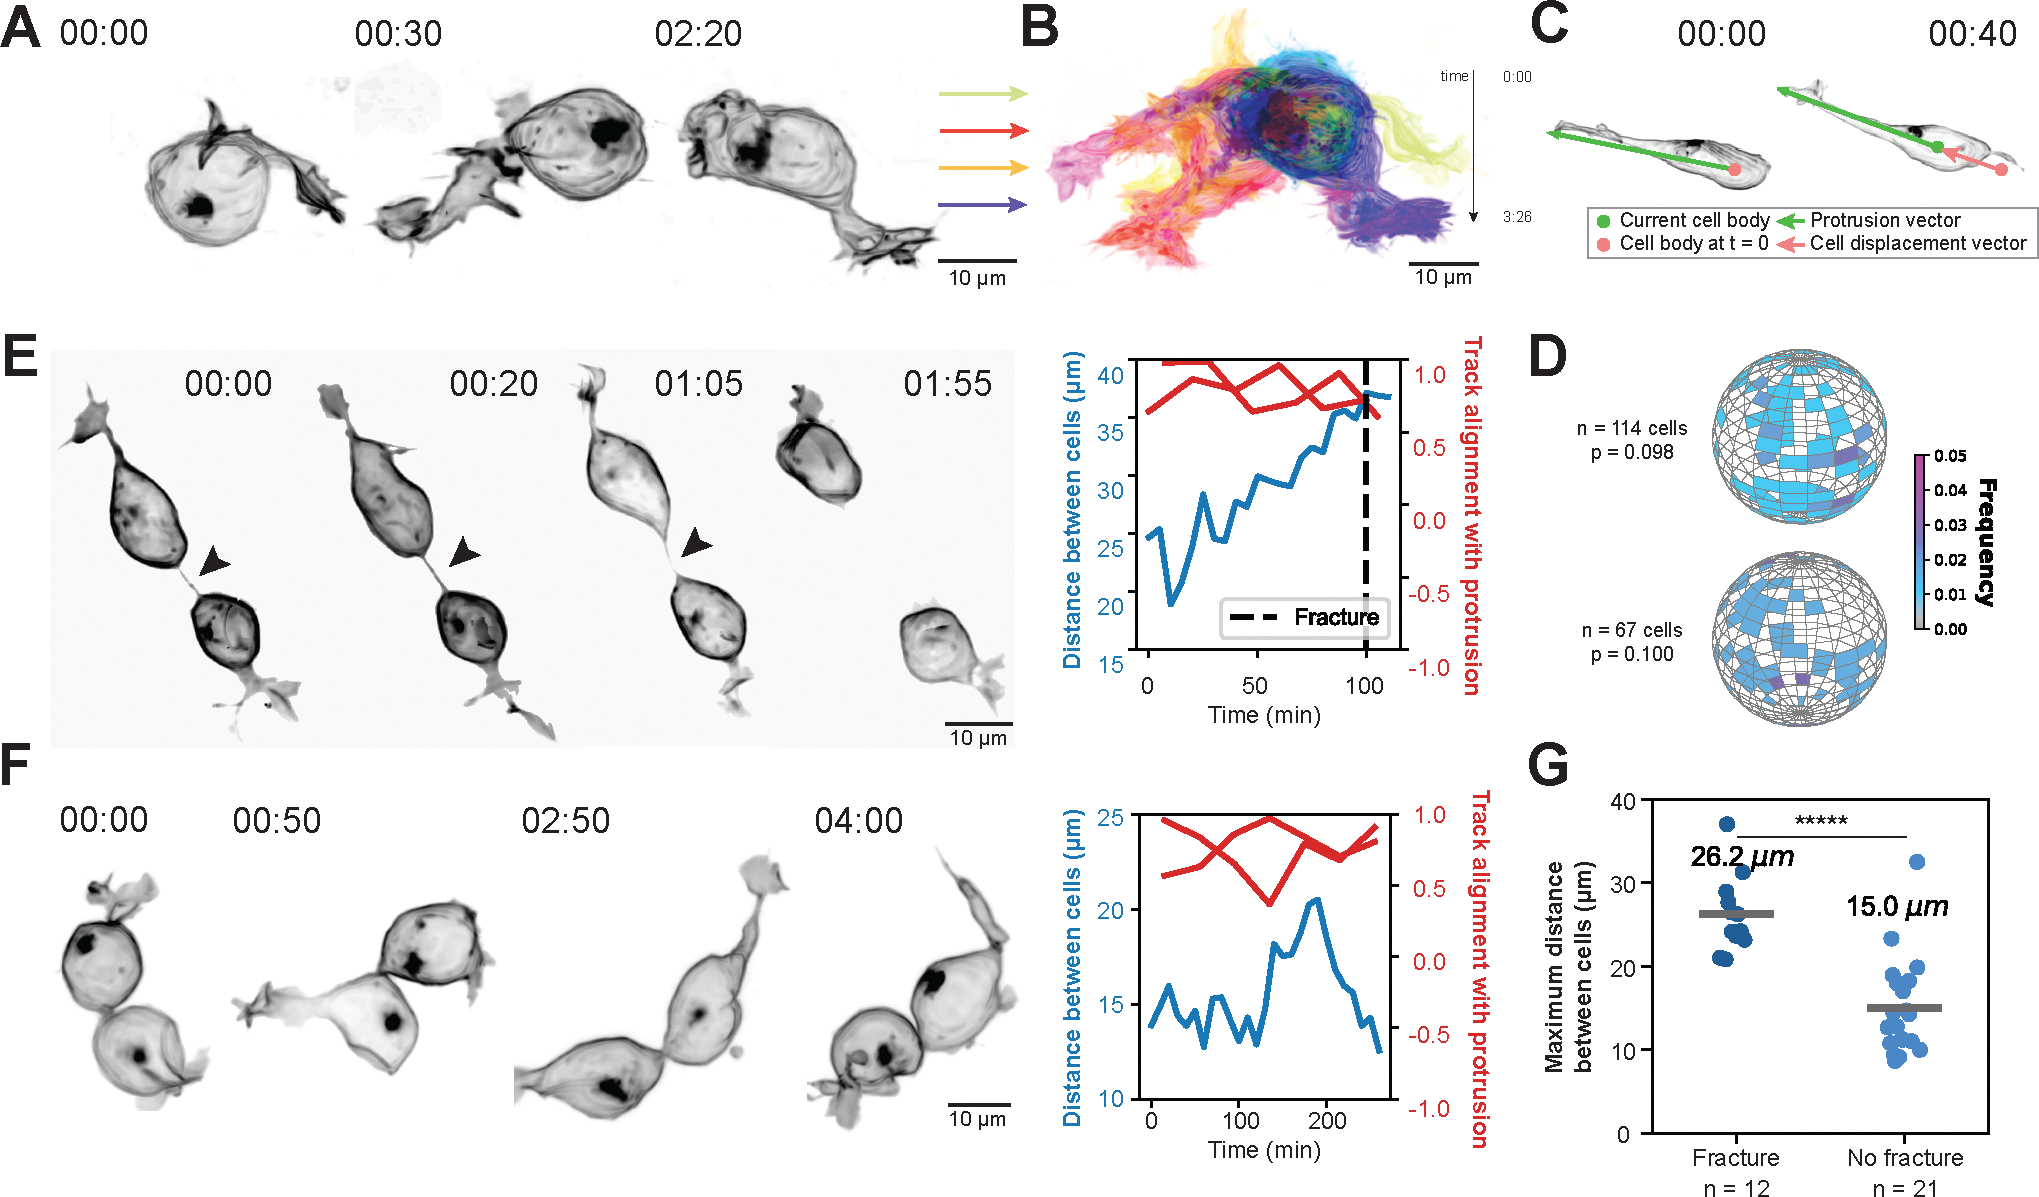
Gametes in many species develop in cysts-clusters of germ cells formed by incomplete cytokinesis-that remain connected through intercellular bridges (ICBs). These connections enable sharing of cytoplasmic components between germ cells and, in the female germ line, enrich select cells in the cyst to become the oocyte(s). In mice, germline cysts of variable sizes are generated during embryonic development, thought to result from cyst fractures. Studies of fixed samples failed to capture fracture events, and thus, the mechanism remained elusive. Here, we use high-resolution live imaging of germ cells within their native tissue environment to visualize germline cyst dynamics. With this novel approach, we reveal a striking motile phenotype of gonad-resident germ cells and show that this randomly oriented cell-autonomous motile behavior during cyst formation underlies fracture events. Conversely, we show that stabilized ICBs help resist excessive fracturing. Additionally, we find that motility and thus fracture rates gradually decrease during development in a sex-dependent manner, completely ceasing by the end of cyst-forming divisions. These results lead to a model where the opposing activities of developmentally regulated cell motility and stable ICBs give rise to cysts of variable sizes. We corroborate these results by developing a model that uses experimentally measured fracture rates to simulate cyst formation and fracture and show that it can reproduce experimentally measured cyst sizes in both male and female. Understanding how variable cysts form will enable further studies of mammalian oocyte selection and establishment of the ovarian reserve.

Keywords: Oogonia; cell motility; cyst; cytokinesis; germline; intercellular bridge; live imaging; mouse; ovary.


Conflict of interest statement

Declaration of interests The authors declare no competing interests.

Figures

Figure 1
Figure 1. Live imaging germline cyst formation in the mouse reveals germ cell motility and cyst fractures.
(A) Schematic of female germline cyst formation in Drosophila and mice. Drosophila cyst formation always produces the same pattern of 16-cells, whereas mouse cysts can vary in both size and structure. (B) Overview of tamoxifen-inducible germ cell labeling strategy. Transgenic mouse lines were crossed to generate embryos with mTmG; Oct4-MerCreMer; H2B-miRFP720 alleles. Pregnant females were injected with tamoxifen at E9.5 or E10.5, embryos are dissected at E11.5-E14.5 and isolated gonad/mesonephros complexes are mounted for imaging with a spinning-disk confocal microscope. (C) Tamoxifen dosage tunes germ cell labeling. A high tamoxifen dose at E9.5 (2.5mg/ 40g body weight) labels almost all germ cells (mG expressing cells) by E12.5, while a lower dose (0.25mg/ 40g body weight) labels cells more sparsely, allowing observation of individual cyst behaviors. (D) Live imaging of an E12.5 ovary captures a two-cell cyst dividing and fracturing into sub-cysts of 1 and 3 cells. Green arrows indicate cells that are about to divide, and orange arrows show the fracture of an ICB. Labeled cyst was imaged every 5 minutes for 7.5 hours. Related to Figure S1. See also Video S1.
Figure 2
Figure 2. Randomly oriented germ cell motility can drive cells apart and is correlated with cyst fractures.
(A) Live imaging of a membraneGFP-labeled germ cell over time in an E11.5 gonad. Time shown in hrs:mins. Scale bar 10μm. (B) Maximum intensity projection of all timepoints captured of germ cell in (a). Color coding indicates time, shown in hrs:mins. Scale bar 10μm. (C) Illustration demonstrating quantification of membrane protrusion orientation overlaid on an example E11.5 germ cell. The green dot indicates the cell body centroid at the current timepoint, while the pink dot indicates the cell body centroid at the start of imaging. The protrusion vector (green) from the current cell body centroid to the tip of the protrusion marks the direction of the cell’s protrusion at each timepoint, while the cell displacement vector (pink) from the initial cell body centroid to the current cell body centroid tracks the direction of the cell’s movement at each timepoint. Time shown in hrs:mins. (D) Histograms of membrane protrusion orientation measured in spherical coordinates for germ cells in two E11.5 ovaries. Color coding indicates the frequency of cells’ main protrusion vector orientation at a single timepoint. N indicates the number of cells analyzed in each ovary. Statistical analysis between observed distributions and random distribution of vectors was performed using 10,000 iterations of the two-dimensional Kolmogorov-Smirnov test. (E) (left) Live imaging of cyst dynamics at E11.5 resulting in an ICB fracture. Arrowhead points to ICB. Time shown in hrs:mins. Scale bar 10μm. (right) Distance between the centroids of two cells in the cyst (blue) and alignment of membrane protrusion vectors and cell body displacement vectors for each cell (red) plotted over time. Time shown in mins. Dashed line indicates time of fracture. (F) (left) Live imaging of cyst dynamics at E11.5 which does not result in an ICB fracture. Arrowhead points to ICB. Time shown in hrs:mins. Scale bar 10μm. (right) Distance between the centroids of two cells in the cyst (blue) and alignment of membrane protrusion vectors and cell body displacement vectors for each cell (red) plotted over time. Time shown in mins. (G) Maximum distance between the centroids of two cells connected by an ICB in cysts that fractured versus did not fracture. Line and numeric value indicate the average distance reached between centroids in each case. N indicates the number of pairs of connected cells analyzed. Statistical analysis performed using unpaired two-tailed t-test (***** p < 0.00001). Related to Figures S2 and S3. See also Video S2.
Figure 3
Figure 3. Germ cell motility drives cyst fractures, while stable ICBs act to limit excessive fracturing.
(A) Example time sequences of membraneGFP-labeled germ cell dynamics in (top) wildtype, (second) Arp2/3 inhibitor treated, (third) Arp2/3 inhibitor treated TEX14 reduced, and (bottom) TEX14 reduced E12.5 ovaries. Time shown in hrs:mins. Scale bar 10μm. (B) Quantification of protrusive germ cell morphology in wildtype, Arp2/3 inhibitor treated, TEX14 reduced plus Arp2/3 inhibitor treated, and TEX14 reduced germ cells in E12.5 ovaries. Each data point indicates the protrusion score calculated for each cell by averaging protrusion scores from the initial 10 time points of live imaging time lapse movies. Line and numeric value indicate the average protrusion score for each condition. N indicates the number of cells analyzed. (top) Schematic illustrating protrusion score calculation. A defined number of rays from the centroid of each cell is projected to the surface in 3D and the coefficient of variation of ray lengths is calculated. Statistical analysis performed between different conditions using unpaired two-tailed t-test (not significant not shown, *** p < 0.001). (C) Cyst fracture rates shown as fractures per hour connected for wildtype, Arp2/3 inhibitor treated, TEX14 reduced plus Arp2/3 inhibitor treated, and TEX14 reduced germ cells in E12.5 ovaries. Error bars indicate ± 1 standard deviation. (top) Schematic illustrating that fractures per hour connected was calculated as fracture events observed per hours of intact ICBs observed. N indicates the number of connection hours observed. Statistical analysis performed between different conditions using unpaired two-tailed t-test (not significant not shown, ***** p < 0.00001). Related to Figures S4 and S5. See also Video S3.
Figure 4
Figure 4. Protrusive germ cell behavior and cyst fracture rates are developmentally regulated.
(A) Example live image sequences of membraneGFP-labeled cysts in E11.5-E14.5 ovaries. Time shown in hrs:mins. Scale bar 10μm. (B) Quantification of protrusive germ cell morphology at each embryonic stage indicated in female gonads. Each data point indicates the protrusion score calculated for each cell by averaging protrusion scores from the initial 10 time points of live imaging time lapse movies. Line and numeric value indicate the average protrusion score for each embryonic stage. N indicates number of cells analyzed. Statistical analysis performed between adjacent embryonic stages using unpaired two-tailed t-test (not significant not shown,** p < 0.01, *** p < 0.001). (C) Plot showing cyst fracture rates as fractures per hour connected at each embryonic stage indicated in female gonads. Error bars indicate ± 1 standard deviation. (inset) Schematic illustrating that fractures per hour connected was calculated as fracture events observed per hours of intact ICBs observed. N indicates number of connection hours observed. Related to Figures S6 and S7. See also Video S4.
Figure 5
Figure 5. Cyst fracture rates can explain observed cyst sizes in the ovary.
(A) Germ cells per cyst at each embryonic stage indicated in female gonads. Line and numeric value indicate the average cyst size for each embryonic stage. N indicates number of cysts analyzed. (B) Schematic illustrating a probabilistic model of germline cyst development. A cyst is represented as a graph, where each cell is a node and each ICB is an edge in the network. Cysts originate from a single founder cell and undergo 5 divisions that grow the cyst network, while ICBs created by divisions are subject to fracture at each timepoint. The main parameter of the model is the probability of fracture applied to ICBs. (C) Example of development of a simulated germline cyst when the probability of fracture is 0. (D) Example of development of a simulated germline cyst when the probability of fracture is the experimental female rate of fracture. (E) Simulated germline cyst sizes at each embryonic stage in female gonads. Simulated distributions were obtained by evolving a probabilistic model of E10.5 founder germ cells and applying the experimentally derived fracture rate. Line and numeric value indicate the average cyst size for each embryonic stage. N indicates number of cysts analyzed at final timepoint of simulation. Statistical analysis performed using the Mann-Whitney rank sum test between experimental (A) and simulated (E) cyst sizes at each embryonic stage: not significant at E11.5, E12.5 and E13.5, *p-value = 0.017 at E14.5. Related to Figure S8.
Figure 6
Figure 6. Larger cysts in male correlates with lower cyst fracture rates observed in testes.
(A) Example live image sequences of membraneGFP-labeled cysts in E11.5-E14.5 testes. Time shown in hrs:mins. Scale bar 10μm. (B) Germ cells per cyst at each embryonic stage indicated in male gonads. Line and numeric value indicate the average cyst size for each embryonic stage. Cysts were too large to accurately quantify from live images at E14.5, therefore data is not available. N indicates number of cysts analyzed. (C) Plot showing cyst fracture rates as fractures per hour connected at each embryonic stage indicated in male gonads. Error bars indicate ± 1 standard deviation. (D) Model summarizing germ cell behavior from the time of arrival in the ovary (E10.5) to meiotic entry (E14.5). A single founding cell undergoes ~5 mitotic divisions during this time with incomplete cytokinesis, forming ICBs. Randomly oriented germ cell protrusive activity can drive cells apart from each other during the interphase of the cell cycle and can result in ICB fractures. ~4 fracture events happen during cyst formation within a germ cell clone originating from a single founding cell, giving rise to smaller sub-cysts with variable sizes. See also Video S4.

References

    1. Brubacher JL (2024). Female Germline Cysts in Animals: Evolution and Function. In Syncytia: Origin, Structure, and Functions, Kloc M and Uosef A, eds. (Springer International Publishing; ), pp. 23–46. 10.1007/978-3-031-37936-9_2. - DOI - PubMed
    1. Spradling AC, Niu W, Yin Q, Pathak M, and Maurya B (2022). Conservation of oocyte development in germline cysts from Drosophila to mouse. eLife 11, e83230. 10.7554/eLife.83230. - DOI - PMC - PubMed
    1. Pepling ME, Cuevas M. de, and Spradling AC (1999). Germline cysts: a conserved phase of germ cell development? Trends in Cell Biology 9, 257–262. 10.1016/S0962-8924(99)01594-9. - DOI - PubMed
    1. Lu K, Jensen L, Lei L, and Yamashita YM (2017). Stay Connected: A Germ Cell Strategy. Trends in Genetics 33, 971–978. 10.1016/j.tig.2017.09.001. - DOI - PMC - PubMed
    1. Doherty CA, Amargant F, Shvartsman SY, Duncan FE, and Gavis ER (2022). Bidirectional communication in oogenesis: a dynamic conversation in mice and Drosophila. Trends in Cell Biology 32, 311–323. 10.1016/j.tcb.2021.11.005. - DOI - PMC - PubMed

LinkOut - more resources