. 2025 Feb;638(8052):1085-1094.
doi: 10.1038/s41586-024-08411-y. Epub 2024 Nov 20.

A cell atlas foundation model for scalable search of similar human cells

Affiliations

A cell atlas foundation model for scalable search of similar human cells

Graham Heimberg et al. Nature. 2025 Feb.

Abstract

Single-cell RNA sequencing has profiled hundreds of millions of human cells across organs, diseases, development and perturbations to date. Mining these growing atlases could reveal cell-disease associations, identify cell states in unexpected tissue contexts and relate in vivo biology to in vitro models. These require a common measure of cell similarity across the body and an efficient way to search. Here we develop SCimilarity, a metric-learning framework to learn a unified and interpretable representation that enables rapid queries of tens of millions of cell profiles from diverse studies for cells that are transcriptionally similar to an input cell profile or state. We use SCimilarity to query a 23.4-million-cell atlas of 412 single-cell RNA-sequencing studies for macrophage and fibroblast profiles from interstitial lung disease1 and reveal similar cell profiles across other fibrotic diseases and tissues. The top scoring in vitro hit for the macrophage query was a 3D hydrogel system2, which we experimentally demonstrated reproduces this cell state. SCimilarity serves as a foundation model for single-cell profiles that enables researchers to query for similar cellular states across the human body, providing a powerful tool for generating biological insights from the Human Cell Atlas.


Conflict of interest statement

Competing interests: All of the authors are employees of Genentech or Roche. A.R. is a co-founder and equity holder of Celsius Therapeutics, an equity holder in Immunitas and, until 31 July 2020, was an scientific advisory board member of Thermo Fisher Scientific, Syros Pharmaceuticals, Neogene Therapeutics and Asimov. G.H., D.J.D., O.S., N.D., G.S., T.B., S.J.T., J.R.R., H.C.B., J.K., J.A.V.H. and A.R. have equity in Roche.

Figures

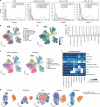
Fig. 1
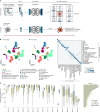
Fig. 1. SCimilarity metric learning enables cell search in large human scale atlases.
a, Cell querying with SCimilarity. Left, a query cell profile is compared to a searchable reference foundation model of 23.4 million profiles from 412 studies. Middle, samples with similar cells are identified and returned with information about the original sample conditions, including tissue, in vitro or diseases contexts. Right, a SCimilarity score is computed between the query cell and each cell within a tissue sample. b, Triplet loss training. Left, 56 training and 15 test datasets with Cell Ontology annotations from across the body are used as input. Middle, cell triplets are sampled, each consisting of an anchor cell (A), a positive cell (P, anchor-similar) and a negative cell (N, anchor-dissimilar), based on Cell Ontology annotations. Only non-ambiguous relationships are allowed. Right, triplets are used to train a neural network that embeds similar cells closer than dissimilar ones, forming a foundation model. Treg, regulatory T cells. The loss function is computed using a cell triplet, a reconstructed anchor cell profile (Â), and a weighting parameter (β) to balance the triplet loss (Ltriplet) and the mean squared error loss (LMSE).
Fig. 2
Fig. 2. SCimilarity learns a universal representation that generalizes to new datasets.
a, A large-scale reference database of public gene expression datasets across tissues and diseases. The number of cells (circle size) across tissues (outermost light blue circles) and disease states (middle green circles) across individual studies (innermost circles) in the training (gold), test (pink) or unannotated (purple) datasets is shown. SLE, systemic lupus erythematosus; RA, rheumatoid arthritis; NAFLD, non-alcoholic fatty liver disease; MS, multiple sclerosis; LCH, Langerhans cell histiocytosis; LAM, lymphangioleiomyomatosis; IBD, inflammatory bowel disease. b, Benchmarking SCimilarity against established data integration models. Ontology-aware ARI (study ARI, y axis, top left), NMI (study NMI, y axis, top middle), batch ASW (y axis, top right), cell type ASW (y axis, bottom left) and graph connectivity (y axis, bottom right) for different integration methods and SCimilarity (coloured bars), each applied to integrate two kidney datasets, two lung datasets, two PBMC datasets and all 15 held out (test) datasets (x axis) are shown. c, SCimilarity generalizes new datasets and flags outlier cells across different tissues and conditions. The fraction (x axis) of cells with low similarity to training data (SCimilarity score of <50) in each study (points) from different diseases (y axis, top) or healthy tissues (y axis, bottom callout) is shown.
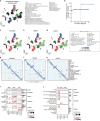
Fig. 3
Fig. 3. SCimilarity accurately annotates cell types across the human body.
a, SCimilarity cell annotation. A new unannotated cell (grey, bottom left) is embedded in SCimilarity’s common low-dimensional space and compared against the precomputed reference for cell type annotation (0.02 s per cell). b–d, SCimilarity annotation of a kidney scRNA-seq dataset. b,c, Uniform manifold approximation and projection (UMAP) embedding of cell profiles (dots) from SCimilarity’s latent representation of a held-out kidney dataset coloured by author-provided (b) or SCimilarity-predicted (c) cell type annotations. LoH TAL, loop of Henle thick ascending limb; LoH tDL, loop of Henle thin descending limb. d, The percentage (colour bar and number) of author-annotated cells (columns) with each SCimilarity annotation (rows). e, Cell type annotation performance. Left, the accuracy (percentile F1 scores, higher is better; y axis) of SCimilarity and each of three annotation methods (colour bars) in matching author annotations in each of 15 test datasets (x axis) withheld from SCimilarity training. Right, the distribution of percentile F1 scores for each method (colour) across all 15 datasets. The box plots show the upper/lower quartiles (box limits), minimum/maximum values (whiskers) and median (centre line). F1 scores are calculated using a random sample of n = 10,000 cells per study. Data from refs. ,–,–. Epi., epithelial; prox., proximal; pDC, plasmacytoid DC.
Fig. 4
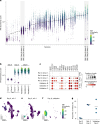
Fig. 4. SCimilarity cell search reveals FMs across ILD and other diseases.
a, SCimilarity cell search. A query cell profile (bottom left) is embedded into the SCimilarity representation with 23.4 million reference cells. Its nearest neighbours by distance are tabulated by study, tissue and disease. be, Identification of FMs across tissues. b, SCimilarity scores (y axis, log10 scale and colour bar) against an FM query profile for all monocytes and macrophages (dots) from 1,041 in vivo tissue samples from 143 studies (x axis), ordered by the mean SCimilarity score. c, The number of cells (circle size) across tissues (outermost light blue circles), disease states (middle green circles) and individual studies (innermost circles, coloured by the fraction of monocytes and macrophages with SCimilarity scores >99th percentile of all FM SCimilarity scores (log-scaled colour bar)). Circle sizes for disease and individual study are scaled relative to other diseases in the same tissue or studies in the same disease. d,e, UMAP of all single-cell profiles (macrophages and otherwise, dots) from the SCimilarity representation for ILD (d) and PDAC (e) studies, coloured by FM query SCimilarity scores (colour bar). f, SCimilarity’s explainability framework scores FM-associated genes by importance. The distribution of Integrated Gradients attribution scores (y axis, top; horizontal bars show the mean) for genes (x axis, top; columns, bottom) with the top 50 scores for FMs versus lung macrophages and their membership (red, presence; grey, absence) in published macrophage signatures (bottom, rows). The left colour bar represents the AUC for the attribute score match to published signatures. The signature publication source and P value (two-sided Mann–Whitney U-tests; in signature > not in signature) across the top 3,000 genes by mean attribution score are shown on the right. Attribution scores, AUC values and P values were calculated using the n = 500 cells most similar to FMs against n = 500 randomly sampled cells from the full n = 2,578,221 cell monocyte and macrophage query set.
Fig. 5
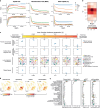
Fig. 5. SCimilarity cell search identifies in vitro cells matching an in vivo FM state and a novel in vitro disease model.
a, Identification of FM-like cells across in vitro samples with a SCimilarity cell search. SCimilarity scores (y axis, log10 scale, colour bar) against a FM query profile for each annotated myeloid cell (dot) from n = 40 in vitro samples (x axis) from n = 17 studies, ordered by the mean SCimilarity score. The grey boxes show day 0 and day 5 samples from a 3D-hydrogel culture system. bf, 3D conditions yield FM-like cells in vitro in validation experiments. b, SCimilarity scores (y axis, log10 scale, colour bar) against an FM query profile for each annotated myeloid cell (dot) in the original 3D-hydrogel culture system dataset from n = 2 independent donors at day 0 and day 5 and from n = 3 independent donors in the day 8 validation experiment (x axis). c, The mean expression (dot colour) and percentage of cells (dot size) expressing genes (rows) with a high SCimilarity attribution score for distinguishing FMs in vivo (as in f) in myeloid cells in the original 3D-hydrogel culture system and in the validation experiment (columns). df, UMAP embedding from SCimilarity’s query model latent space of cell profiles (dots) from day 0 (d) or day 5 (e) of the original 3D-hydrogel culture system, or from day 8 (f) of the replication experiment, coloured by FM SCimilarity score (colour bar). g, Replication of original finding of HSC expansion. The proportion of HSCs in n = 2 donors from ref. at day 0 and day 5 and n = 3 donors from the day 8 validation experiment.
Extended Data Fig. 1
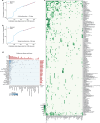
Extended Data Fig. 1. Data compendium to assemble a pan-human reference.
a,b, Cumulative number of (a) cells (y axis) and (b) samples (y axis) profiled by sc/snRNA-seq (and matching our filters; Methods) over time (x axis). Doubling time is calculated based on the publication date from the most recent 150 data points (dashed red line). c, Author-annotated cell types used in training. Number of author-annotated cells (colour bar) from each Cell Ontology type (rows) and study (columns) used for SCimilarity model training. d, Tissues and diseases used in training. Number of studies (heatmap tiles, text and colour bar) and cells (margins, y or x axis) used for model training from each tissue (rows, right y axis) and disease (columns, top x axis).
Extended Data Fig. 2
Extended Data Fig. 2. SCimilarity training and hyperparameters.
a, Training and validation curves. Triplet loss (y axis, left), reconstruction loss (mean squared error (MSE), y axis, middle), and percent of hard triplets (y axis, right) across training (top) or validation (bottom) batches (x axis), for SCimilarity models with margin=0.05 across six β values (colour). Reconstruction loss for pure triplet loss (β = 1) not shown. b, Impact of hyperparameter selection on model performance. Overall model score (colour) across margins (columns) and loss weightings (β, rows), (β = 0: pure reconstruction loss; β = 1: pure triplet loss). Model score is the sum of query score for FMΦ retrieval (correlation between signature and SCimilarity score of retrieved FMΦs) and ontology-aware average silhouette width of integration (higher score reflects more coherent clusters by cell type). c, Test metrics for SCimilarity models across β values. FMΦ retrieval (first row), ontology-aware average silhouette width of integration (second row), UMAP embedding of cells from nine lung datasets coloured by study (third row), and sum of retrieval and integration scores (y axis, fourth row) for models trained with increasing β (leftmost: traditional autoencoder; rightmost: triplet loss only) across n = 3 model replicates for each β. d,e, SCimilarity better captures an FMΦ query. d, UMAP of cells from the ILD study GSE128033 with cells coloured by FMΦ signature score (ground truth) or similarity to the FMΦ query for SCimilarity (right, first), scGPT (right, second), or scFoundation (right, third). Top left: Spearman’s ρ between signature score rankings and distances to the query cell. e, Distribution of FMΦ signature (first), SCimilarity (second), scGPT (third), and scFoundation (fourth) scores as in (d) for n = 28 SCimilarity predicted cell types across n = 58,530 cells (outliers removed). Boxplot: upper/lower quartiles (box), min/max values (whiskers), and median (center line).
Extended Data Fig. 3
Extended Data Fig. 3. SCimilarity integrates and annotates across profiling methods.
a, SCimilarity integrates snRNA-seq and scRNA-seq. Distribution of pairwise SCimilarity embedding distances for randomly sampled cell (sc-sc), nucleus (sn-sn) or cell-nucleus (sc-sn) profile pairs (max n = 1000, without replacement) within SCimilarity-annotated B cells (first), classical monocytes (second), CD4+ T cells (third), or CD8+ T cells (fourth) from patient tumour CLL1 in Slyper et al., 2020; overlayed with similarly sampled cell or nucleus pairwise embedding distances between B cells and classical monocytes (first, second) or CD4+ T cells and CD8+ T cells (third, fourth). b-f, SCimilarity generalizes well to scRNA-seq test data collected by seven different methods. UMAP embedding of PBMC profiles from one sample profiled by seven different scRNA-seq methods coloured by platform and replicate (b) and nearest-neighbour distance in SCimilarity’s latent space (b); d, Distribution of nearest-neighbour distances (y axis, range limited to ≤ 0.05) for each platform and replicate (x axis). e, UMAP embedding as in b, coloured by author (left) or SCimilarity (right) annotations. f, Percentage (colour bar) of author-annotated cells (rows) matching annotations predicted by SCimilarity for each platform and replicate (columns). g, Negative control benchmark of data integration. UMAP embedding of B cell profiles (from Szabo et al.) and Treg profiles (from Deng et al.), coloured by cell type after integration with each of five methods.
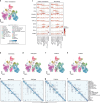
Extended Data Fig. 4
Extended Data Fig. 4. Validation of cell type annotation on tissue scRNA-seq.
a, SCimilarity unconstrained cell type annotation. UMAP embedding of single cell profiles (dots) from SCimilarity’s latent representation of a test scRNA-Seq kidney data (held out from training) (as in Fig. 3b,c), coloured by cell annotations obtained without constraining to the scope of author-provided annotations in the study. b, Annotation is robust to the number of nearest neighbours. Cell type classification score (y axis) at different number of nearest-neighbours, k (x axis). c-h, Benchmarking of annotation by established methods. c,e,g, UMAP embedding of cell profiles as in (a) coloured by annotations predicted by CellTypist (c), TOSICA (e), or scANVI (g). d,f,h, Percentage (colour bar) and number of author-annotated cells (columns) matching annotations predicted by CellTypist (d), TOSICA (f), and scANVI (h) (rows). i,j, Author annotated cDCs express a mixture of DC markers and markers of other cell types. Mean expression (dot colour) and percent of expressing cells (dot size) for canonical marker genes of monocytes (Mono), macrophages (Mac), and conventional dendritic cells (cDCs) (i) or epithelial (Epi), endothelial (Endo), or other non-myeloid lineages (Other) (j) in author-annotated cDCs (row 1) and the subset of those same cells predicted as different myeloid subsets (rows, i) or as non-myeloid cells (rows, j) by other annotation methods. Right bar plots and counts: number of cells per annotation.
Extended Data Fig. 5
Extended Data Fig. 5. Validation of cell type annotation on CITE-seq of PBMCs.
a, Author annotations. UMAP embedding of single-cell profiles (dots) from SCimilarity’s latent representation of PBMCs profiled by CITE-seq. b-i, SCimilarity’s annotation accuracy is on par or better than three other methods. Left: UMAP embedding (as in a) of cell profiles coloured by annotations predicted by SCimilarity (b), CellTypist (d), TOSICA (f), or scANVI (h). Right: Percentage (colour bar) and number of author-annotated cells (columns) matching annotations predicted by SCimilarity (c), CellTypist (e), TOSICA (g), or scANVI (i) (rows). j, Surface marker protein levels of selected cell populations. Distribution (y axis) and median level within population (colour bar) of author-normalized protein levels for selected markers (rows) across cell types (x axis) for author (left) and SCimilarity (left) annotated cells.
Extended Data Fig. 6
Extended Data Fig. 6. SCimilarity annotations and gene attributions capture known biology.
a, SCimilarity annotated cell type profiles group by correct biological relations. Hierarchical clustering (average linkage with cosine distance) of centroids profiles of predicted cell types (leaves) in SCimilarity latent space, coloured by lineage. b, SCimilarity cell type important genes match cell type specific signatures. Fraction of cell type-specific differentially expressed genes (from Eraslan et al.) (y axis) captured by top-n important genes (x axis) for that cell type by SCimilarity’s integrated gradients attribution analysis.
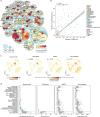
Extended Data Fig. 7
Extended Data Fig. 7. Fibrosis-associated myofibroblasts correlate with presence of fibrosis-associated macrophages across tissues and diseases.
a, Myofibroblasts are prevalent across tissues and diseases. Number of cells (circle size) across tissues (outermost blue circles), disease states (middle green circles), and individual studies (innermost circles, coloured by fraction of cells annotated as fibroblasts or myofibroblasts with SCimilarity scores >95th percentile of total fibrosis-associated myofibroblast query scores (log scaled colour bar)). Circle size for disease and study are scaled relative to other diseases in the same tissue or studies in the same disease. b, Fibrosis-associated macrophages and myofibroblasts are correlated across conditions. Fractions of FMΦ-like cells (x axis; FMΦ query hits as a fraction of total cells annotated as monocytes or macrophages) and fibrosis-associated myofibroblasts (y axis; fibrosis-associated myofibroblast query hits as a fraction of total cells annotated as fibroblasts or myofibroblasts) in each in vivo sample (dots, coloured by condition) containing >50 monocytes/macrophages and >50 fibroblasts/myofibroblasts with a linear fit (black line) and 95% confidence interval round the fit (grey band). Inset box: Pearson correlation (r2) and nominal two-sided t test p-value for the correlation. c,d, SCimilarity better retrieves a myofibroblast query than LLM-based models. c, UMAP of cells from the ILD study GSE128033 with cells coloured by a myofibroblast signature score (ground truth) or similarity to the myofibroblast query state for SCimilarity (right, first), scGPT (right, second), or scFoundation (right, third). Top left: Spearman’s ρ between signature score rankings and distances to the query cell. d, Distribution of myofibroblast signature (first), SCimilarity (second), scGPT (third), and scFoundation (fourth) scores as in (c) for n = 28 SCimilarity predicted cell types across n = 58,530 total cells (outliers removed). Boxplot: upper/lower quartiles (box), min/max values (whiskers), and median (center line).
Extended Data Fig. 8
Extended Data Fig. 8. FMΦs among monocytes and macrophages.
a-c, Agreement between SCimilarity and traditional FMΦ cell scores. a, Scanpy FMΦ gene signature score (x axis) and FMΦ SCimilarity score using a prototypical FMΦ cellular profile defined from Adams et al. (y axis) for each cell (density shown as colour intensity). b,c, UMAP embedding of n = 2,578,221 monocyte and macrophage cell profiles (dots) from SCimilarity’s latent space representation coloured by SCimilarity score using a prototypical FMΦ cellular profile defined from Adams et al. (b) or by Scanpy’s signature score for FMΦ associated genes (c). d, FMΦ important genes are enriched for relevant pathways. False Discovery Rate (-log10(q value), hypergeometric test, x axis) for enrichment of Reactome pathways (y axis, Q ≤ 0.05 and gene count ≥ 4) with the 100 genes with the top integrated gradients attribution scores for the FMΦ query (ranked by score). Colour: ratio of important genes within a Reactome pathway to the total size of the pathway. e-g, Expression of known and novel genes associated with FMΦs. Distribution of the fraction of cells (y axis) in ILD tissue samples (dots) among n = 500 randomly sampled FMΦ-like (top 10,000 cells by SCimilarity score) cells (orange, n = 23 tissue samples) and n = 500 randomly sampled non-FMΦ-like (remaining cells) macrophages and monocytes (blue, n = 13 tissue sample) that express (>0 UMI counts) the known FMΦ marker TREM2 (e) and two FMΦs-enriched genes not previously described for FMΦs (f,g). Crossbar: upper/lower quartiles (vertical line) and median (horizontal line).

References

    1. Adams, T. S. et al. Single-cell RNA-seq reveals ectopic and aberrant lung-resident cell populations in idiopathic pulmonary fibrosis. Sci. Adv.6, eaba1983 (2020). - PMC - PubMed
    1. Xu, Y. et al. Efficient expansion of rare human circulating hematopoietic stem/progenitor cells in steady-state blood using a polypeptide-forming 3D culture. Protein Cell10.1007/s13238-021-00900-4 (2022). - PMC - PubMed
    1. Rood, J. E., Maartens, A., Hupalowska, A., Teichmann, S. A. & Regev, A. Impact of the Human Cell Atlas on medicine. Nat. Med.28, 2486–2496 (2022). - PubMed
    1. Rosen, Y. et al. Toward universal cell embeddings: integrating single-cell RNA-seq datasets across species with SATURN. Nat. Methods21, 1492–1500 (2024). - PMC - PubMed
    1. Cui, H. et al. scGPT: toward building a foundation model for single-cell multi-omics using generative AI. Nat. Methods21, 1470–1480 (2024). - PubMed