. 2024 Dec;30(12):3468-3481.
doi: 10.1038/s41591-024-03376-x. Epub 2024 Nov 20.

An organotypic atlas of human vascular cells

Affiliations

An organotypic atlas of human vascular cells

Sam N Barnett et al. Nat Med. 2024 Dec.

Abstract

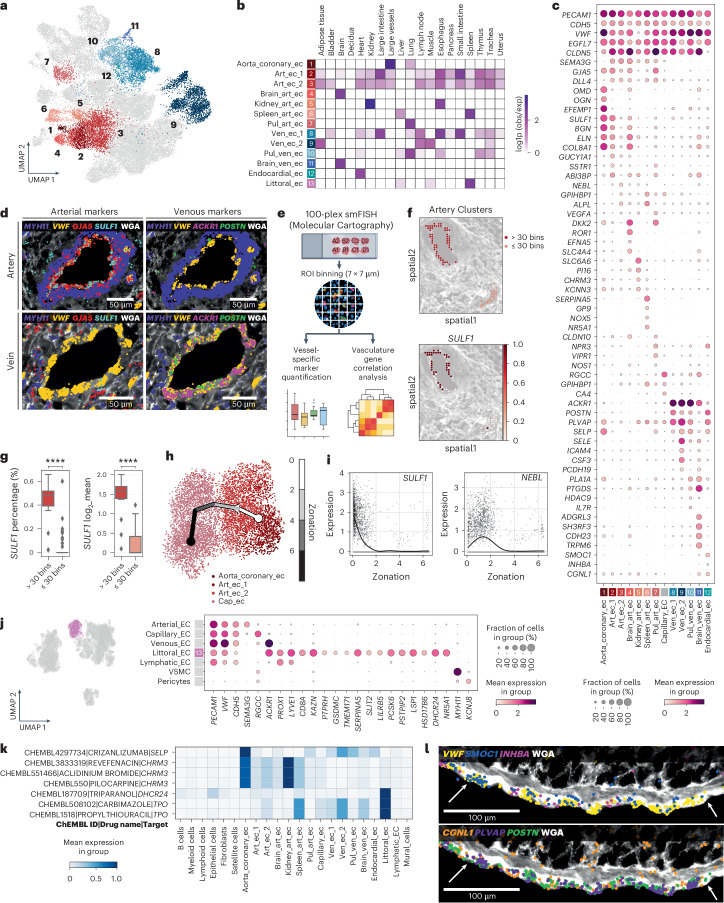
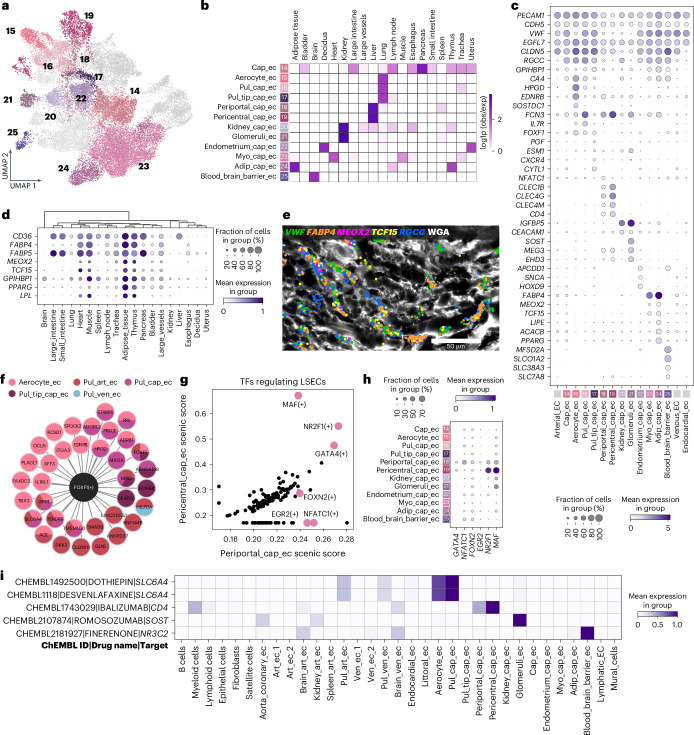
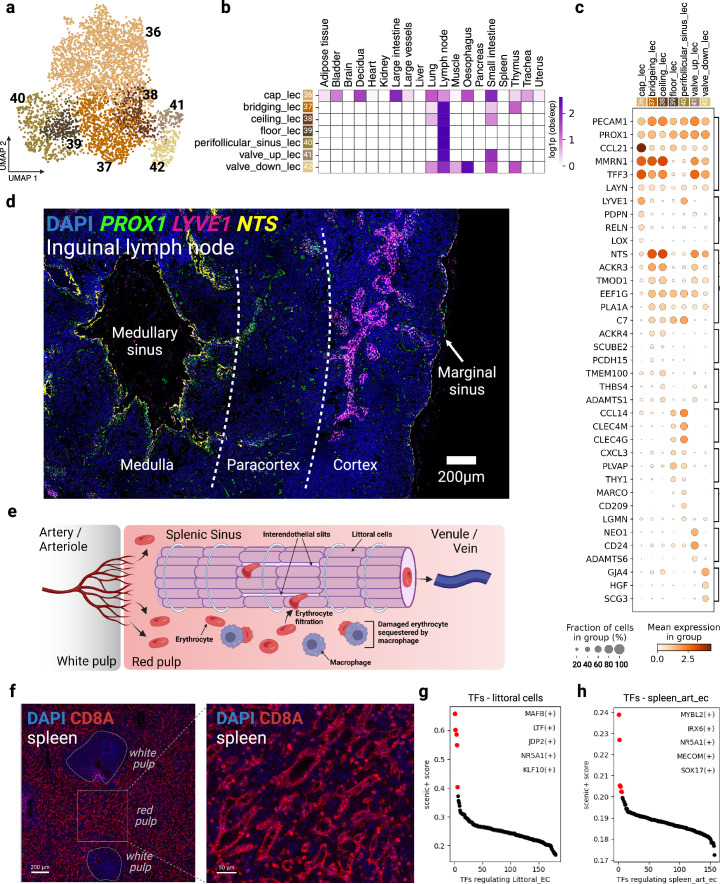
The human vascular system, comprising endothelial cells (ECs) and mural cells, covers a vast surface area in the body, providing a critical interface between blood and tissue environments. Functional differences exist across specific vascular beds, but their molecular determinants across tissues remain largely unknown. In this study, we integrated single-cell transcriptomics data from 19 human organs and tissues and defined 42 vascular cell states from approximately 67,000 cells (62 donors), including angiotypic transitional signatures along the arterial endothelial axis from large to small caliber vessels. We also characterized organotypic populations, including splenic littoral and blood-brain barrier ECs, thus clarifying the molecular profiles of these important cell states. Interrogating endothelial-mural cell molecular crosstalk revealed angiotypic and organotypic communication pathways related to Notch, Wnt, retinoic acid, prostaglandin and cell adhesion signaling. Transcription factor network analysis revealed differential regulation of downstream target genes in tissue-specific modules, such as those of FOXF1 across multiple lung vascular subpopulations. Additionally, we make mechanistic inferences of vascular drug targets within different vascular beds. This open-access resource enhances our understanding of angiodiversity and organotypic molecular signatures in human vascular cells, and has therapeutic implications for vascular diseases across tissues.


Conflict of interest statement

Competing interests: In the past 3 years, S.A.T. has consulted for or been a member of scientific advisory boards (SABs) at Qiagen, OMass Therapeutics, Xaira Therapeutics and ForeSite Labs, and a non-executive director of 10x Genomics. She is a co-founder and equity holder of TransitionBio and Ensocell, and a part-time employee at GSK. R.E. is a co-founder and equity holder in Ensocell. The other authors declare no competing interests.

Figures

Fig. 1
Fig. 1. Overview of multi-organ vascular cell atlas.
a, Organ and tissue single-cell RNA-seq datasets used for analysis. b, UMAP representation of all cell types from the global integrated object, including vascular and non-vascular types. c, Dot plot representation of selected EC and mural cell marker genes and markers of other major cell types identified in the global cell type object. d,e, smFISH for TINAGL1 (scale bar, 50 μm) in ileum and skeletal muscle with nuclear counterstain (DAPI) (d) and quantification of TINAGL1 co-expression with ACTA2 (VSMC) and CDH5 (EC) (n = 3 regions of interest (ROIs) × 3 donors) (e). Statistical analysis was performed using the Wilcoxon rank-sum test with Benjamini–Hochberg adjustment. * adjusted P < 0.05; *** adjusted P < 0.001. Error bars indicate standard error. f, UMAP representation of broad vascular cell types subset from the global integrated object. g, Dot plot representation of selected marker genes for major cell states within the vascular compartment. h, Dendrogram of hierarchical clustering of EC populations subset per organ. Top color bar: organ. Bottom color bar: EC subtype. The illustration in a was created with BioRender.
Fig. 2
Fig. 2. Endothelial heterogeneity in arteries and veins across tissues.
a, UMAP representation of arterial, venous and endocardial cell states identified across blood ECs from all tissues. b, Heatmap representation of cell state enrichment per tissue. c, Dot plot representation of transcriptional signatures of arterial, venous and endocardial EC states. d, Multiplexed smFISH data visualization of arterial EC (GJA5, SULF1) and venous EC (ACKR1, POSTN) markers in an artery and vein. MYH11 was used as a VSMC marker, and VWF as an EC marker. Tissues were counterstained with wheat germ agglutinin (WGA) to delineate cell membranes. e, Schematic for binning individual ROIs and downstream analysis. f, Expression of SULF1 in arteries of different caliber using multiplexed smFISH. Top, spatial plot showing two arteries. Bottom, SULF1 expression within different arterial vessels. Color bar represents gene counts present (1) or absent (0) in individual bins. g, Box plot representation of SULF1 expression within larger (>30 bins) and smaller (≤30 bins) caliber arteries across all ROIs captured using multiplexed smFISH. Left, percentage of bins expressing SULF1. Right, mean expression of SULF1 (expressing bins only). n = 90 vessels, 8 sections, 1 donor. Statistical analysis was performed using the Wilcoxon rank-sum test with Benjamini–Hochberg adjustment. **** adjusted P < 0.0001. For box plots in g, the center line shows the median; the box limits represent the 25th and 75th percentiles; the whiskers show the minimum and maximum values; and the dots represent potential outliers. h, Trajectory inference showing zonation patterning of arterial and capillary populations. i, Expression of SULF1 and NEBL along the inferred zonation axis. j, UMAP (left) highlights the littoral EC cluster, and dot plot (right) representations selected marker genes of littoral ECs. k, Matrix plot visualization of cell state targets of drugs identified using drug2cell. l, Multiplexed smFISH data visualization of EC marker VWF, and SMOC1, INHBA, CGNL1, PLVAP and POSTN expression in endocardial ECs. White arrows indicate the endocardial layer. Scale bars, 100 µm. The illustration in e was created with BioRender.
Fig. 3
Fig. 3. Endothelial heterogeneity within the microvasculature.
a, UMAP representation of capillary cell states identified across blood ECs from all tissues. b, Heatmap representation of cell state enrichment per tissue. c, Dot plot representation of signatures of capillary EC states. d, Dot plot shows expression of genes encoding proteins involved in fatty acid metabolism within the capillary EC compartment of tissues. e, Multiplexed smFISH analysis in cardiac atrial samples showing fatty acid processing related gene markers (MEOX2, FABP4 and TCF15) in cardiac capillary ECs (RGCC), with EC marker VWF and WGA counterstaining for cell membranes. f, Downstream targets of lung-specific FOXF1 (black) across pulmonary EC populations. g, Transcription factor enrichment (SCENIC score) of liver periportal (x axis) and pericentral (y axis) capillary EC populations. h, Dot plot shows expression of genes encoding liver pericentral and periportal transcription factors across all capillary EC states. i, Matrix plot visualization of inferred capillary EC targets of drugs identified using drug2cell. LSEC, liver sinusoidal endothelial cell; TF, transcription factor.
Fig. 4
Fig. 4. Pericyte and SMC heterogeneity across the human vascular bed.
a, Dendrogram of hierarchical clustering of mural cell populations subset per organ. Top color bar: organ. Bottom color bar: mural subtype. b, UMAP representation of mural cell states identified across all tissues. c, Heatmap representation of cell state enrichment per tissue. d, Dot plot representation of transcriptional signatures of VSMC and pericyte cell states. e, Multiplexed smFISH analysis showing RERGL expression in arterial VSMCs (MYH11+). Expression of EC marker VWF, arterial and venous EC markers SEMA3G and ACKR1, respectively, are shown. WGA was used for cell membrane counterstain. f, Box plot representation of RERGL expression within arteries and veins across all ROIs captured using multiplexed smFISH. Left, percentage of bins per arterial or venous VSMC cluster expressing RERGL. Right, mean expression of RERGL in arterial and venous VSMCs (expressing bins only). n = 297 vessels, 8 sections, 1 donor. Statistical analysis was performed using the Wilcoxon rank-sum test with Benjamini–Hochberg adjustment. **** adjusted P < 0.0001. g, Multiplexed smFISH analysis of smc_pc_intermediate markers STEAP4 and FGF7 co-expressed with VSMC marker MYH11 and pericyte marker KCNJ8 around an ACKR1+ vein. Absence of arterial EC marker SEMA3G confirms venous identity. WGA was used for cell membrane counterstain. h, Box plot representation of STEAP4 expression within arterial and venous VSMCs across all ROIs captured using multiplexed smFISH. Left, percentage of bins per arterial or venous VSMC cluster expressing STEAP4. Right, mean expression of STEAP4 in arteries and veins (expressing bins only). n = 297 vessels, 8 sections, 1 donor. Statistical analysis was performed using the Wilcoxon rank-sum test with Benjamini–Hochberg adjustment. **** adjusted P < 0.0001. For box plots in f and h, the center line shows the median; the box limits represent the 25th and 75th percentiles; the whiskers show the minimum and maximum values; and the dots represent potential outliers. i, Dot plot representation of STEAP4 co-expression with VSMC marker MYH11 and pericyte marker KCNJ8.
Fig. 5
Fig. 5. Organ-specific signaling between ECs and mural cells.
a, LR interactions in VEGFA and RA signaling between ECs and mural cells in arteries. The y axis shows specific LR pairs. Dot size and color represent scaled average gene expression, with red circles indicating significant interactions (P < 0.05) as calculated using CellPhoneDB. b,c, Dot plot showing gene expression of LRs involved in the VEGFA (b) and RA (c) pathway, and schematics summarizing cell–cell interactions. d, LR interactions in the WNT pathway between ECs and mural cells in microvasculature. y axis shows specific LR pairs. Dot size and color represent scaled average gene expression, with red circles for significant interactions (P < 0.05) as calculated using CellPhoneDB. e, Dot plot showing gene expression of LRs involved in WNT signaling and schematic summarizing cell–cell interactions. f, LR interactions in the prostaglandin (PTG) signaling pathway between ECs and mural cells in microvasculature. The y axis shows specific LR pairs. Dot size and color represent scaled average gene expression, with red circles for significant interactions (P < 0.05) as calculated using CellPhoneDB. PTGES, prostaglandin E synthase. g, Dot plot of LR gene expression and schematic of PTG intercellular signaling. PGH2, prostaglandin H2. The illustrations in ag were created with BioRender.
Extended Data Fig. 1
Extended Data Fig. 1. Integration of scRNA- seq data and vascular cell type markers.
a, smFISH staining for EC markers CDH5 and EGFL7, as well as mural cell markers ACTA2 and MYLK in ileum and skeletal muscle tissue. Nuclei were counterstained with DAPI. Scale bars = 50 μm. b, UMAP representation of integrated organ datasets. c, UMAP representation of integrated individual datasets. d, Dotplot representation of vascular cell type gene markers. Fraction of expressing cells and average expression within each cell type is indicated by dot size and colour, respectively. e, UMAP representation of all endothelial and mural cell states. f, Heatmap representation of marker genes of all 42 vascular cell states identified in this study, with colour indicating mean gene expression per cell type.
Extended Data Fig. 2
Extended Data Fig. 2. Characterisation of vascular EC using multiplexed-smFISH (Molecular CartographyTM).
a, Multiplexed-smFISH visualisation of major cell type gene markers, including ECs (CDH5, VWF, CCL21), VSMC and pericytes (MYH11 and KCNJ8, respectively), cardiomyocytes (TTN), fibroblasts (PDGFRA), myeloid cells (C1QA) and lymphoid cells (CD8A). b, WGA / DAPI staining for cell membranes and nuclei, respectively, on sections used for multiplexed-smFISH. Scale bars in (a) and (b) represent 200μm. c, Violin plot representation of n_genes/bin and n_counts/bin. d, Correlation heatmap with dendrogram of gene markers of vascular cells used for multiplexed- smFISH. Scale bar indicates correlation value calculated using Pearson correlation. Red = positive correlation. Blue = negative correlation. White = no correlation. e, Correlation of SULF1 scaled expression by arterial vessel size (#bins / vessel). f, Subsetting of individual venous clusters and spatially resolved expression of venous marker SELE. Colour bar represents scaled gene counts per bin. g, Spatially resolved expression of endocardial markers VWF, SMOC1, INHBA and PLVAP. Colour bar represents scaled gene counts per bin.
Extended Data Fig. 3
Extended Data Fig. 3. Characterisation of arterial, endocardial and capillary EC subpopulations.
a, smFISH staining for SULF1 (red - top panel) and b, ELN (magenta - bottom panel) with SEMA3G (yellow) in arterial EC. Nuclei were counterstained with DAPI. Scale bars = 40 μm c, UMAP representation of individual arterial EC populations after integration for trajectory inference (as shown in Fig. 2h). d, UMAP representation of SULF1 (left) and NEBL (right) gene expression on integrated object used for trajectory inference. Scale bar represents log1p transformed gene expression values. e & f, UMAPs (left) show specific zonation signatures, and heatmaps (right) represent differentially expressed genes determined within specific zonation segments, including aorta_coronary_ec to art_ec_1 (e) and art_ec_1 to art_ec_2 (f). g, Regulon plots showing the SCENIC ranking of transcription factors for endocardial ECs with the top 5 transcription factors highlighted.
Extended Data Fig. 4
Extended Data Fig. 4. EC heterogeneity of lymphatics and lymphoid organs.
a, UMAP representation of lymphatic EC states. b, Heatmap representation of cell state enrichment per tissue. c, Dotplot representation of lymphatic EC state gene markers. Fraction of expressing cells and average expression within each cell type is indicated by dot size and colour, respectively. d, smFISH representation of expression of PROX1, LYVE1 and NTS in inguinal lymph node tissue. Nuclei were counterstained with DAPI. Scale bar = 200 μm. e, Schematic representation of splenic circulation. f, Immunostaining (Rarecyte) for CD8A in spleen tissue. DAPI was used for nuclei counterstaining. Scale bar = 200 um (left) and 50 um (right). g & h, Regulon plots showing the SCENIC ranking of transcription factors for littoral cells (g) and splenic arterial EC (h), with the top 5 transcription factors highlighted. The illustration in (e) was created with BioRender.com.
Extended Data Fig. 5
Extended Data Fig. 5. Capillary EC characterisation.
a, Quantification of fatty acid related gene markers across arterial (art_ec, GJA5+/VWF+), capillary (cap_ec, RGCC+/VWF+) and venous (ven_ec, ACKR1+/VWF+) EC using multiplexed-smFISH. n = 8 sections, 1 donor. Statistical analysis was performed using the Wilcoxon Rank Sum Test with Benjamini-Hochberg adjustment. ns = not significant. ** = adjusted p value <0.01. *** = adjusted p value < 0.001. **** = adjusted p value < 0.0001. For box plots in a, the centre line shows the median, the box limits represent the 25th and 75th percentiles, the whiskers show the minimum and maximum values, and the dots represent potential outliers. b, Dotplot shows expression of FOXF1 downstream targets genes across lung EC populations. Fraction of expressing cells and average expression within each cell type is indicated by dot size and colour, respectively. c & d, H&E staining and cell2location predicted cell abundance (5% percentile) of uterine vascular cell states (uterine_pc, uterine_smc, and endometrium_cap_ec) in the endometrium and myometrium location of the uterus in the (c) proliferative state, and (d) secretory state. Scale bars = 1 mm.
Extended Data Fig. 6
Extended Data Fig. 6. Prediction of EC cell states in single-nuclei datasets.
a, Schematic diagram of the integration of endothelial cells (ECs) from this single-cell study and published single-nuclei studies from corresponding organs. b - e, UMAP representation of (b) organs, (c) nuclei dataset source, (d) suspension type, and (e) CellTypist predicted states. f, Percentage proportion of EC state predictions from cells or nuclei. g, Dotplot of marker gene expression in predicted ECs. Fraction of expressing cells average expression within each cell type is indicated by dot size and colour, respectively. The illustration in (a) was created with BioRender.com.
Extended Data Fig. 7
Extended Data Fig. 7. Prediction of mural cell states in single- nuclei datasets.
a, Schematic diagram of the integration of mural cells from this single-cell study and published single-nuclei studies from corresponding organs. b - e, UMAP representation of integrated (b) organs, (c) nuclei dataset source, (d) suspension type, and (e) CellTypist predicted states. f, Percentage of mural cell state predictions from cells or nuclei. g, Dotplot of marker gene expression in predicted mural cell states. Fraction of expressing cells and average expression within each cell type is indicated by dot size and colour, respectively. The illustration in (a) was created with BioRender.com.
Extended Data Fig. 8
Extended Data Fig. 8. Spatial validation of interacting cell pairs in the heart.
a, Approach to obtaining relevant cell-cell interactions using non-negative matrix factorisation (NMF) coupled with manual annotation of spatial transcriptomic data. b, NMF analysis demonstrating cellular microenvironments. Colour density = loading of the corresponding cell type for the specific NMF factor. c & d, Example of manual annotation of arteries (c) and veins (d) using heart spatial transcriptomics data. e & f, Odds ratio analysis of enriched cell types within manually annotated arteries (e) and veins (f). Significant cell type enrichment is highlighted in green, with p values < 0.05. Error bars in (e) and (f) indicate the 10% confidence interval. The illustration in (a) was created with BioRender.com.
Extended Data Fig. 9
Extended Data Fig. 9. Organotypic intercellular signalling between endothelial and mural cells.
a & b, Ligand-receptor (LR) pairs grouped by pathways in arteries (a) and veins (b). c, Dotplot shows expression of genes encoding factors involved in beta nerve growth factor in arterial microenvironments. Fraction of expressing cells and average expression within each cell type is indicated by dot size and colour, respectively. d, LR pairs grouped by pathways in microvasculature. Dot size is the absolute number of LR pairs in a pathway and the colour is the normalised number of LR pairs within a pathway. e, Dotplot shows expression of genes encoding factors involved in androgen signalling in capillary microenvironments. Fraction of expressing cells and average expression within each cell type is indicated by dot size and colour, respectively. l.int = large intestine, s.int = small intestine, l. node = lymph node, adip.t = adipose tissue, mus. = muscle, oesop. = oesophagus, decid. = decidua, thym. = thymus, panc. = pancreas. The illustrations in (a), (b) and (d) were created with BioRender.com.

References

    1. Augustin, H. G. & Koh, G. Y. Organotypic vasculature: from descriptive heterogeneity to functional pathophysiology. Science357, eaal2379 (2017). - PubMed
    1. Konradt, C. & Hunter, C. A. Pathogen interactions with endothelial cells and the induction of innate and adaptive immunity. Eur. J. Immunol.48, 1607–1620 (2018). - PMC - PubMed
    1. Qiang, Y. et al. Microfluidic study of retention and elimination of abnormal red blood cells by human spleen with implications for sickle cell disease. Proc. Natl Acad. Sci. USA120, e2217607120 (2023). - PMC - PubMed
    1. Holm, A., Heumann, T. & Augustin, H. G. Microvascular mural cell organotypic heterogeneity and functional plasticity. Trends Cell Biol.28, 302–316 (2018). - PubMed
    1. Muhl, L. et al. A single-cell transcriptomic inventory of murine smooth muscle cells. Dev. Cell57, 2426–2443 (2022). - PubMed

LinkOut - more resources