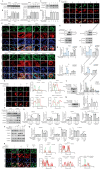
. 2025 Mar;58(3):e13774.
doi: 10.1111/cpr.13774. Epub 2024 Nov 20.

Targeting Hsp90α to inhibit HMGB1-mediated renal inflammation and fibrosis

Affiliations

Targeting Hsp90α to inhibit HMGB1-mediated renal inflammation and fibrosis

Huizhi Wei et al. Cell Prolif. 2025 Mar.

Abstract

Renal fibrosis, a terminal manifestation of chronic kidney disease, is characterized by uncontrolled inflammatory responses, increased oxidative stress, tubular cell death, and imbalanced deposition of extracellular matrix. 5,2'-Dibromo-2,4',5'-trihydroxydiphenylmethanone (LM49), a polyphenol derivative synthesized by our group with excellent anti-inflammatory pharmacological properties, has been identified as a small-molecule inducer of extracellular matrix degradation. Nonetheless, the protective effects and mechanisms of LM49 on renal fibrosis remain unknown. Here, we report LM49 could effectively alleviate renal fibrosis and improve filtration function. Furthermore, LM49 significantly inhibited macrophage infiltration, pro-inflammatory cytokine production and oxidative stress. Interestingly, in HK-2 cells induced by tumour necrosis factor alpha under oxygen-glucose-serum deprivation conditions, LM49 treatment similarly yielded a reduced inflammatory response, elevated cellular viability and suppressed cell necrosis and epithelial-to-mesenchymal transition. Notably, LM49 prominently suppressed the high-mobility group box 1 (HMGB1) expression, nucleocytoplasmic translocation and activation. Mechanistically, drug affinity responsive target stability and cellular thermal shift assay confirmed that LM49 could interact with the target heat shock protein 90 alpha family class A member 1 (Hsp90α), disrupting the direct binding of Hsp90α to HMGB1 and inhibiting the nuclear export of HMGB1, thereby suppressing the inflammatory response, cell necrosis and fibrogenesis. Furthermore, molecular docking and molecular dynamic simulation revealed that LM49 occupied the N-terminal ATP pocket of Hsp90α. Collectively, our findings show that LM49 treatment can ameliorate renal fibrosis through inhibition of HMGB1-mediated inflammation and necrosis via binding to Hsp90α, providing strong evidence for its anti-inflammatory and anti-fibrotic actions.


Conflict of interest statement

The authors declare no conflicts of interest.

Figures
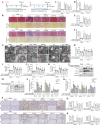
FIGURE 1
FIGURE 1
5,2′‐Dibromo‐2,4′,5′‐trihydroxydiphenylmethanone (LM49) ameliorates unilateral ureteral obstruction (UUO)‐ and folic acid (FA)‐induced renal fibrosis and filtration function. (A) The scheme of LM49 treatment in UUO‐induced rats and FA‐induced mice were illustrated. (B) Representative kidney cross‐sections stained with Masson's trichrome (Scale bar, 50 μm) or picrosirius red (Scale bar, 50 μm), ×200. (C, D) Statistical results for fibrosis area ([C] Masson's trichrome) and interstitial collagen quantification ([D] picrosirius red) in the kidneys of UUO rats in (D) analysed by Image Pro‐Plus software (mean ± SD, n = 3 per group, ## p < 0.01 vs. sham group; *p < 0.05, **p < 0.01 vs. UUO group). (E, F) Statistical results for fibrosis area ([E] Masson's trichrome) and interstitial collagen quantification ([F] picrosirius red) in the kidneys of FA mice in (B) analysed by Image Pro‐Plus software (mean ± SD, n = 3, ## p < 0.01 vs. control group; *p < 0.05, **p < 0.01 vs. FA group). (G) Representative transmission electron microscope (TEM) images of glomerular basement membrane (red arrow) and the foot process (blue arrow) in kidney glomerulus, n = 3. Scale bar, 5 μm. (H, I) Effect of LM49 or losartan on UUO‐induced serum creatinine (Scr) (H) or serum blood urea nitrogen (BUN) (I) levels (mean ± SD, n = 6 per group, ## p < 0.01 vs. sham group; *p < 0.05, **p < 0.01 vs. UUO group). (J, K) Effect of LM49 or losartan on FA‐induced Scr (J) or serum BUN (K) levels (mean ± SD, n = 6 per group, ## p < 0.01 vs. control group; *p < 0.05, **p < 0.01 vs. FA group). (L–O) Western blot (L, M) and quantitative analysis (N, O) for alpha‐smooth muscle actin (α‐SMA), fibronectin and COL1 expression levels of kidney tissue lysates in UUO rats or FA mice (mean ± SD, n = 3, # p < 0.05, ## p < 0.01 vs. sham or control group; *p < 0.05, **p < 0.01 vs. UUO or FA group). (P) Representative kidney cross‐sections stained with immunohistochemical staining with COL1 or FN (Scale bar, 50 μm), ×200. (Q, R) Quantification of immunohistochemical staining of COL1 or FN in the kidneys from UUO rats (Q) or FA mice (R) (mean ± SD, n = 3, ## p < 0.01 vs. sham or control group; *p < 0.05, **p < 0.01 vs. UUO or FA group).
FIGURE 2
FIGURE 2
5,2′‐Dibromo‐2,4′,5′‐trihydroxydiphenylmethanone (LM49) treatment effectively attenuates unilateral ureteral obstruction (UUO)‐ and folic acid (FA)‐induced inflammation in fibrotic kidneys. (A) Representative kidney cross‐sections stained with haematoxylin and eosin (HE) in UUO rats or FA mice (Scale bar, 50 μm), ×200, immunohistochemical staining with CD68 in UUO rats or F4/80 in FA mice (Scale bar, 50 μm), ×200. (B) Morphometric analysis assessing tubulointerstitial inflammation index and tubular necrosis scores in UUO‐induced kidneys (mean ± SD, n = 3, ## p < 0.01 vs. sham group; *p < 0.05, **p < 0.01 vs. UUO group). (C) Morphometric analysis assessing tubulointerstitial inflammation index and tubular necrosis scores in FA‐induced kidneys (mean ± SD, n = 3, ## p < 0.01 vs. control group; *p < 0.05, **p < 0.01 vs. FA group). (D) Quantification of immunohistochemical staining of macrophages biomarkers CD68 in kidneys from UUO rats or F4/80 in kidneys from FA mice (mean ± SD, n = 3, ## p < 0.01 vs. sham or control group; *p < 0.05, **p < 0.01 vs. UUO or FA group). (E) Representative images of schematic diagram of the loop gate for detecting the number of total leukocytes and macrophages in the kidney using flow cytometry. (F) Quantitative results of the effect of LM49 on the number of total leukocytes and macrophages in kidneys of UUO rats or FA mice (mean ± SD, n = 3, # p < 0.05 vs. sham or control group; *p < 0.05 vs. UUO or FA group). (G) mRNA expression levels of proinflammatory factor interleukin‐1β (IL‐1β), tumour necrosis factor‐α (TNF‐α), and IL‐6 in fibrotic kidneys (mean ± SD, n = 3, ## p < 0.01 vs. sham or control group; *p < 0.05, **p < 0.01 vs. UUO or FA group). (H) mRNA expression levels of chemokines monocyte chemoattractant protein‐1 (MCP‐1) in fibrotic kidneys (mean ± SD, n = 3, ## p < 0.01 vs. sham or control group; *p < 0.05, **p < 0.01 vs. UUO or FA group). (I, J) malondialdehyde (MDA) levels and superoxide dismutase (SOD) levels of kidneys from each group in UUO rats or FA mice (mean ± SD, n = 6 per group, ## p < 0.01 vs. sham or control group; *p < 0.05, **p < 0.01 vs. UUO or FA group).
FIGURE 3
FIGURE 3
5,2′‐Dibromo‐2,4′,5′‐trihydroxydiphenylmethanone (LM49) treatment diminishes tubular epithelial cells necroinflammation and inhibits the nucleocytoplasmic translocation and release of high‐mobility group box 1 (HMGB1) in fibrotic kidneys. (A) Venn diagram suggesting the number of differentially expressed genes, the number of upregulated genes and downregulated genes in kidneys of rats (sham rats, LM49‐treated unilateral ureteral obstruction [UUO] rats) compared with UUO rats. (B) Gene Ontology (GO) analysis of the differential genes in kidneys from UUO rats versus sham rats. (C) GO analysis of the differential genes in kidneys from UUO rats versus LM49‐treated UUO rats. (D) Heat map of differentially expressed genes related to inflammation and necrosis in UUO rats versus LM49‐treated UUO rats. (E) Representative images of TUNEL staining of kidney sections. TUNEL signal (green) and DAPI (blue) were shown. (F) Quantitative analysis of TUNEL‐positive cells in fibrotic kidneys of UUO rats and FA mice, mean ± SD, n = 3, ## p < 0.01 versus sham or control group; *p < 0.05, **p < 0.01 versus UUO or FA group. (G) Representative electron micrographs of tubular necrotic cells (red arrow) and mitochondrial damage (blue arrow) in proximal tubular cells. n = 3. Scale bar = 5 μm. (H, I) Western blotting (H) and quantitative results (I) of HMGB1 in kidneys of UUO rats or FA mice (mean ± SD, n = 3, ## p < 0.01 vs. sham or control group; *p < 0.05, **p < 0.01 vs. UUO or FA group). (J) Immunofluorescence staining of HMGB1 (red) in kidneys of UUO rats or FA mice, Scale bars, 50 μm, ×400. (K) Western blotting of the nuclear and cytoplasmic HMGB1 levels in fibrotic kidneys of UUO rats or FA mice, n = 4 per group. (L) HMGB1 levels in plasmas of UUO rats or FA mice were measured using ELISA (mean ± SD, n = 6, ## p < 0.01 vs. sham or control group; *p < 0.05, **p < 0.01 vs. UUO or FA group). (M) mRNA expression levels of Toll‐like receptor (TLR)‐2, TLR‐4 and receptor for advanced glycation end products (RAGE) in kidneys of UUO rats or FA mice.
FIGURE 4
FIGURE 4
5,2′‐Dibromo‐2,4′,5′‐trihydroxydiphenylmethanone (LM49) protects tubular epithelial cells treated with tumour necrosis factor alpha for 12 h under oxygen–glucose‐serum deprivation conditions (TNF‐α/OGSD) against necroinflammation and epithelial‐to‐mesenchymal transition in vitro. (A) Effect of LM49 alone on HK‐2 cells viability (mean ± SD, n = 3, *p < 0.05, **p < 0.01 vs. control). (B, C) Representative images (B) and quantification (C) of Hoechst/propidium iodide (PI) staining, Scale bars, 100 μm (mean ± SD, n = 3, ## p < 0.01 vs. control; **p < 0.01 vs. model). (D) HK‐2 cells viability treated with LM49 in the absence or presence of 20 ng/mL TNF‐α/OGSD (mean ± SD, n = 3, ## p < 0.01 vs. control; *p < 0.05, **p < 0.01 vs. model). (E) Lactate dehydrogenase (LDH) release of HK‐2 cells treated with LM49 in the absence or presence of TNF‐α/OGSD for 12 h (mean ± SD, n = 3, ## p < 0.01 vs. control; **p < 0.01 vs. model). (F, G) mRNA expression levels of proinflammatory factor interleukin (IL)‐1β, TNF‐α and IL‐6 (F) and chemokines monocyte chemoattractant protein‐1 (MCP‐1) (G) in HK‐2 cells treated with LM49 in the absence or presence of TNF‐α/OGSD for 12 h (mean ± SD, n = 3, ## p < 0.01 vs. control; *p < 0.05, **p < 0.01 vs. model). (H, I) Western blotting (H) and quantitative results (I) of E‐cadherin and alpha‐smooth muscle actin (α‐SMA) in the HK‐2 cells treated with LM49 in the absence or presence of TNF‐α/OGSD for 12 h (mean ± SD, n = 3, ## p < 0.01 vs. control; *p < 0.05 vs. model).
FIGURE 5
FIGURE 5
5,2′‐Dibromo‐2,4′,5′‐trihydroxydiphenylmethanone (LM49) protects tubular epithelial cells (TECs) and inhibits epithelial‐to‐mesenchymal transition through blocking high‐mobility group box 1 (HMGB1) in vitro. (A, B) Western blotting (A) and quantitative results (B) of HMGB1 in HK‐2 cells treated with LM49 in the absence or presence of tumour necrosis factor alpha for 12 h under the conditions of oxygen–glucose‐serum deprivation (TNF‐α/OGSD) for 12 h (mean ± SD, n = 3, ## p < 0.01 vs. control; *p < 0.05, **p < 0.01 vs. model). (C) Western blotting results of the nuclear and cytoplasmic HMGB1 levels in HK‐2 cells treated with LM49 in the absence or presence of TNF‐α/OGSD for 12 h, n = 4. (D, E) Representative fluorescence images (D) and quantitative results (E) of HMGB1 in HK‐2 cells treated with LM49 in the absence or presence of TNF‐α/OGSD for 12 h. Scale bar, 20 μm, ×200. (F) ELISA analysed the levels of HMGB1 in the extracellular supernatants of HK‐2 cells treated with LM49 in the absence or presence of TNF‐α/OGSD for 12 h. n = 3. (G) Co‐immunoprecipitation analysis of the acetylated HMGB1 levels in HK‐2 cells treated with LM49 in the absence or presence of TNF‐α/OGSD for 12 h. (H, I) Representative immunofluorescence images (H) and quantitative results (I) of HMGB1 in HK‐2 cells treated with LM49 or HMGB1 inhibitor Glycyrrhetinic acid (GA) in the absence or presence of TNF‐α/OGSD for 12 h (mean ± SD, n = 3, ## p < 0.01 vs. Control; **p < 0.01 vs. model), Scale bar, 20 μm, ×200. (J, K) Representative images (J) and quantification (K) of Hoechst/propidium iodide (PI) staining in HK‐2 cells treated with LM49 or GA in the absence or presence of TNF‐α/OGSD for 12 h (mean ± SD, n = 3, ## p < 0.01 vs. control; **p < 0.01 vs. model), Scale bar, 100 μm, ×200. (L) HK‐2 cells viability in HK‐2 cells treated with LM49 or GA in the absence or presence of TNF‐α/OGSD for 12 h (mean ± SD, n = 3, # p < 0.05 vs. control; *p < 0.05 vs. model). (M) Lactate dehydrogenase (LDH) release in HK‐2 cells treated with LM49 or GA in the absence or presence of TNF‐α/OGSD for 12 h (mean ± SD, n = 3, ## p < 0.01 vs. control; **p < 0.01 vs. model). (N) mRNA expression levels of IL‐1β, TNF‐α, IL‐6, and monocyte chemoattractant protein‐1 (MCP‐1) in HK‐2 cells treated with LM49 or GA in the absence or presence of TNF‐α/OGSD for 12 h (mean ± SD, n = 3, ## p < 0.01 vs. control; **p < 0.01 vs. model). (O, P) Western blotting (O) and quantitative results (P) of E‐cadherin, alpha‐smooth muscle actin (α‐SMA) and HMGB1 in HK‐2 cells treated with LM49 or GA in the absence or presence of TNF‐α/OGSD for 12 h (mean ± SD, n = 3, ## p < 0.01 vs. control; *p < 0.05, **p < 0.01 vs. model). (Q) mRNA expression levels of monocyte chemoattractant protein‐1 (MCP‐1), interleukin (IL)‐1β, and IL‐6 in DMSO‐ or LM49‐treated HK‐2 cells transfected with pcDNA 3.1 or pcDNA 3.1‐HMGB1 in the absence or presence of TNF‐α/OGSD for 12 h (mean ± SD, n = 3, *p < 0.05, **p < 0.01). (R) Cell viability in DMSO‐ or LM49‐treated HK‐2 cells transfected with pcDNA 3.1 or pcDNA 3.1‐HMGB1 in the absence or presence of TNF‐α/OGSD for 12 h (mean ± SD, n = 3, *p < 0.05, **p < 0.01). (S) Lactate dehydrogenase (LDH) release in DMSO‐ or LM49‐treated HK‐2 cells transfected with pcDNA 3.1 or pcDNA 3.1‐HMGB1 in the absence or presence of TNF‐α/OGSD for 12 h (mean ± SD, n = 3, *p < 0.05, **p < 0.01). (T, U) Western blotting (T) and quantitative results (U) of HMGB1, E‐cadherin and α‐SMA in DMSO‐ or LM49‐treated HK‐2 cells transfected with pcDNA 3.1 or pcDNA 3.1‐HMGB1 in the absence or presence of TNF‐α/OGSD for 12 h (mean ± SD, n = 3, *p < 0.05, **p < 0.01).
FIGURE 6
FIGURE 6
5,2′‐Dibromo‐2,4′,5′‐trihydroxydiphenylmethanone (LM49) inhibits the nucleocytoplasmic translocation of high‐mobility group box 1 (HMGB1) via targeting heat shock protein 90 alpha family class A member 1 (Hsp90α). (A) Western blotting of Hsp90α in kidneys of unilateral ureteral obstruction (UUO) rats or folic acid (FA) mice. (B) Quantitative results of Hsp90α intensity in (A) (mean ± SD, n = 3, ## p < 0.01 vs. sham rats or control mice). (C) Western blotting of Hsp90α in HK‐2 cells treated with LM49 in the absence or presence of tumour necrosis factor alpha for 12 h under the conditions of oxygen–glucose‐serum deprivation (TNF‐α/OGSD) for 12 h. (D) Quantitative results of Hsp90α intensity in (C) (mean ± SD, n = 3, ## p < 0.01 vs. control cell group). (E) Representative image of immunofluorescence staining double‐positive cells of Hsp90α (red) and HMGB1 (green) in the kidneys of UUO rats or FA mice. Scale bars, 50 μm. (F) Representative images of immunofluorescence staining double‐positive cells of Hsp90α (red) and HMGB1(green) in HK‐2 cells treated with LM49 in the absence or presence of TNF‐α/OGSD for 12 h. Scale bars, 20 μm. (G, H) Co‐immunoprecipitation of Hsp90α with HMGB1 (G) and quantitative results (H) of Hsp90α and HMGB1 intensity in HK‐2 cells treated with TNF‐α/OGSD in the absence or presence of LM49 for 12 h. (I, J) Co‐immunoprecipitation of Hsp90α with HMGB1 (I) and quantitative results of Hsp90α and HMGB1 intensity (J) in kidney tissues of sham, UUO and UUO + LM49 (90 mg/kg/day). Three independent experiments were performed. (K) Representative immunofluorescence images and fluorescence intensity of Hsp90α (red) and HMGB1 (green) in HK‐2 cells treated with LM49 or Hsp90α inhibitor geldanamycin in the absence or presence of TNF‐α/OGSD for 12 h, Image J software was used for statistics. Scale bars = 20 μm. n = 3 samples per group. (L) Western blotting and quantitative results of alpha‐smooth muscle actin (α‐SMA), E‐cadherin and HMGB1 in HK‐2 cells treated with LM49 or geldanamycin in the absence or presence of TNF‐α/OGSD for 12 h (mean ± SD, n = 3, ## p < 0.01 vs. control; *p < 0.05, **p < 0.01 vs. model). (M) Western blotting and quantitative results of cytoplasmic HMGB1 in HK‐2 cells treated with LM49 or geldanamycin in the absence or presence of TNF‐α/OGSD for 12 h (mean ± SD, n = 3, ## p < 0.01 vs. control; *p < 0.05 vs. model). (N, O) Immunoblot analysis (N) and quantitative results (O) of the protein expression levels of HMGB1, α‐SMA and E‐cadherin in DMSO‐ or LM49‐treated HK‐2 cells transfected with pcDNA 3.1 or pcDNA 3.1‐ Hsp90α in the absence or presence of TNF‐α/OGSD (mean ± SD, n = 3, *p < 0.05, **p < 0.01). (P, Q) Immunoblot analysis (P) and quantitative results (Q) of the protein expression levels of HMGB1, α‐SMA and E‐cadherin in DMSO‐ or LM49‐treated HK‐2 cells transfected with ctrl siRNA or Hsp90α siRNA in the absence or presence of TNF‐α/OGSD (mean ± SD, n = 3, *p < 0.05). (R) Representative fluorescence images and fluorescence intensity of Hsp90α (red) and HMGB1 (green) in HK‐2 cells treated with ctrl siRNA or Hsp90α siRNA. Scale bar, 20 μm, ×200.
FIGURE 7
FIGURE 7
5,2′‐Dibromo‐2,4′,5′‐trihydroxydiphenylmethanone (LM49) bound directly to heat shock protein 90 alpha family class A member 1 (Hsp90α). (A) Cellular thermal shift (CETSA) confirms the direct binding of LM49 to Hsp90α in various temperatures. (B) Quantification of Hsp90α intensity in (A). Each group was normalized as a percentage of that at 37°C. (n = 3). (C) CETSA confirms the direct binding of LM49 to Hsp90α in the presence of increasing concentrations of LM49. (D) Quantification of Hsp90α intensity in (C). *p < 0.05 versus 0 μM group (n = 3). (E) Drug affinity responsive target stability confirms the direct binding of LM49 to Hsp90α. (F) Quantification of Hsp90α intensity in (E). *p < 0.05 versus 0 μM group (n = 3). (G, H) 2d chemical structure and 3d interactive chemical structure of LM49. (I) Molecular docking binding mode and residues detail of LM49 and Hsp90α analysed with Autodock4.2. (J) Root mean square deviation (RMSD) of LM49, Hsp90α and LM49–Hsp90α complex obtained during the 100 ns MD simulation. (K) Hydrogen bond map of LM49 and Hsp90α during the 100 ns molecular dynamics simulation. (L) Energy decomposition of binding free energy of LM49–Hsp90α complex.
FIGURE 8
FIGURE 8
The mechanism of 5,2′‐Dibromo‐2,4′,5′‐trihydroxydiphenylmethanone (LM49) direct binding to heat shock protein 90 alpha family class A member 1 (Hsp90α) attenuates the high‐mobility group box 1 (HMGB1) nuclear translocation mediated renal inflammation and fibrosis. ECM, extracellular matrix; EMT, epithelial‐to‐mesenchymal transition; FA, folic acid; IL, interleukin; RAGE, receptor for advanced glycation end products; TLR, Toll‐like receptor; TNF, tumour necrosis factor; UUO, unilateral ureteral obstruction.

Similar articles

Cited by

References

    1. Chen QQ, Liu K, Shi N, et al. Neuraminidase 1 promotes renal fibrosis development in male mice. Nat Commun. 2023;14(1):1713. - PMC - PubMed
    1. Ruiz‐Ortega M, Rayego‐Mateos S, Lamas S, Ortiz A, Rodrigues‐Diez RR. Targeting the progression of chronic kidney disease. Nat Rev Nephrol. 2020;16(5):269‐288. - PubMed
    1. Tang PM, Nikolic‐Paterson DJ, Lan HY. Macrophages: versatile players in renal inflammation and fibrosis. Nat Rev Nephrol. 2019;15(3):144‐158. - PubMed
    1. Huang R, Fu P, Ma L. Kidney fibrosis: from mechanisms to therapeutic medicines. Signal Transduct Target Ther. 2023;8(1):129. - PMC - PubMed
    1. Liu BC, Tang TT, Lv LL, Lan HY. Renal tubule injury: a driving force toward chronic kidney disease. Kidney Int. 2018;93(3):568‐579. - PubMed

MeSH terms

LinkOut - more resources