. 2024 Nov 20;8(2):e202403075.
doi: 10.26508/lsa.202403075. Print 2025 Feb.

Brain and behavioural anomalies caused by Tbx1 haploinsufficiency are corrected by vitamin B12

Affiliations

Brain and behavioural anomalies caused by Tbx1 haploinsufficiency are corrected by vitamin B12

Marianna Caterino et al. Life Sci Alliance. .

Abstract

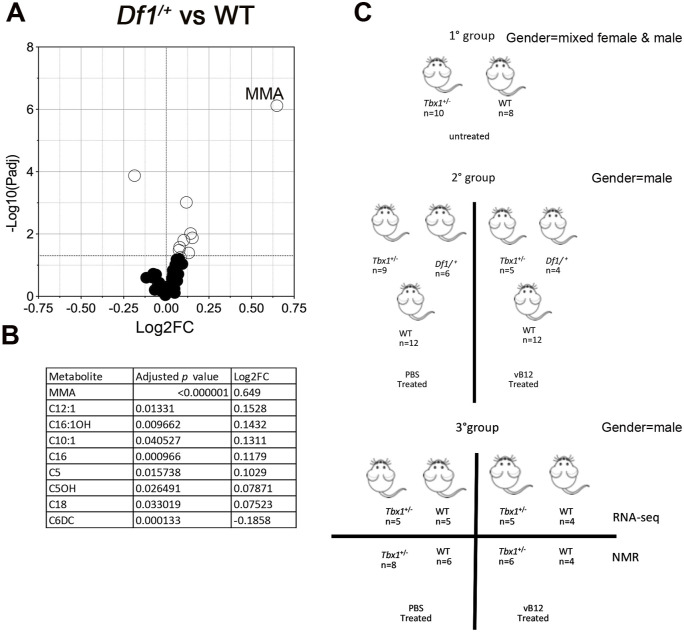
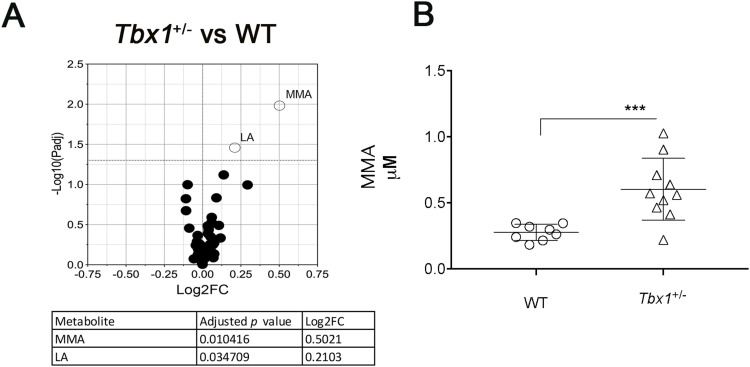
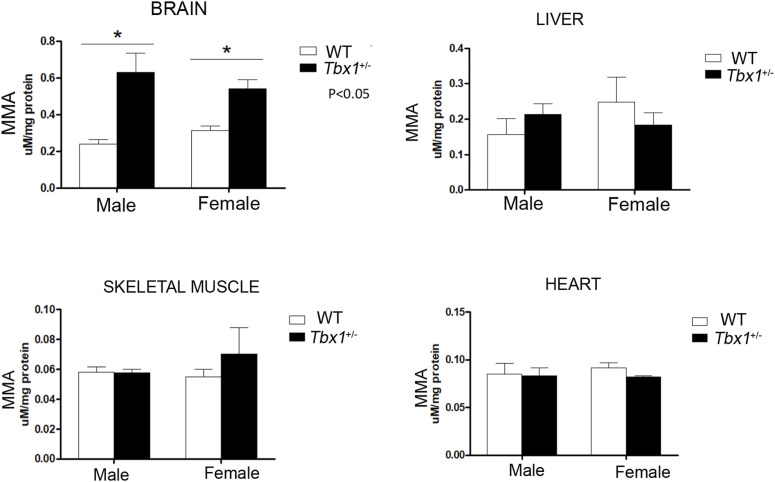
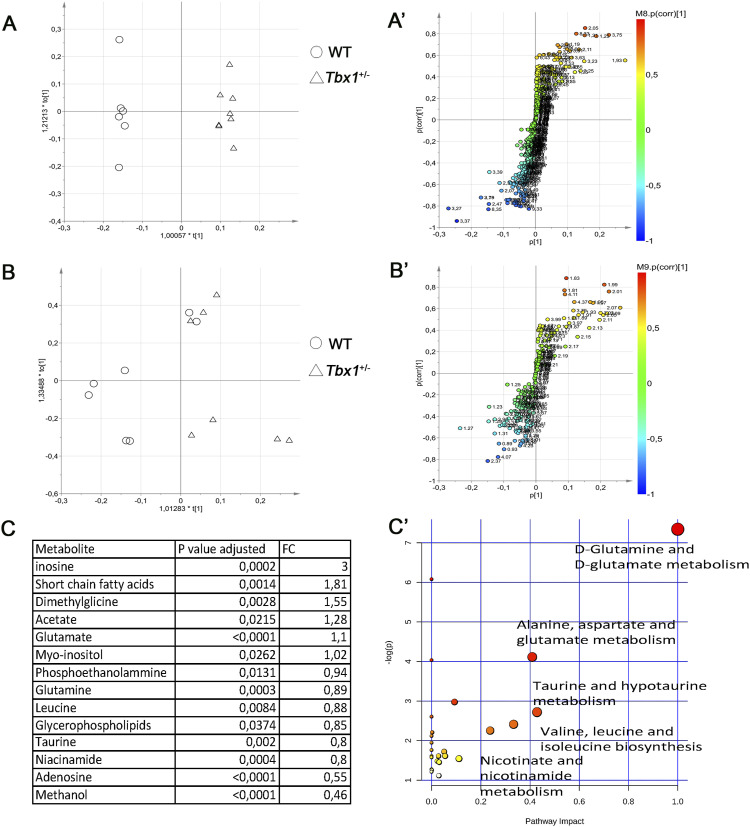
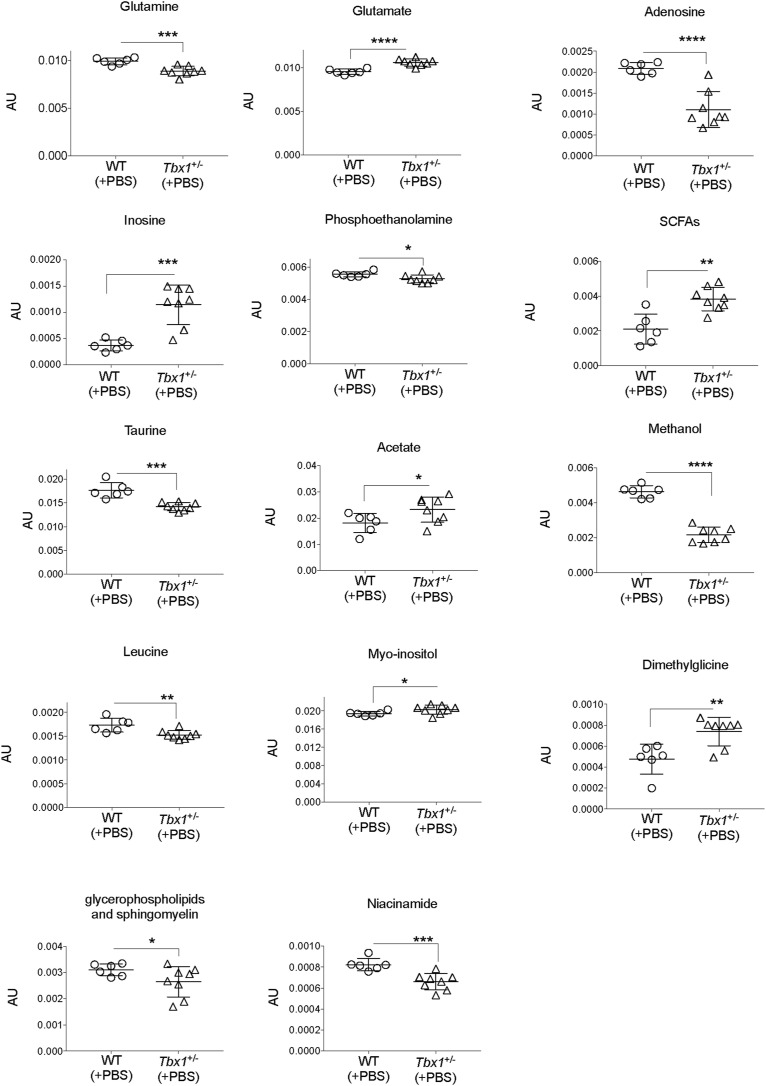
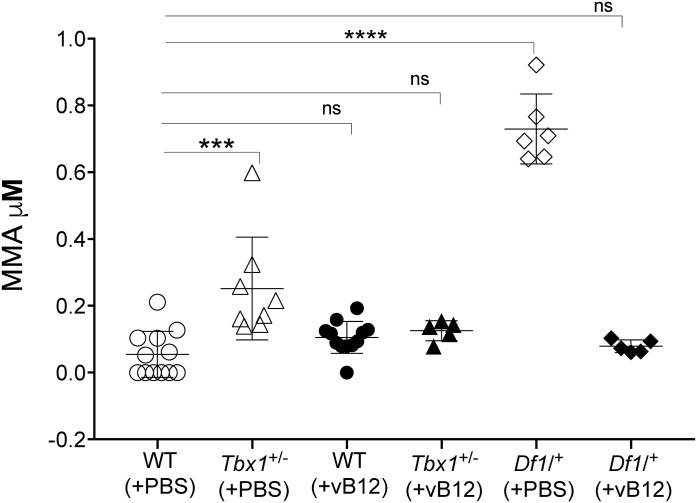
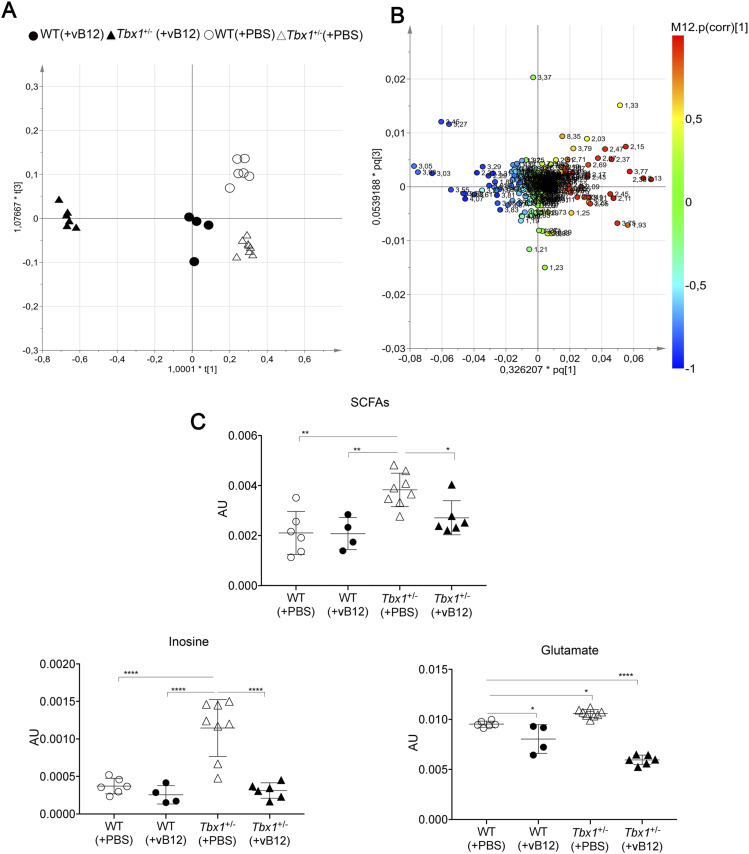
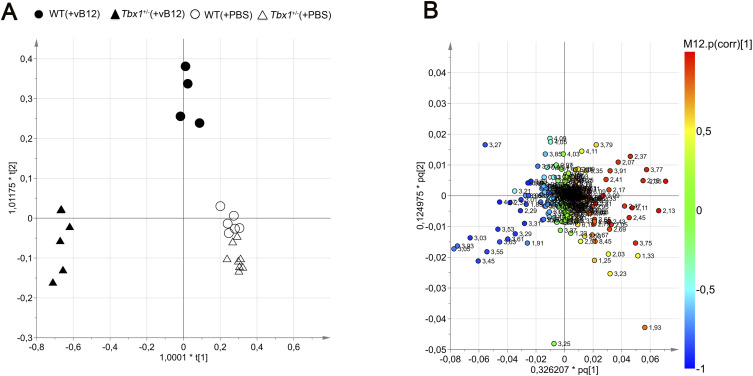
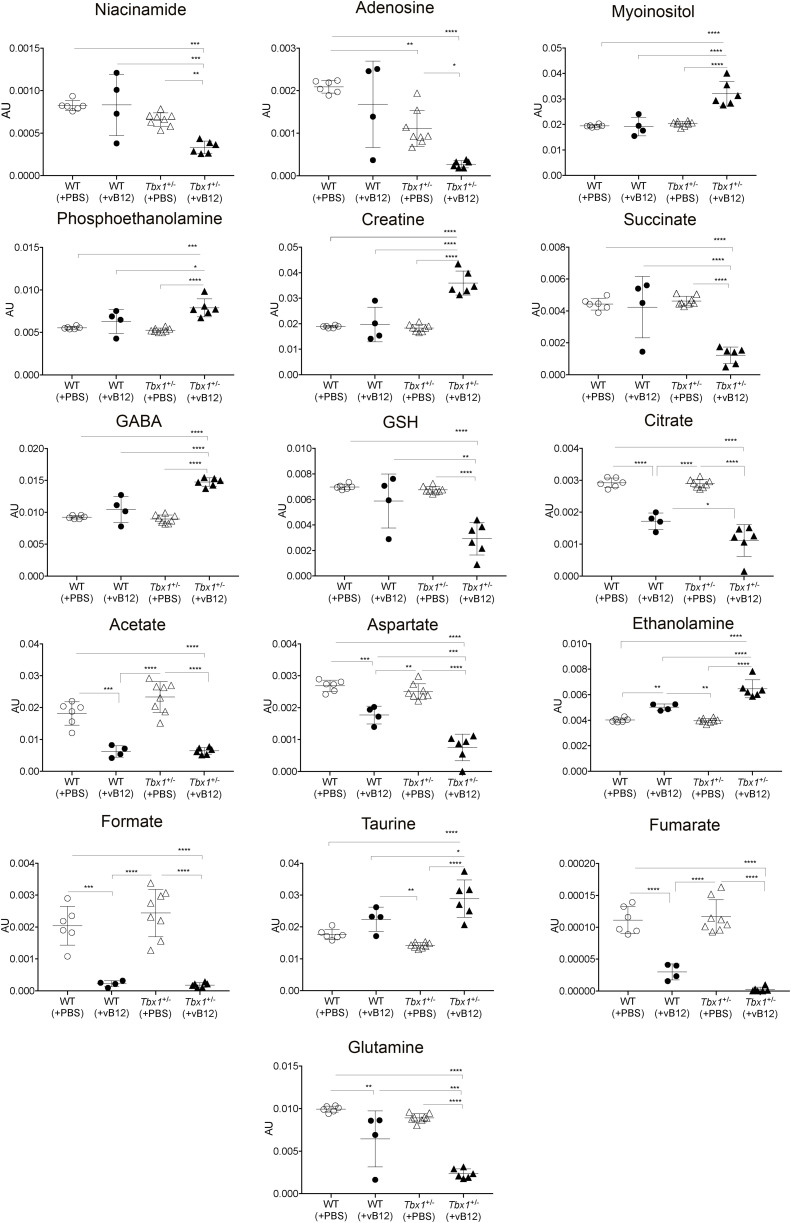
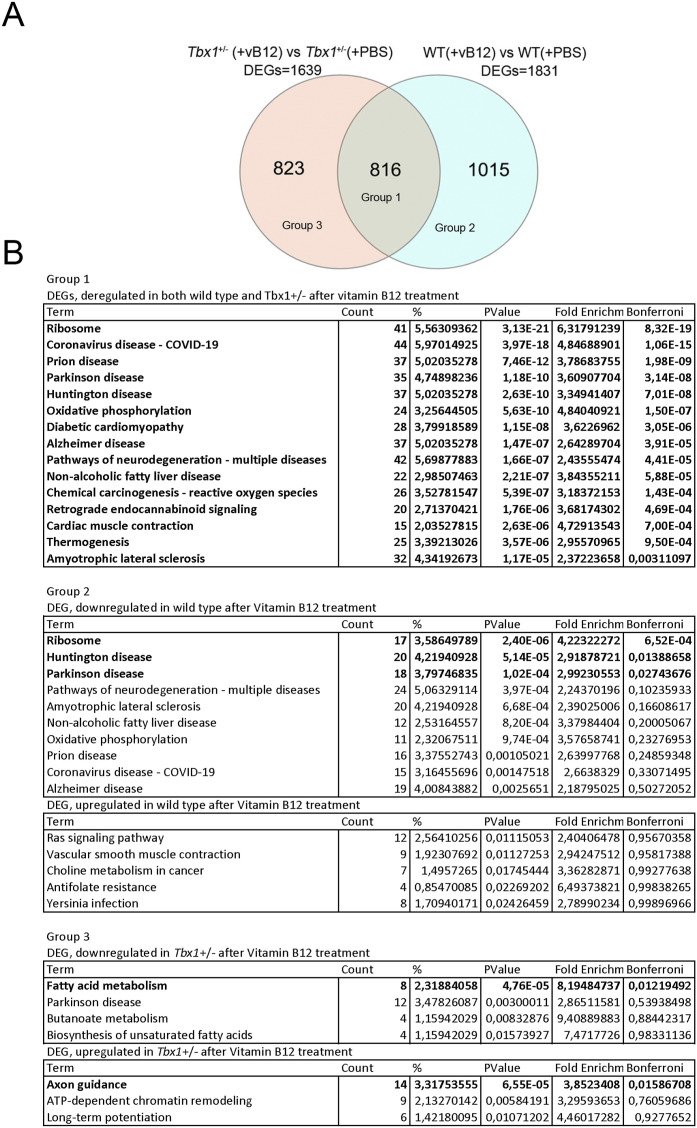
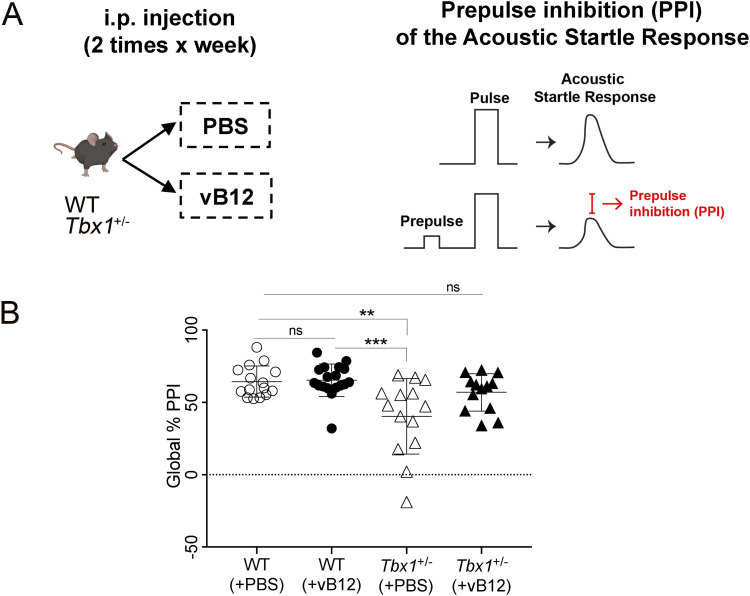
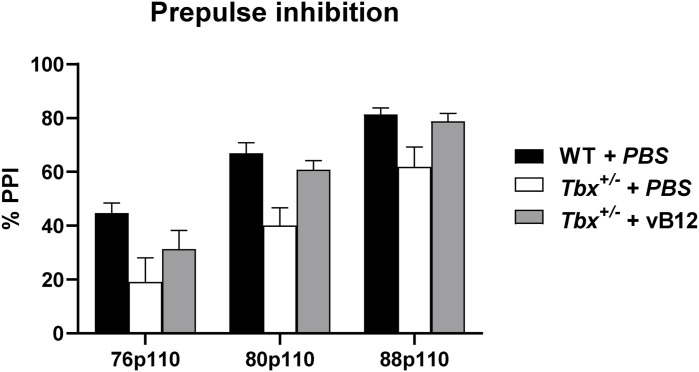
The brain-related phenotypes observed in 22q11.2 deletion syndrome (DS) patients are highly variable, and their origin is poorly understood. Changes in brain metabolism might contribute to these phenotypes, as many of the deleted genes are involved in metabolic processes, but this is unknown. This study shows for the first time that Tbx1 haploinsufficiency causes brain metabolic imbalance. We studied two mouse models of 22q11.2DS using mass spectrometry, nuclear magnetic resonance spectroscopy, and transcriptomics. We found that Tbx1 +/- mice and Df1/+ mice, with a multigenic deletion that includes Tbx1, have elevated brain methylmalonic acid, which is highly brain-toxic. Focusing on Tbx1 mutants, we found that they also have a more general brain metabolomic imbalance that affects key metabolic pathways, such as glutamine-glutamate and fatty acid metabolism. We provide transcriptomic evidence of a genotype-vitamin B12 treatment interaction. In addition, vitamin B12 treatment rescued a behavioural anomaly in Tbx1 +/- mice. Further studies will be required to establish whether the specific metabolites affected by Tbx1 haploinsufficiency are potential biomarkers of brain disease status in 22q11.2DS patients.


Conflict of interest statement

The authors declare that they have no conflict of interest.

Figures

Figure S1.
Figure S1.. Metabolomic analysis in 22q11.2 mouse model and experimental schemes.
(A) Volcano plots showing differential concentrations of selected metabolites in Df1/+ versus WT samples obtained by LC-MS/MS. The white dots represent the significant differential metabolites, and the black dots, all the metabolites identified in the dataset, the relative abundance of which was not significantly different between the groups. (B) Differential metabolites are listed in the table accompanied by their corresponding values of difference (Log2FC, fold change) and adjusted P-values. (C) Cartoon showing the animals used in the study. Group 2 mice were obtained by intercrossing Tbx1+/− and Df1/+ mice.
Figure 1.
Figure 1.. Targeted metabolome analysis by liquid chromatography–tandem mass spectrometry (LC-MS/MS).
(A) Volcano plots showing differential concentrations of selected metabolites in (A) Tbx1+/− versus WT samples. The white dots represent the significant differential metabolites, and the black dots, all the metabolites identified in the dataset, the relative abundance of which was not significantly different between the groups. The differential metabolites are listed in the table accompanied by their corresponding values of difference (FC, fold change) and adjusted P-values. (B) Abundance of MMA (μM, mean ± SEM) in WT and Tbx1+/− brains. Differences between groups were evaluated by performing the Mann–Whitney test (*P < 0.01, **P < 0.005, ***P < 0.0005, ****P < 0.0001). Each symbol in the plot represents an individual animal.
Figure S2.
Figure S2.. Graphical representation of MMA quantification in brain, heart, skeletal muscle, and liver from adult male and female Tbx1+/− (black column, n = 4) and WT (white column, n = 4) mice.
Figure 2.
Figure 2.. Brain metabolic profiles of Tbx1+/− and WT brains.
(A, B) Score plot obtained from the orthogonal partial least squares discriminant analysis of brain extracts. (A, B) NMR data from hydrophilic (A) and hydrophobic (B) phases. The principal components t (1) and to (1) describe the space in which the NMR metabolic profiles of each brain extract are projected. Spectra of WT and Tbx1+/− samples are separated along the predictive t (1) axis (x-axis). (A′, B′) S plots associated with the multivariate model providing principal component visualization to facilitate model interpretation. The NMR variables situated far out on the wings of the S plot, in the lower left corner, indicate metabolites with an increased concentration in the WT class, whereas variables in the upper right side of the plot indicate metabolites with an increased concentration in Tbx1+/− mutant brain. The colour code refers to the correlation values. (C) Differential metabolites are listed in the table accompanied by their corresponding values of difference (FC, fold changes) and adjusted P-values. (C′) Discriminating metabolites that were used as input for the pathway analysis in Mus musculus libraries to identify the most relevant pathways affected by the Tbx1+/− mutation. Pathway impact on the axis represents a combination of the centrality and pathway enrichment results; higher impact values on the x- and y-axes indicate the relative importance of the pathway; the size of the dots indicates how many metabolites within the pathway are altered, whereas the colour represents the significance (the more intense the red colour, the lower the P-value).
Figure S3.
Figure S3.. Metabolites for which the concentration was significantly different between WT and Tbx1+/− brain extracts.
Bin values were normalized to the total area of each spectrum and are therefore expressed in arbitrary units (AU) (*P < 0.01, **P < 0.005, ***P < 0.0005, ****P < 0.0001).
Figure S4.
Figure S4.. RNA-seq analysis of brain tissue of WT and Tbx1+/− mice treated with PBS or vB12 animals.
(A) PCA of all groups. Filled and open dots and triangles correspond to the transcriptional profile the genotype and treatment groups indicated in the key. (B, C, D) Volcano plots of differentially expressed genes from (B) Tbx1+/− (+vB12) versus Tbx1+/− (+PBS), (C) WT (+vB12) versus WT (+PBS), and (D) Tbx1+/− (+PBS) versus WT (+PBS).
Figure 3.
Figure 3.. Vitamin B12 treatment restores MMA to WT levels in Tbx1+/− and Df1/+ mice.
The abundance of MMA (μM, mean ± SEM) was evaluated in WT, Tbx1+/−, and Df1/+ mice treated with vB12 or PBS (vehicle). Differences between groups were evaluated by the ordinary one-way ANOVA test and the Holm–Sidak’s multiple comparison test (*P < 0.05, **P < 0.01, ***P < 0.001). The normal distribution was verified according to the D’Agostino and Pearson tests. Each symbol in the plot represents an individual animal.
Figure 4.
Figure 4.. Metabolic profile of the Tbx1+/− brain after vitamin B12 treatment.
The metabolic profiles of Tbx1 mutant brain extracts were compared to those of WT brains with and without vB12 treatment. (A) Score plot obtained from the orthogonal partial least squares discriminant analysis of brain extracts (NMR data). (A, B) Loading plot associated with the score plot in (A) showing the NMR signals responsible for the data cluster. Each variable in the plot corresponds to a signal in the metabolic profile of the dataset. (C) Graphical representation of metabolites that were rescued in Tbx1+/− brains after vB12 treatment (inosine, glutamate, and SCFAs). Normalized bin intensities corresponding to rescued molecules are expressed in arbitrary units (*P < 0.01, **P < 0.005, ***P < 0.0005, ****P < 0.0001).
Figure S5.
Figure S5.. Metabolic profiles of Tbx1+/− brain extracts compared to those of WT brains with and without vB12 treatment.
(A) Score plot obtained from the orthogonal partial least squares discriminant analysis (OPLS-DA) of brain extracts (NMR data). The WT (PBS) mice are indicated by empty dots, Tbx1+/− (PBS) by empty triangles, WT (vB12) by black dots, and Tbx1+/− (vB12) by black triangles. (A, B) Loading plot associated with the score plot shown in (A) showing the NMR signals responsible for the data cluster. Each variable in the loading plot corresponds to a signal in the metabolic profile of the dataset.
Figure S6.
Figure S6.. Graphical representation of all metabolites (bin intensities) in brain extracts that were significantly different between WT and Tbx1+/− mice treated with PBS or vB12.
Bin values were normalized to the total area of each spectrum and are therefore expressed in arbitrary units (AU). P < 0.05*, P < 0.01**, P < 0.001***, P < 0.0001****.
Figure 5.
Figure 5.. Vitamin B12 treatment has a genotype-specific impact on the brain transcriptional profile.
(A) Venn diagram representing the intersection of two groups of differentially expressed genes (DEGs): Tbx1+/−(+vB12) versus Tbx1+/− (+PBS) and WT(+vB12) versus WT(+PBS). Groups 1, 2, and 3 are defined in (B). (B) Gene ontology analysis (DAVID) of differentially down-regulated and up-regulated genes in each of the indicated groups: Group 1—differentially expressed genes deregulated in both WT and Tbx1+/− after vB12 treatment; Group 2—differentially expressed genes deregulated exclusively in WT after treatment; and Group 3—differentially expressed genes deregulated exclusively in Tbx1+/− after vB12 treatment.
Figure 6.
Figure 6.. Postnatal vitamin B12 treatment ameliorates the PPI impairment in Tbx1+/− mice.
(A) Schematic representation of the experimental procedure. (B) Dot plots showing global % PPI in WT (n = 15) and Tbx1+/− (n = 14) mice treated with PBS, and in WT (n = 18) and Tbx1+/− mice (n = 13) treated with vB12. **P < 0.005, ***P < 0.0005 (Bonferroni’s post hoc test).
Figure S7.
Figure S7.. Percentage PPI values were compared by a two-way ANOVA for repeated measures for the factors genotype, prepulse, and treatment.
Results indicate a significant effect for genotype (F1,56 = 14.832, P = 0.0003) and treatment (F1,56 = 4.386, P = 0.0408), and a trend to a significant interaction genotype x treatment (F1,56 = 3.466, P = 0.0679), together with a significant effect for the repeated measure prepulse (F2,112 = 186.922, P < 0.0001).

References

    1. McDonald-McGinn DM, Sullivan KE, Marino B, Philip N, Swillen A, Vorstman JAS, Zackai EH, Emanuel BS, Vermeesch JR, Morrow BE, et al. (2015) 22q11.2 deletion syndrome. Nat Rev Dis Primers 1: 15071. 10.1038/nrdp.2015.71 - DOI - PMC - PubMed
    1. Paylor R, Glaser B, Mupo A, Ataliotis P, Spencer C, Sobotka A, Sparks C, Choi C-H, Oghalai J, Curran S, et al. (2006) Tbx1 haploinsufficiency is linked to behavioral disorders in mice and humans: Implications for 22q11 deletion syndrome. Proc Natl Acad Sci U S A 103: 7729–7734. 10.1073/pnas.0600206103 - DOI - PMC - PubMed
    1. Torres-Juan L, Rosell J, Morla M, Vidal-Pou C, García-Algas F, de la Fuente M-A, Juan M, Tubau A, Bachiller D, Bernues M, et al. (2007) Mutations in TBX1 genocopy the 22q11.2 deletion and duplication syndromes: A new susceptibility factor for mental retardation. Eur J Hum Genet 15: 658–663. 10.1038/sj.ejhg.5201819 - DOI - PubMed
    1. Ogata T, Niihori T, Tanaka N, Kawai M, Nagashima T, Funayama R, Nakayama K, Nakashima S, Kato F, Fukami M, et al. (2014) TBX1 mutation identified by exome sequencing in a Japanese family with 22q11.2 deletion syndrome-like craniofacial features and hypocalcemia. PLoS One 9: e91598. 10.1371/journal.pone.0091598 - DOI - PMC - PubMed
    1. Haddad RA, Clines GA, Wyckoff JA (2019) A case report of T-box 1 mutation causing phenotypic features of chromosome 22q11.2 deletion syndrome. Clin Diabetes Endocrinol 5: 13. 10.1186/s40842-019-0087-6 - DOI - PMC - PubMed

LinkOut - more resources