

Improving the Dehydroepiandrosterone Induced PCOS Rat Model: Interplay of Age, High Fat Diet, and Treatment Regimen on Reproductive and Metabolic Phenotypes
- PMID: 39567467
- PMCID: PMC11729200
- DOI: 10.1007/s43032-024-01742-1
Improving the Dehydroepiandrosterone Induced PCOS Rat Model: Interplay of Age, High Fat Diet, and Treatment Regimen on Reproductive and Metabolic Phenotypes
Abstract
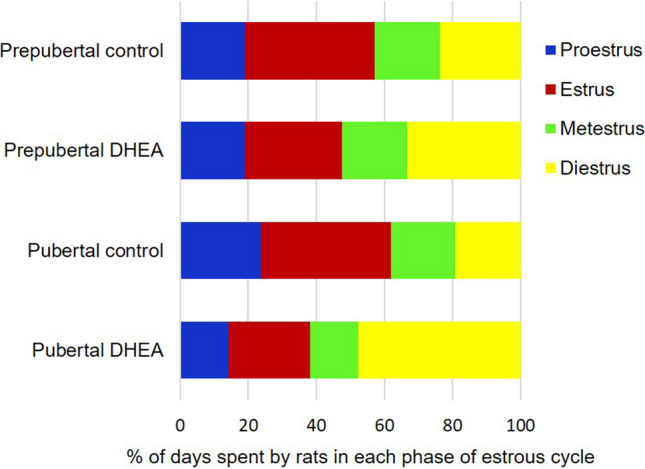
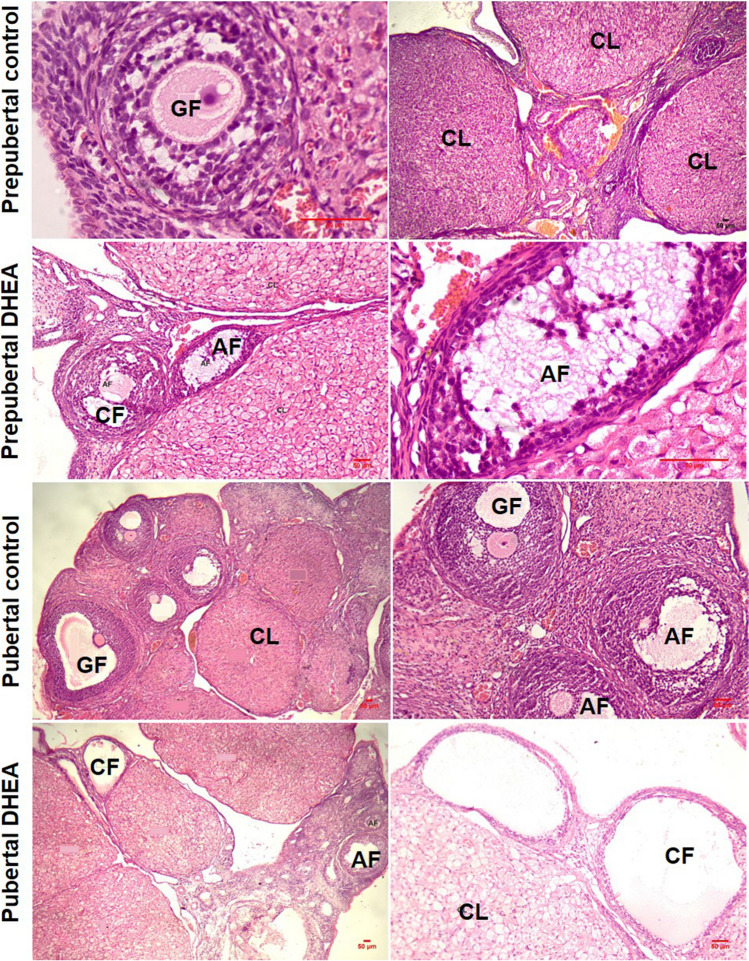
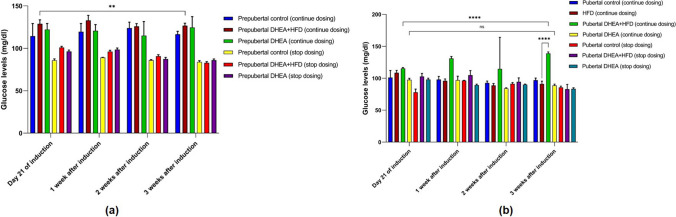
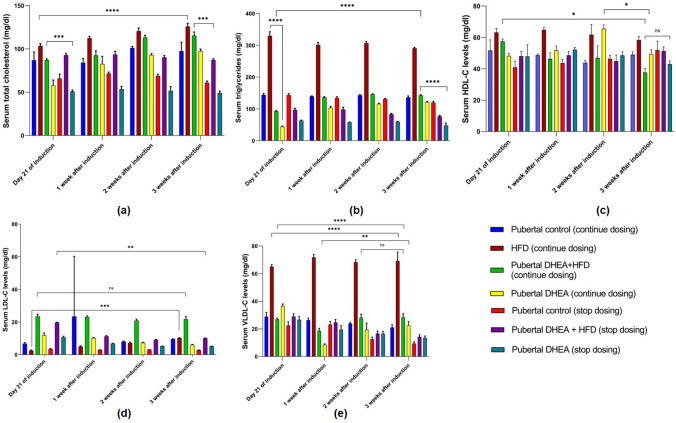
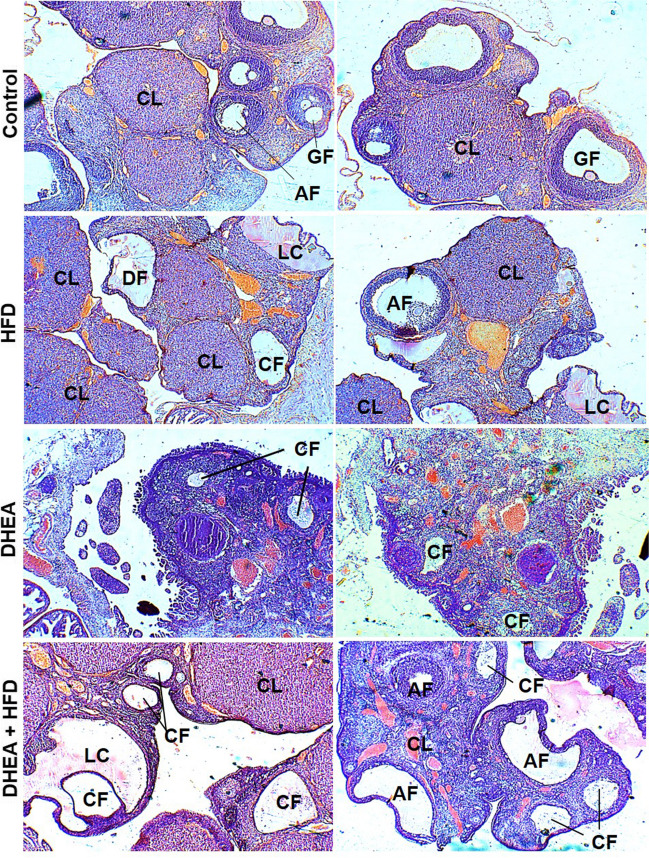
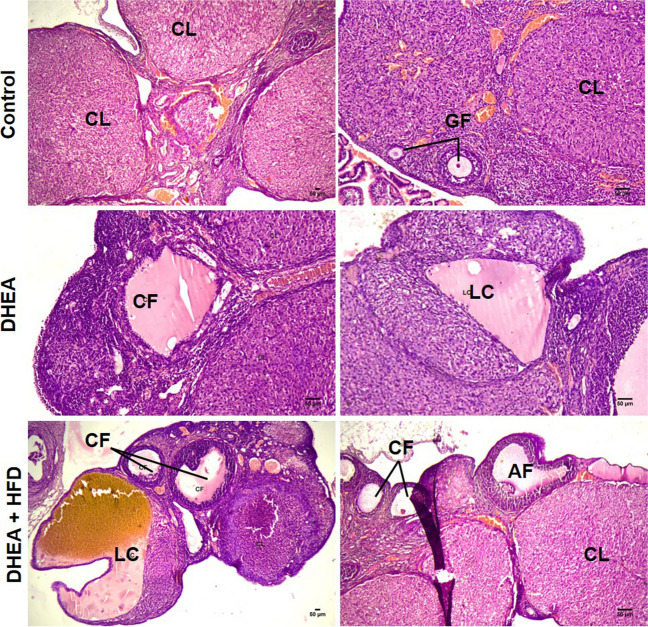
Polycystic ovary syndrome (PCOS) is a ubiquitous reproductive condition with triggering hallmarks such as glucose intolerance, hyperandrogenism, and dyslipidemia. Despite the existence of various PCOS animal models, an ideal model which could encompass all PCOS-specific phenotype is of dire need. Dehydroepiandrosterone (DHEA) induced PCOS rats are frequently employed; though, determining the superior model among pubertal and prepubertal rats, incorporation of high fat diet (HFD), and their sustainability remains uncertain. This study aims to examine the age factor, impact of HFD, and DHEA regimen in model development. Prepubertal and pubertal Sprague-Dawley rats were subcutaneously injected with DHEA (6 mg/kg and 60 mg/kg/day, respectively) with and without HFD up to 21 days. Serum testosterone, glucose, lipid profile, ovary morphology, and estrous cycle were evaluated. Following 21 days of treatment with DHEA, pubertal PCOS rats exhibited better reproductive phenotype than prepubertal rats. However, there was no significant difference in the lipid profile. Accordingly, both the age-group rats were concomitantly treated with DHEA and HFD for additional 3 weeks on alternate day basis after model development. The persistence of reproductive and metabolic features on treatment withdrawal were also simultaneously investigated by alienating the rats into continuous and stop dosing groups. The DHEA + HFD and DHEA treated pubertal rats in continuous dosing group showed significant PCOS features (p < 0.05) compared to stop dosing, prepubertal, and control groups. To conclude, continual dosing with DHEA on alternate days for 3 weeks is necessary to sustain metabolic and reproductive phenotypes of PCOS.
Keywords: Animal model; DHEA; High fat diet; Phenotype; Polycystic ovary syndrome.
© 2024. The Author(s).
Conflict of interest statement
Declarations. Conflict of Interest: The authors declare no conflicts of interest.
Figures


Similar articles
-
Dehydroepiandrosterone with a high-fat diet treatment at inducing polycystic ovary syndrome in rat model.Steroids. 2024 Jun;206:109424. doi: 10.1016/j.steroids.2024.109424. Epub 2024 Apr 19. Steroids. 2024. PMID: 38642598
-
Dehydroepiandrosterone-induced polycystic ovary syndrome mouse model requires continous treatments to maintain reproductive phenotypes.J Ovarian Res. 2023 Oct 25;16(1):207. doi: 10.1186/s13048-023-01299-8. J Ovarian Res. 2023. PMID: 37880784 Free PMC article.
-
High-fat diet induces significant metabolic disorders in a mouse model of polycystic ovary syndrome.Biol Reprod. 2014 Nov;91(5):127. doi: 10.1095/biolreprod.114.120063. Epub 2014 Aug 6. Biol Reprod. 2014. PMID: 25100714
-
The use of dehydroepiandrosterone-treated rats is not a good animal model for the study of metabolic abnormalities in polycystic ovary syndrome.Taiwan J Obstet Gynecol. 2018 Oct;57(5):696-704. doi: 10.1016/j.tjog.2018.08.015. Taiwan J Obstet Gynecol. 2018. PMID: 30342654
-
Effects of dehydroepiandrosterone alone or in combination with a high-fat diet and antibiotic cocktail on the heterogeneous phenotypes of PCOS mouse models by regulating gut microbiota.Front Endocrinol (Lausanne). 2022 Dec 22;13:1030151. doi: 10.3389/fendo.2022.1030151. eCollection 2022. Front Endocrinol (Lausanne). 2022. PMID: 36619569 Free PMC article.
Cited by
-
Evaluation of representativeness and sustainability of PCOS rat models induced by letrozole with or without high-fat diet.Sci Rep. 2025 Aug 21;15(1):30754. doi: 10.1038/s41598-025-15026-4. Sci Rep. 2025. PMID: 40841528 Free PMC article.
References
-
- Abraham Gnanadass S, Divakar Prabhu Y, Valsala Gopalakrishnan A. Association of metabolic and inflammatory markers with polycystic ovarian syndrome (PCOS): an update. Arch Gynecol Obstet. 2021;303:631–43. 10.1007/s00404-020-05951-2. - PubMed
-
- Witchel SF, Teede HJ, Peña AS. Curtailing pcos. Pediatr Res. 2020;87(2):353–61. 10.1038/s41390-019-0615-1. - PubMed
MeSH terms
Substances
LinkOut - more resources
Full Text Sources
Medical
