. 2024 Nov 20;15(1):8576.
doi: 10.1038/s41467-024-52757-w.

Divergent WNT signaling and drug sensitivity profiles within hepatoblastoma tumors and organoids

Affiliations

Divergent WNT signaling and drug sensitivity profiles within hepatoblastoma tumors and organoids

Thomas A Kluiver et al. Nat Commun. .

Abstract

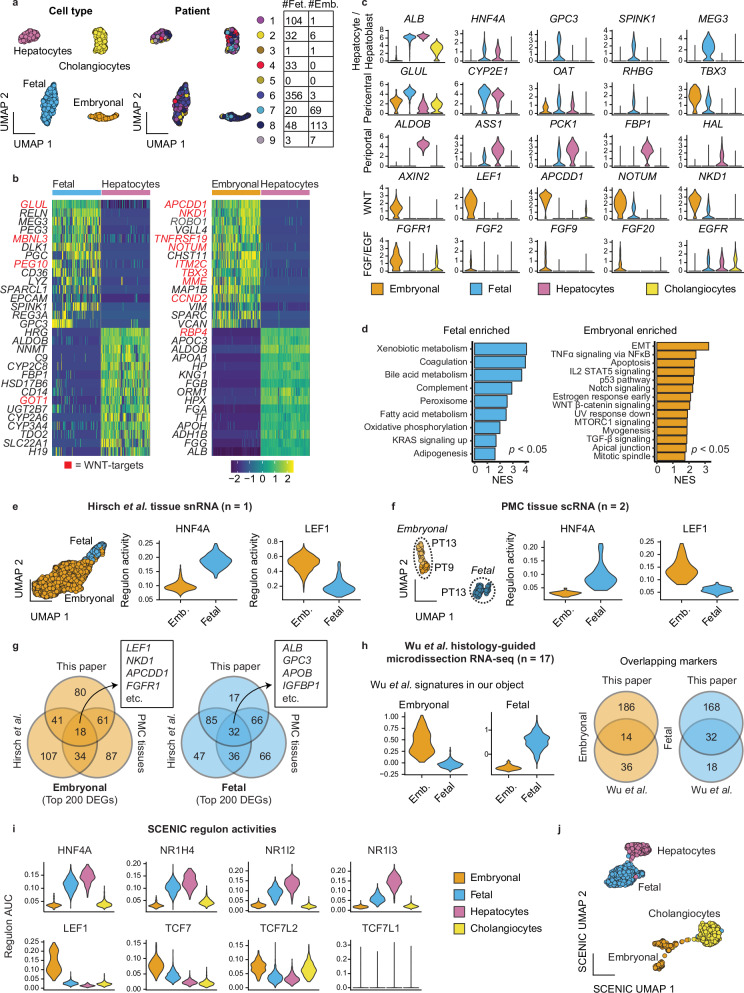
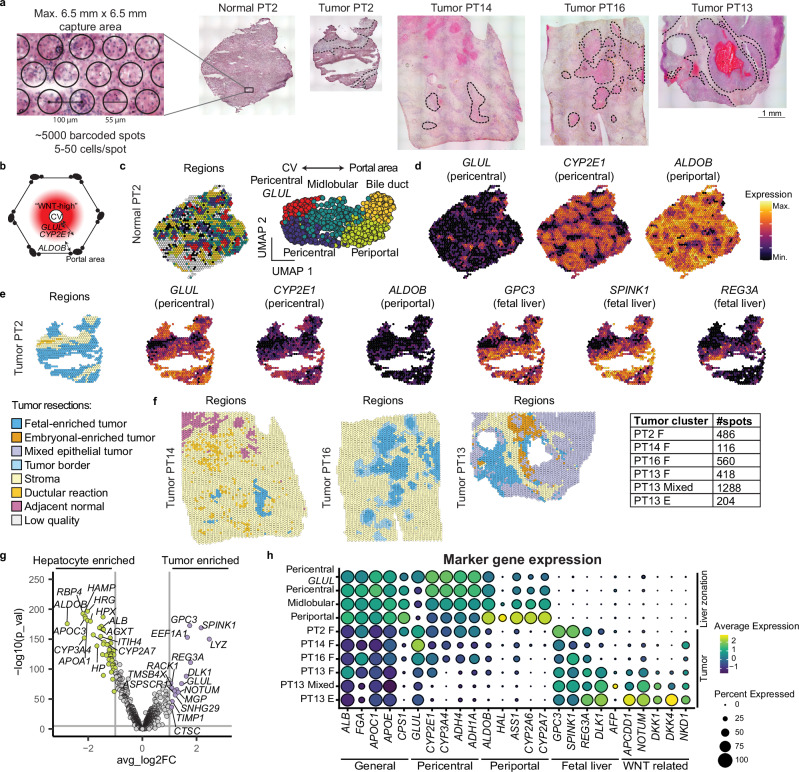
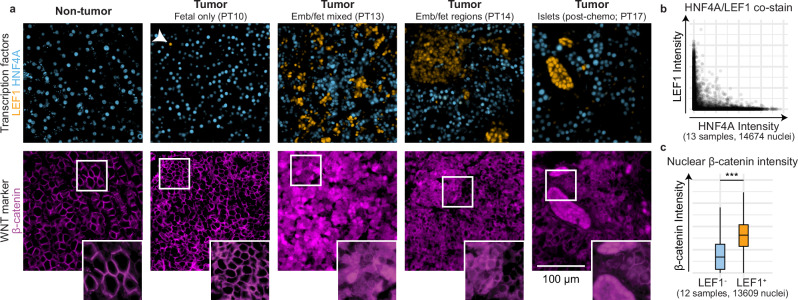
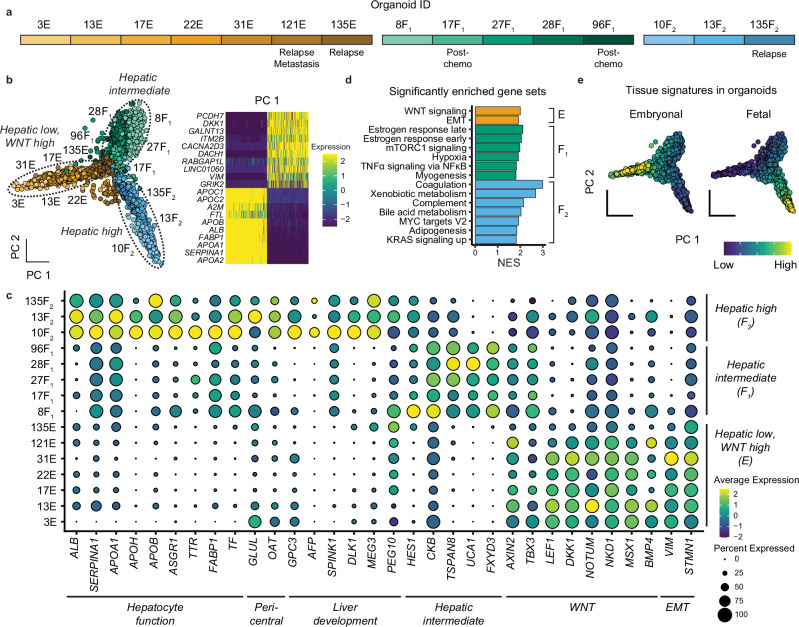
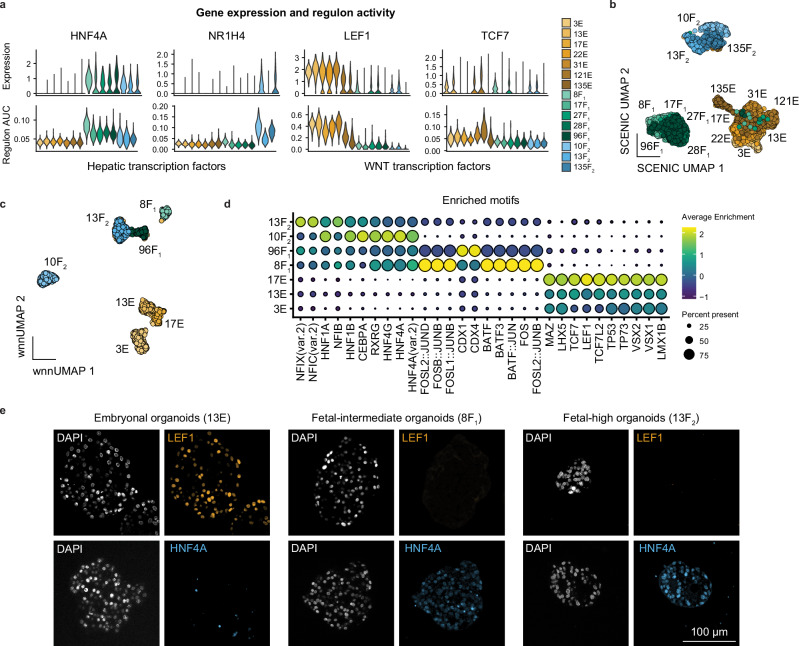
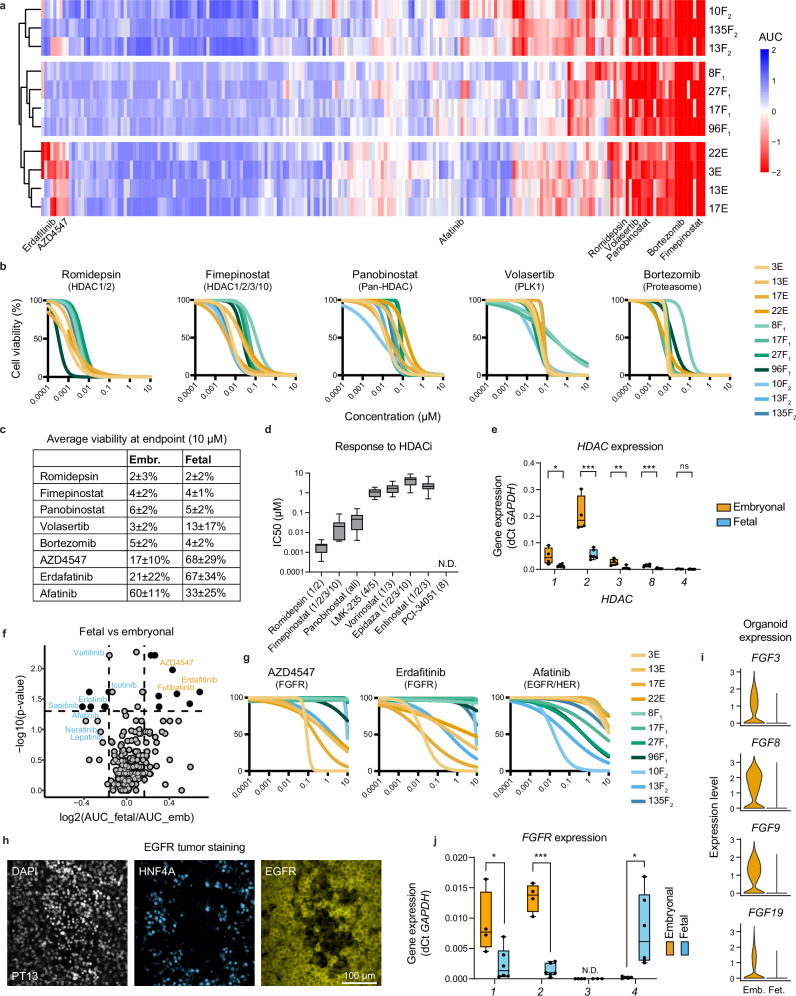
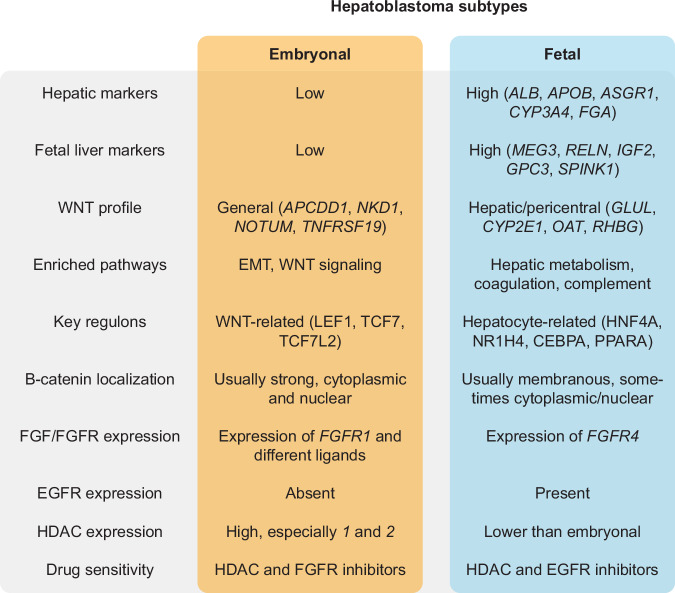
Hepatoblastoma, the most prevalent pediatric liver cancer, almost always carries a WNT-activating CTNNB1 mutation, yet exhibits notable molecular heterogeneity. To characterize this heterogeneity and identify novel targeted therapies, we perform comprehensive analysis of hepatoblastomas and tumor-derived organoids using single-cell RNA-seq/ATAC-seq, spatial transcriptomics, and high-throughput drug profiling. We identify two distinct tumor epithelial signatures: hepatic 'fetal' and WNT-high 'embryonal', displaying divergent WNT signaling patterns. The fetal group is enriched for liver-specific WNT targets, while the embryonal group is enriched in canonical WNT target genes. Gene regulatory network analysis reveals enrichment of regulons related to hepatic functions such as bile acid, lipid and xenobiotic metabolism in the fetal subtype but not in the embryonal subtype. In addition, the dichotomous expression pattern of the transcription factors HNF4A and LEF1 allows for a clear distinction between the fetal and embryonal tumor cells. We also perform high-throughput drug screening using patient-derived tumor organoids and identify sensitivity to HDAC inhibitors. Intriguingly, embryonal and fetal tumor organoids are sensitive to FGFR and EGFR inhibitors, respectively, indicating a dependency on EGF/FGF signaling in hepatoblastoma tumorigenesis. In summary, our data uncover the molecular and drug sensitivity landscapes of hepatoblastoma and pave the way for the development of targeted therapies.


Conflict of interest statement

Competing interests: H.C. is currently head of pharma Research Early Development (pRED) at Roche and is an inventor on several patents related to organoid technology. His full disclosure is given at www.uu.nl/staff/JCClevers . The remaining authors declare no competing interests.

Figures

Fig. 1
Fig. 1. Single-cell RNA-seq analysis of primary tumor material illustrates fetal and embryonal tumor signatures.
a UMAP plot based on unsupervised clustering, annotated per cell type or tumor signature (left) and patient identity (right) of epithelial cell subsets from the Song et al. dataset. The table shows the number of cells per signature per patient. b Heatmaps showing the top differentially expressed genes between tumor cell populations and hepatocytes. WNT signaling pathway target genes are upregulated, especially in the WNT-high embryonal tumor subpopulation, and marked in red. c Violin plots showing expression of select markers. d Gene set enrichment analysis showing hallmark gene sets significantly enriched in the fetal and embryonal clusters, compared to each other. NES: normalized enrichment score. Adjusted p-value < 0.05, calculated using the fgsea package. e UMAP plot showing embryonal and fetal cells identified in an external snRNA-seq dataset (Hirsch et al.) from a single tumor (left). Violin plots showing TF regulon activity scores for HNF4A and LEF1 for these clusters (right). f UMAP plot showing embryonal and fetal cells identified in scRNA-seq data of tumors from PT9 and PT13 (left). Violin plots showing TF regulon activity scores for HNF4A and LEF1 for these clusters (right). g Venn diagrams showing the amount of overlap between the top 200 differentially expressed genes of the scRNA clusters described in this paper, the snRNA-seq data of Hirsch et al. and scRNA-seq data of PT9 and PT13 (“PMC tissues”). h Violin plots showing embryonal and fetal signature scores (50 genes each) derived from histology-guided laser microdissection RNA-seq of 17 patients (Wu et al.) on our tumor clusters (left). Venn diagrams show the amount of overlap between the signatures from Wu et al. (50 markers each) and ours (200 markers each) for fetal and embryonal cells. i Violin plots showing regulon activity scores for hepatic TFs (above) enriched in fetal tumor cells and WNT/β-catenin co-factors (below) in embryonal tumor cells. j UMAP plot based on the SCENIC regulon activity scores.
Fig. 2
Fig. 2. Spatial transcriptomics of hepatoblastoma tissues displays distinct spatial molecular patterns.
a ST analysis was performed using the 10x Genomics Visium platform on four hepatoblastoma tissues, as well as one paired distal normal liver tissue. H&E staining tissue sections are shown, with the tumor regions indicated (dotted line). b Schematic representation of a liver lobule showing a “WNT-high” gradient around the central vein (CV), associated with high GLUL (narrow) and CYP2E1 (broad) expression, while the periportal zone is associated with a distinct hepatic expression profile, including expression of genes such as ALDOB. c Spatial map (left) and UMAP (right) annotated by liver metabolic zonation clusters. d Spatial map of liver zonation markers showing distinct expression patterns of pericentral and periportal markers in normal liver. e Spatial map of clusters and liver markers showing retained (reduced) expression of pericentral markers, reduced expression of periportal markers, and expression of fetal liver markers in tumor regions of PT2, but absent in stromal regions. f Spatial map of clusters in three additional hepatoblastoma resections (PT14, PT16, PT13), showing fetal tumor regions. Additional heterogeneity is observed in PT13, where we identified fetal-enriched, embryonal-enriched, and mixed tumor regions. g Volcano plot of differentially expressed genes between all tumor regions and distal hepatocytes (pericentral, midlobular, and periportal) highlighting the expression of tumor-specific fetal liver markers and reduced expression of mature hepatic and periportal markers. P-values calculated using the Wilcoxon Rank Sum Test. h Dot plot comparing expression of hepatic markers between hepatocyte regions and tumor regions.
Fig. 3
Fig. 3. Immunofluorescence staining of TFs LEF1 and HNF4A mark distinct tumor subpopulations.
a Co-staining of HNF4A (blue) and LEF1 (orange) in normal liver and tumor tissues displayed a mutually exclusive expression pattern, with different patterns shown (top). Arrowhead indicates a singular LEF1+ cell. Immunofluorescence staining of β-catenin on a consecutive section (bottom). Tissues from different patients (n = 13) and regions are available in Supp. Figure 3b. b Scatter plot showing HNF4A and LEF1 staining intensity per cell in hepatoblastoma tissues by nuclear segmentation and signal quantification. c Boxplots showing nuclear intensity of β-catenin staining in LEF1- and LEF+ cells by nuclear segmentation and signal quantification. Boxes represent the interquartile range, with the middle line showing the median. Whiskers extend to the smallest and largest values within 1.5 times this range. Welch’s two-sample t test, ***p < 0.0001. Source data are provided as a Source Data file.
Fig. 4
Fig. 4. Single-cell RNA-seq analysis elucidates molecular heterogeneity of hepatoblastoma tumor organoids.
a Overview of different organoid lines and their corresponding clinical stages. b PCA plot illustrating the clustering of three organoid groups based on hepatic marker expression levels (left); heatmap showing top markers in the first principal component (right). c Dot plot showing the expression of markers for the different groups of organoids. d Gene set enrichment analysis of hallmark gene sets of the three organoid groups, calculated using the fgsea package, with an adjusted p-value < 0.05. e PCA plot showing fetal and embryonal signatures derived from the tissue scRNA-seq analysis in the organoids.
Fig. 5
Fig. 5. Single-cell ATAC-seq and SCENIC analysis identify TFs associated with hepatoblastoma subtypes.
a Violin plots showing expression levels and SCENIC regulon activity scores for hepatic transcription factors (HNF4A, NR1H4) and WNT/β-catenin transcription factors (LEF1, TCF7). b UMAP visualization based on SCENIC regulon activity scores of the different organoids. c Weighted nearest neighbor (WNN) UMAP visualization based on the integration of RNA and ATAC-seq data, showing clustering per organoid model. d Dot plot showing top 5 enriched motifs per organoid model from ATAC-seq analysis. e Immunofluorescence staining of FFPE-sectioned slides for organoids for LEF1 and HNF4A, with representative images from the three organoid groups.
Fig. 6
Fig. 6. High-throughput drug screening of tumor organoids provides insight into targetable pathways.
a Clustered heatmap, scaled by rows, of AUC values from the dose-response curves in high-throughput drug screens across 11 organoid models. b Dose-response curves of selected drugs effective in all models, such as those targeting HDAC, PLK1, and proteasomes. c Table showing the average viability (%) at the highest concentration (10 µM) for both fetal and embryonal tumor organoids. d Boxplot showing IC50 values for all organoid models (n = 11) against HDAC inhibitors included in the drug library. The boxes represent the interquartile range, the line inside the box marks the median, and the whiskers extend to the lowest and highest values. e Boxplot showing the expression levels of HDACs across embryonal (n = 4) and fetal (n = 6) organoid models measured by qRT-PCR. The boxes represent the interquartile range, the line inside the box marks the median, and the whiskers extend to the lowest and highest values. f Volcano plot identifying the most effective compounds specific for either the embryonal (orange) or fetal (blue) tumor organoid models. P-values were calculated using the Wilcoxon Rank Sum Test. g Dose-response curves of selected drugs that show selective sensitivities in embryonal lines (targeting FGFR) and fetal lines (targeting EGFR/HER). h Immunofluorescence co-staining of HNF4A and EGFR in a representative tumor sample. i Expression of select FGF ligands in embryonal and fetal organoids, as measured by scRNA-seq. j Boxplot showing the distribution of FGFRs across embryonal and fetal models in organoids measured by qRT-PCR. The boxes represent the interquartile range, the line inside the box marks the median, and the whiskers extend to the lowest and highest values. Statistical significance for (e) and (j) was determined using an unpaired, two-sided t test. *p < 0.05; **p < 0.01; ***p < 0.001; ns not significant; N.D. not determined. Exact P-values: HDAC1 = 0.02, HDAC2 = 0.0006, HDAC3 = 0.006, HDAC8 = 0.001, HDAC4 = 0.199, FGFR1 = 0.025, FGFR2 < 0.0001, FGFR3 = 0.071, FGFR4 = 0.034. Source data are provided as a Source Data file.
Fig. 7
Fig. 7
Summary of the characteristics of embryonal and fetal tumor components in hepatoblastoma.

References

    1. Meyers, R. L., Aronson, D. C. & Zimmermann, A. Pediatric Surgery (Seventh Edition, 2012).
    1. Ranganathan, S., Lopez-Terrada, D. & Alaggio, R. Hepatoblastoma and Pediatric Hepatocellular Carcinoma: An Update. Pediatr. Dev.Pathol.23, 79–95 (2020). - PubMed
    1. Dasgupta, P. et al. Global trends in incidence rates of childhood liver cancers: A systematic review and meta‐analysis. Paediatr. Périnat. Epidemiol.34, 609–617 (2020). - PubMed
    1. Zsiros, J. et al. Dose-dense cisplatin-based chemotherapy and surgery for children with high-risk hepatoblastoma (SIOPEL-4): a prospective, single-arm, feasibility study. Lancet Oncol.14, 834–842 (2013). - PMC - PubMed
    1. Perilongo, G. et al. Cisplatin versus cisplatin plus doxorubicin for standard-risk hepatoblastoma. N. Engl. J. Med.361, 1662–1670 (2009). - PubMed

Publication types

MeSH terms