. 2024 Nov 20;15(1):10041.
doi: 10.1038/s41467-024-54188-z.

Telomere-to-telomere genome assembly of a male goat reveals variants associated with cashmere traits

Affiliations

Telomere-to-telomere genome assembly of a male goat reveals variants associated with cashmere traits

Hui Wu et al. Nat Commun. .

Abstract

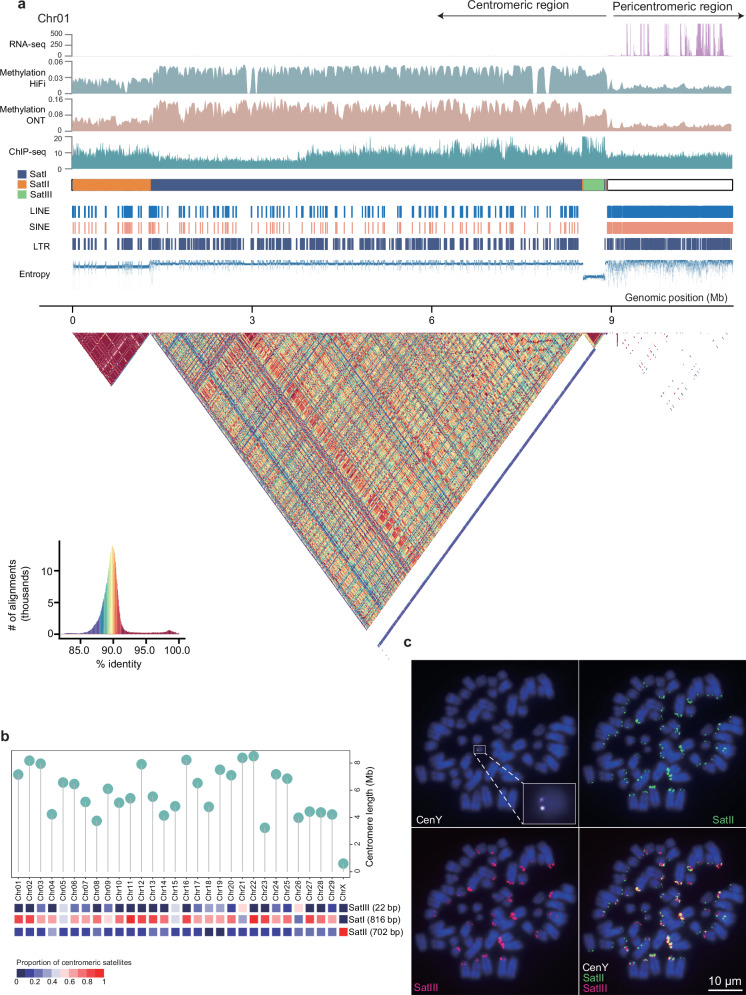
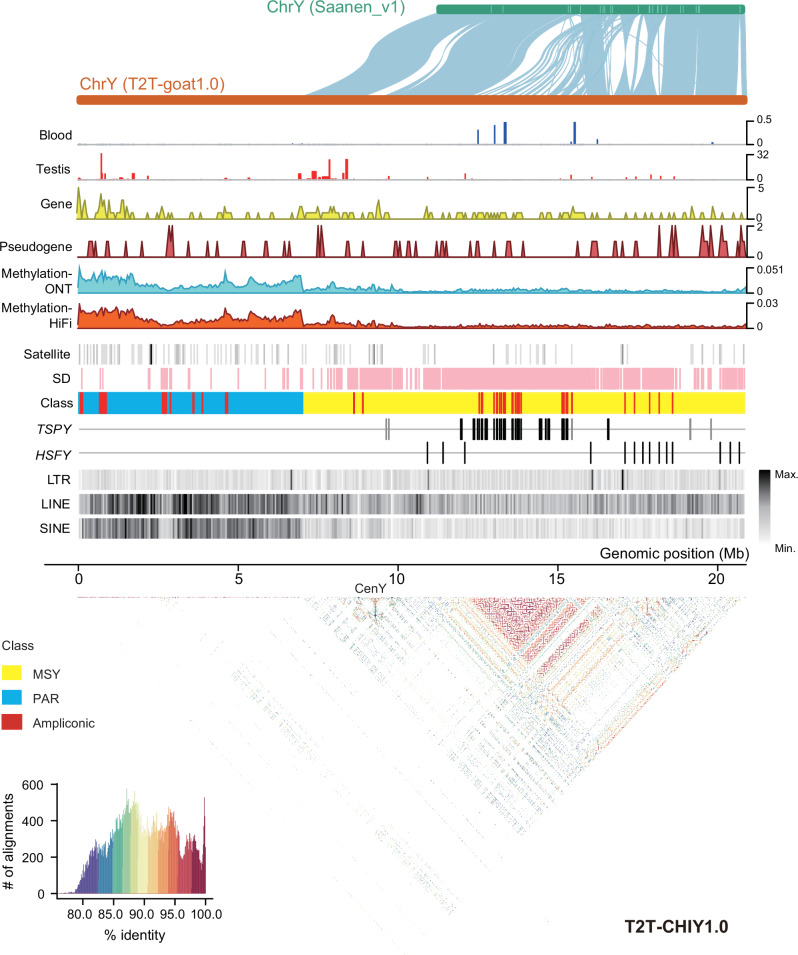
A complete goat (Capra hircus) reference genome enhances analyses of genetic variation, thus providing insights into domestication and selection in goats and related species. Here, we assemble a telomere-to-telomere (T2T) gap-free genome (2.86 Gb) from a cashmere goat (T2T-goat1.0), including a Y chromosome of 20.96 Mb. With a base accuracy of >99.999%, T2T-goat1.0 corrects numerous genome-wide structural and base errors in previous assemblies and adds 288.5 Mb of previously unresolved regions and 446 newly assembled genes to the reference genome. We sequence the genomes of five representative goat breeds for PacBio reads, and use T2T-goat1.0 as a reference to identify a total of 63,417 structural variations (SVs) with up to 4711 (7.42%) in the previously unresolved regions. T2T-goat1.0 was applied in population analyses of global wild and domestic goats, which revealed 32,419 SVs and 25,397,794 SNPs, including 870 SVs and 545,026 SNPs in the previously unresolved regions. Also, our analyses reveal a set of selective variants and genes associated with domestication (e.g., NKG2D and ABCC4) and cashmere traits (e.g., ABCC4 and ASIP).


Conflict of interest statement

Competing interests: The authors declare no competing interests.

Figures

Fig. 1
Fig. 1. Goat T2T genome assembly with 29 autosomes and chromosomes X and Y.
a Genome assembly strategy for T2T-goat1.0 and its haplotype genomes T2T-goat1.0P and T2T-goat1.0M of a buck. Trio-binning assemblies for the autosomes of T2T-goat1.0P and T2T-goat1.0M and Y chromosome were performed based on long reads of the buck and MGI short reads from its parents. b The assembly graph string shows a tangle among the four chromosomes, Chr12, Chr13, Chr19 and Chr22, due to the high similarities of centromeric sequences in gray. The centromeric regions in the assembly tangle are enlarged and shown in the right panel. c, d Genome features of Chr12 and Chr19 in T2T-goat1.0. The assembly graph tangle involving Chr12, Chr13, Chr19 and Chr22 was resolved in T2T-goat1.0, and Chr12 and Chr19 are selected to exhibit the completeness and features across the whole chromosome. The following information is provided from top to bottom: the gene density (red), the density of LINEs and SINEs (orange), the satellite density (green), the TE density (blue), error k-mer (k = 21, purple), and the minimum unique k-mer (MUK) per 100 kb. The more MUK values indicate more repetitive sequences in a 100-kb window, and more yellow and green colors indicate the presence of the centromeric regions. All the features are shown in 10-kb windows, except for MUK.
Fig. 2
Fig. 2. Synteny and improvement of the T2T-goat1.0.
a Syntenic and nonsyntenic regions between ARS1 (top) without telomeres and T2T-goat1.0 (bottom) with telomeres that are indicated by dark purple triangles. The collinearity between the two genome assemblies is shown as gray lines or blocks, and the inversions are shown in orange. The yellow bars represent the previously unresolved regions (PURs) in T2T-goat1.0. The gene density in 100-kb windows is shown as dark green bars. b The proportions of various repetitive elements in PURs. CenSat, satellite sequences in the centromeric region; SDs, segmental duplications; RepMask, repeats by RepeatMasker. c Syntenic and nonsyntenic regions of the X chromosome (ChrX) between Saanen_v1.0 (NCBI accession no. GCA_015443085.1) and T2T-goat1.0. Synteny and inversion are shown in gray and orange respectively.
Fig. 3
Fig. 3. Genomic structure of centromeric regions.
a Schematic representation showing the sequence compositions in the centromeric region of chromosome 1 (Chr01). From top to bottom: RNA-seq, expression (read counts in 1-kb windows) of genes in the pericentromeric region as indicated by an arrow on the top; Methylation by HiFi and ONT in 20-kb windows; ChIP-seq for CENP-A protein enrichment based on Phospho-CENP-A (Ser7) antibodies in 5-kb windows; Centromeric satellites of SatI (blue), SatII (orange) and SatIII (green); the occurrence of LINE, SINE, and LTR; and Entropy that was calculated for sequence complexity with low values for centromeric regions. The pairwise 10-kb sequence identity (%) heatmap in centromeric region is shown below, with color key in the bottom left corner. The boundary between centromeric and pericentromeric regions is close to the coordinate 9 Mb on Chr01. b Length distribution of centromeric regions (top) and proportions of three centromeric satellite units (bottom) on all the autosomes and the X chromosome. c, FISH results for probes of CenY (white), SatII (green) and SatIII (red). CenY is shown uniquely on the Y chromosome, with experimental replicates (n = 5). The enlarged image of CenY probe (white) and its unique binding to the Y chromosome is shown in a small box in white line in the top left panel.
Fig. 4
Fig. 4. Genomic structure of the Y chromosome.
a Genomic structure and features of the Y chromosome T2T-CHIY1.0. From top to bottom: collinearity of Y chromosomes between Saanen_v1.0 and T2T-goat1.0; Gene expression in blood and testis tissues; Protein-coding gene density; Pseudogene density; Methylation (5mC) levels estimated with ONT and HiFi reads; Satellite; Segmental duplication (SD); Class, the pseudoautosomal region (PAR) (blue), male-specific region of the Y chromosome (MSY, yellow), and ampliconic (red) regions on T2T-CHIY1.0; TSPY genes highlighted for Clade I in black and Clade II in gray; HSFY genes; LTR density; LINE density; and SINE density. The density of methylation, Satellite, LINE, SINE, and LTR is shown in 50-kb windows. The pairwise 10-kb sequence identity (%) heatmap across T2T-CHIY1.0 is shown below, with color key in the bottom left corner.
Fig. 5
Fig. 5. Selection signatures for domestication.
a Geographic distributions of domestic and wild (including bezoars) goats all over the world whose whole genome sequencing datasets are used in this study. b Genome-wide selective signals based on SNPs and FST between bezoars and the domestic goats. A horizontal dash line is used to show the top 1% selective signals. The selective signals in the PURs are highlighted in blue bars. The gene symbols are shown in black for the ones identified by both T2T-goat1.0 and ARS1, and the ones only by T2T-goat1.0 in purple. NKG2D in red uniquely identified by T2T-goat1.0 is selected to be demonstrated as followed. c Venn plot of selective regions based on SNPs and top 1% FST values between T2T-goat1.0 and ARS1 as references. d Selective region with tandem NKG2D genes on chromosome 9 (Chr09) based on the FST and π ratio of bezoars and domestic goats. e Syntenic plotting of the region with NKG2D genes on Chr09 between T2T-goat1.0 and ARS1. The selective region highlighted in blue is exactly located inside the region where tandem NKG2D genes are not assembled well in ARS1. f Collinearity of the region with tandem NKG2D genes on Chr09 between T2T-goat1.0 and ARS1. The tandem NKG2D genes in T2T-goat1.0 were found to correspond to the homologous genes not only on Chr09 of ARS1, but also on the three unplaced contigs. g Tandem NKG2D genes are in accordance with SDs and show their expressions in blood and spleen. h Selective signals based on SVs and FST between bezoars and the domestic goats. The plot is made based on the same method to that of Fig. 5b. i Venn plot of selective genes that overlapped with selective regions based on top 1% FST values of SVs identified by T2T-goat1.0 and ARS1. j A deletion was confirmed within ABCC4 (IMCG12g00097) of bezoars in IGV.
Fig. 6
Fig. 6. Selection signatures for cashmere traits.
a Selective signals based on SNPs and top 1% XP-CLR scores for cashmere trait. The plot is made based on the same method to that of Fig. 5b. b Venn plot of selective regions based on SNPs and top 1% XP-CLR scores for the cashmere trait between T2T-goat1.0 and ARS1 as references. c Selective region with tandem ABCC4 genes on Chr12 based on the XP-CLR score and π ratio of non-cashmere and cashmere goats. d Collinearity of the region with tandem ABCC4 genes on Chr12 between T2T-goat1.0 and ARS1. The selective region highlighted in blue bar is exactly located inside the region that was not assembled correctly in ARS1. e ABCC4 genes are in accordance with SDs and showed their expression in skin, blood, and spleen tissues. f Selective signals based on SVs and top 1% FST values between cashmere and non-cashmere goats. The plot is made based on the same method to that of Fig. 5b. g Venn plot of selective genes based on SVs and top 1% FST scores for the cashmere trait between T2T-goat1.0 and ARS1 as references.

References

    1. Naderi, S. et al. The goat domestication process inferred from large-scale mitochondrial DNA analysis of wild and domestic individuals. Proc. Natl Acad. Sci. USA105, 17659–17664 (2008). - PMC - PubMed
    1. Zheng, Z. et al. The origin of domestication genes in goats. Sci. Adv.6, eaaz5216 (2020). - PMC - PubMed
    1. Henkel, J. et al. Selection signatures in goats reveal copy number variants underlying breed-defining coat color phenotypes. PLoS Genet15, e1008536 (2019). - PMC - PubMed
    1. Signer-Hasler, H. et al. Runs of homozygosity in Swiss goats reveal genetic changes associated with domestication and modern selection. Genet. Sel. Evol.54, 6 (2022). - PMC - PubMed
    1. Dong, Y. et al. Sequencing and automated whole-genome optical mapping of the genome of a domestic goat (Capra hircus). Nat. Biotechnol.31, 135–141 (2013). - PubMed

Publication types

LinkOut - more resources