. 2024 Nov 20;15(1):10023.
doi: 10.1038/s41467-024-54187-0.

HOX gene expression in the developing human spine

Affiliations

HOX gene expression in the developing human spine

John E G Lawrence et al. Nat Commun. .

Abstract

Positional coding along the anterior-posterior axis is regulated by HOX genes, whose 3' to 5' expression correlates with location along this axis. The precise utilisation of HOX genes in different human cell types is not fully understood. Here, we use single-cell and spatial-transcriptomics, along with in-situ sequencing, to create a developmental atlas of the human fetal spine. We analyse HOX gene expression across cell types during development, finding that neural-crest derivatives unexpectedly retain the anatomical HOX code of their origin while also adopting the code of their destination. This trend is confirmed across multiple organs. In the axial plane of the spinal cord, we find distinct patterns in the ventral and dorsal domains, providing insights into motor pool organisation and loss of collinearity in HOXB genes. Our findings shed new light on HOX gene expression in the developing spine, highlighting a HOX gene 'source code' in neural-crest cell derivatives.


Conflict of interest statement

Competing interests: The authors declare no competing interests.

Figures

Fig. 1
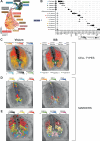
Fig. 1. An atlas of the developing fetal spine.
A Experimental overview. *Denotes samples that were not dissected into precise anatomical sections for scRNAseq. Dashed line denotes experiments performed on consecutive tissue sections; the solid box represents a whole sagittal section of the spine. PCW, Post-conception week; ISS, in-situ sequencing. B Uniform manifold approximation and projection of 175,000 fetal spinal cells. Coloured dots denote cell types demonstrated in C–E with the same colour. Teno-P, tenocyte progenitor; CC, chondrocyte; HCC, hypertrophic chondrocyte; PHCC, prehypertrophic chondrocyte. C, D, E Cell type mapping from single-cell to spatial transcriptomic samples at post-conception week 9 with heatmaps for marker genes. IVD, intervertebral disc cells; CNS, central nervous system. Source data are provided as a Source Data file.
Fig. 2
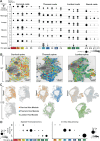
Fig. 2. Cellular landscape of the developing spinal cord.
A Uniform manifold approximation and projection of progenitors and neurons in the nascent cord. B Dotplot of mean expression values of marker genes amongst cells of the fetal cord. Dot size corresponds to the percentage of cells with non-zero expression. Pct. Exp, percentage of expressing cells; Av. Exp, average expression in cell type. C Left panel: Spatial heatmap showing cellular abundancy scores in the Post-conception week 7 spinal cord calculated using cell2location on spatial transcriptomics data. Right panel: inferred location of single cells in the PCW7 spinal cord using k-nearest neighbour prediction on in-situ sequencing data. ISS, in-situ sequencing. D Left panel: Spatial heatmaps of spatial transcriptomics data showing expression of marker genes for different neuroprogenitor populations from A & B; Right panel: gene expression of neuroprogenitor marker genes from in-situ sequencing data. E Left panel: Spatial heatmaps of spatial transcriptomics data showing expression of marker genes for different neuronal populations from A & B; Right panel: gene expression of neuronal marker genes from in-situ sequencing data. Source data are provided as a Source Data file.
Fig. 3
Fig. 3. Cellular landscape of the peripheral nervous system.
A Dotplot of mean log-normalised expression values of marker genes amongst cells of the fetal peripheral nervous system. Point size shows the percentage of cells with non-zero expression. Coloured bars correspond to cell types represented in B. SC, Schwann cell; SN, sensory neuron; Pct. Exp, percentage of expressing cells; Av. Exp, average expression in cell type. B Spatial heatmaps showing cellular abundancy scores (left panel) in Post-conception week 9 peripheral nervous system calculated using cell2location and marker gene expression for those cell types (right panel). Boxes on the left panel denote regions represented in two panels on the right. Symp, sympathetic neurons. C Spatial heatmaps showing cellular abundancy scores (left panel) in PCW9 peripheral nervous system calculated using cell2location and marker gene expression for those cell types (right panel). Box on the left panel denote regions represented in the panel on the right. SC, Schwann cell. D Uniform manifold approximation and projection (UMAP) plot visualising single-cell RNA sequencing data cell types (left panel) and contribution of each post-conception week stage to the manifold (right panel). PCW, post conception week;Teno-P, tenocyte progenitor; IVD, intervertebral disc; HCC, hypertrophic chondrocyte; PHC, prehypertrophic chondrocyte; DRG, dorsal root ganglia; CC, chondrocyte; CNS, central nervous system. Colours in the bar chart represent cell types in the adjacent colour key. E Stacked bar charts showing the fraction of each cell type in the mesenchymal (left panel), neural crest (centre panel) and neuroglial (right panel) compartments at each sample stage. CC, chondrocyte; SC, schwann cell; SN, sensory neuron; PCW; post-conception week. Source data are provided as a Source Data file.
Fig. 4
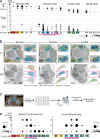
Fig. 4. The rostro-caudal HOX code.
A Dotplots quantifying log-normalised HOX gene expression across spinal segments in stationary cell types. Dot size corresponds to the fraction of cells with non-zero expression. Coloured boxes highlight genes represented in B. C, cervical; T, thoracic; L, lumbar; S, sacral; Pct. Exp, percentage of expressing cells; Av. Exp, average expression in cell type. B Spatial heatmaps of HOX gene expression across spinal segments in stationary cell types at PCW7 from spatial transcriptomics data. Dot colour in the plot corresponds to the genes coloured in (A). PCW, post-conception week. C Expression of HOX gene modules from in-situ sequencing across spinal segments. ISS, in-situ sequencing. Dot colour corresponds to expression of the gene module highlighted in the legend (orange- cervical; blue- thoracic; green- lumbar). D Dotplots quantifying log-normalised HOX gene expression levels for spatial transcriptomics and in-situ sequencing data. Left panel: spatial transcriptomics data. Right panel: in-situ sequencing data. Dot size corresponds to the fraction of voxels/cells with non-zero expression. C, cervical; T, thoracic; L, lumbar. Coloured boxes highlight genes represented in B. Source data are provided as a Source Data file.
Fig. 5
Fig. 5. HOX gene expression in neural crest-derived cells.
A Dotplots quantifying log-normalised HOX gene expression across spinal segments in stationary, haematopoietic and neural crest cell types. Dot size corresponds to the fraction of cells with non-zero expression. Coloured boxes highlight genes represented in B. C, cervical; T, thoracic; L, lumbar; S, sacral; Pct. Exp, percentage of expressing cells; Av. Exp, average expression in cell type. B Top panel: Spatial heatmaps of HOX gene expression in neural crest cell types at PCW9 from spatial transcriptomics data. Dot colour represents genes coloured in A. Bottom panel: Expression of HOX gene modules from in-situ sequencing across spinal segments. Dot colour corresponds to expression of the gene module highlighted in the legend (orange- cervical; blue- thoracic; green- lumbar). PCW = Post-conception week. ISS = in-situ sequencing. C Schematic illustrating workflow for analysis of in-situ sequencing data at single cell resolution. ISS, in situ-sequencing. D Dotplots quantifying log-normalised expression levels in B.Left panel: spatial transcriptomics data. Right panel: in-situ sequencing data. Dot size corresponds to the fraction of voxels/cells with non-zero expression. C, cervical; T, thoracic; L, lumbar. Source data are provided as a Source Data file.
Fig. 6
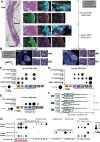
Fig. 6. Categorising dorsal root ganglion (DRG) neurons by HOX gene expression.
A RNA-In Situ Hybridisation of the PCW8 whole spine in the parasagittal plane for HOXB8, HOXB4, HOXC10 & NTRK1. The inset high magnification boxes represent the region in the corresponding box on the lower magnification image. Rectangular boxes show higher magnification images from each region with examples of NTRK1+ve cells that express either none of the HOX genes stained for (white asterisk), both local HOX gene and HOXB8 (red asterisk), HOXB8 only (yellow asterisk) or the local HOX gene only (green asterisk).DRG, dorsal root ganglion; PCW, post-conception week. B In-situ sequencing of the PCW7 spine, including dorsal root ganglion in the axial plane. Red rectangular boxes indicate higher magnification image areas from each region with highlighted examples of NTRK1+ve cells that express either none of the HOX genes (white outlines), both local HOX gene and HOXB8 (red outline), HOXB8 only (yellow outline) or the local HOX gene only (green outline).DRG, dorsal root ganglion; ISS, in-situ sequencing; PCW, post-conception week. C Dotplot of mean log-normalised expression values of HOX genes amongst cervical DRG neurons in in-situ sequencing data, categorised by expression pattern. Point size shows the percentage of cells with non-zero expression. ISS, in-situ sequencing; Pct Exp, Percentage of cells expressing; Av exp, Average expression in group. D Dotplot of mean log-normalised expression values of HOX genes amongst lumbar DRG neurons, categorised by expression pattern. Point size shows the percentage of cells with non-zero expression. ISS, in-situ sequencing; Pct Exp, Percentage of cells expressing; Av exp, Average expression in group. E Dotplot of mean log-normalised expression values of HOX genes amongst thoracic DRG neurons, categorised by expression pattern. Point size shows the percentage of cells with non-zero expression. ISS, in-situ sequencing; Pct Exp, Percentage of cells expressing; Av exp, Average expression in group. F Box plot quantifying expression ratios of HOXC9, A9 & C10 vs SOX10 in neural crest-derived cells at PCW9 and 12 in the lumbar regions. The box contains the 25th to 75th percentiles of the data, with the central line denoting the median value. The upper whisker extends from the median to the largest value that is no further than the 1.5* inter-quartile range (IQR). The lower whisker extends from the median to the smallest value, at most 1.5* IQR. Wilcoxon rank-sum test, two-sided, with adjustment for multiple comparisons. PCW, post-conception week. Orange dots represent PCW9 cells, blue dots represent PCW12 cells. G Dotplot quantifying log-normalised HOX gene and classical marker gene expression in stationary and neural crest cell types within the gastrointestinal system. Dot size corresponds to the fraction of cells with non-zero expression. Pct Exp, Percentage of cells expressing; Av exp, Average expression in group. Source data are provided as a Source Data file.
Fig. 7
Fig. 7. Patterning of the fetal spinal cord in the axial planes.
A Spatial heatmaps of selected HOXB gene expression in the PCW9 cervical spinal cord. PCW, post-conception week. B Spatial heatmaps of spatially-variable HOX gene expression in the axial plane of the fetal spinal cord at PCW9 (upper row) and PCW7 (lower row). White asterisk indicates voxels with co-expression of motor column-defining HOX genes previously reported as mutually exclusive; HOXC6 & HOXC9 for cervical and thoracic samples, HOXC9 & HOXC10 for lumbar sample. Dot colour corresponds to expression of genes highlighted in the legend (reds- HOXB8/9, greens- HOXC5/6, blues-HOXC8/9, purples-HOXC10/D10). C Upper panel: In-situ sequencing data at PCW7 in the axial plane showing ventral cord cells that co-express motor column-defining HOX genes previously reported as mutually exclusive; HOXC6 & HOXC9 for cervical and thoracic samples, HOXC9 & HOXC10 for lumbar sample. Orange cells are co-expressing. Red boxes indicate zoomed regions for the lower panels. Lower Panel: High magnification in-situ sequencing images showing co-expression of HOX genes. Cells highlighted with a white outline are co-expressing. ISS, in-situ sequencing. Source data are provided as a Source Data file.
Fig. 8
Fig. 8. Patterning of the fetal spinal cord in the sagittal plane.
A In-situ sequencing data showing expression of classical motor-column associated HOX genes in the sagittal plane, together with HOXB8 expression. C1= first cervical vertebra, T1= first thoracic vertebra, L1= first lumbar vertebra, S1= first sacral vertebra. B In-situ sequencing data at post-conception week 8 in the sagittal plane showing ventral cord cells that co-express motor column-defining HOX genes previously reported as mutually exclusive; HOXC6 & HOXC9 for the cervical and thoracic cord, HOXC9 & HOXC10 for the lumbar cord. Orange cells are co-expressing. C Dotplot of mean expression values of HOX genes amongst single cells of the fetal cord, derived from single-cell RNA sequencing. Pct. Exp, percentage of expressing cells; Av. Exp, average expression in cell type.

References

    1. Sheng, G., Martinez, A. A. & Sutherland, A. The primitive streak and cellular principles of building an amniote body through gastrulation. Science374, abg1727 (2021). - PubMed
    1. Lewis, E. B. A gene complex controlling segmentation in Drosophila. Nature276, 565–570 (1978). - PubMed
    1. Harding, K., Wedeen, C., McGinnis, W. & Levine, M. Spatially regulated expression of homeotic genes in Drosophila. Science229, 1236–1242 (1985). - PubMed
    1. Soshnikova, N. & Duboule, D. Epigenetic temporal control of mouse Hox genes in vivo. Science324, 1320–1323 (2009). - PubMed
    1. Neijts, R. et al. Polarized regulatory landscape and Wnt responsiveness underlie Hox activation in embryos. Genes Dev.30, 1937–1942 (2016). - PMC - PubMed

Publication types

Substances

LinkOut - more resources