. 2024 Nov 20;15(1):10067.
doi: 10.1038/s41467-024-53687-3.

A framework for conducting GWAS using repeated measures data with an application to childhood BMI

Affiliations

A framework for conducting GWAS using repeated measures data with an application to childhood BMI

Kimberley Burrows et al. Nat Commun. .

Abstract

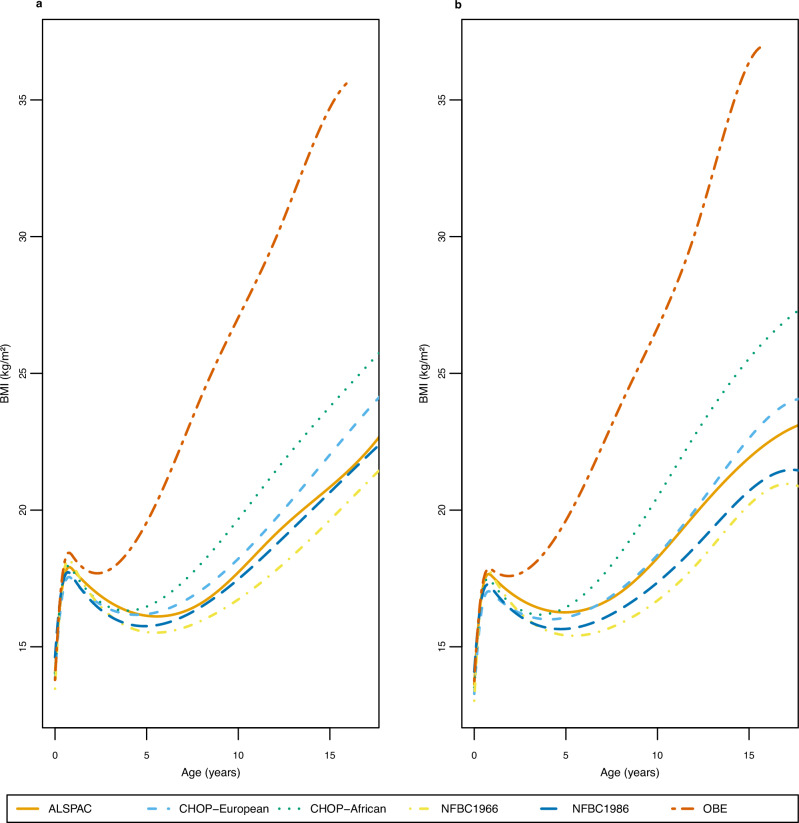
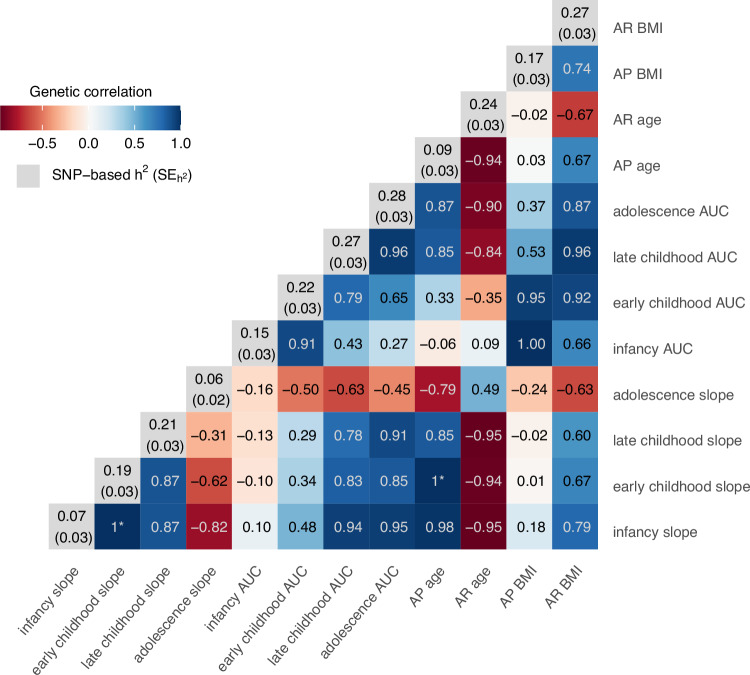
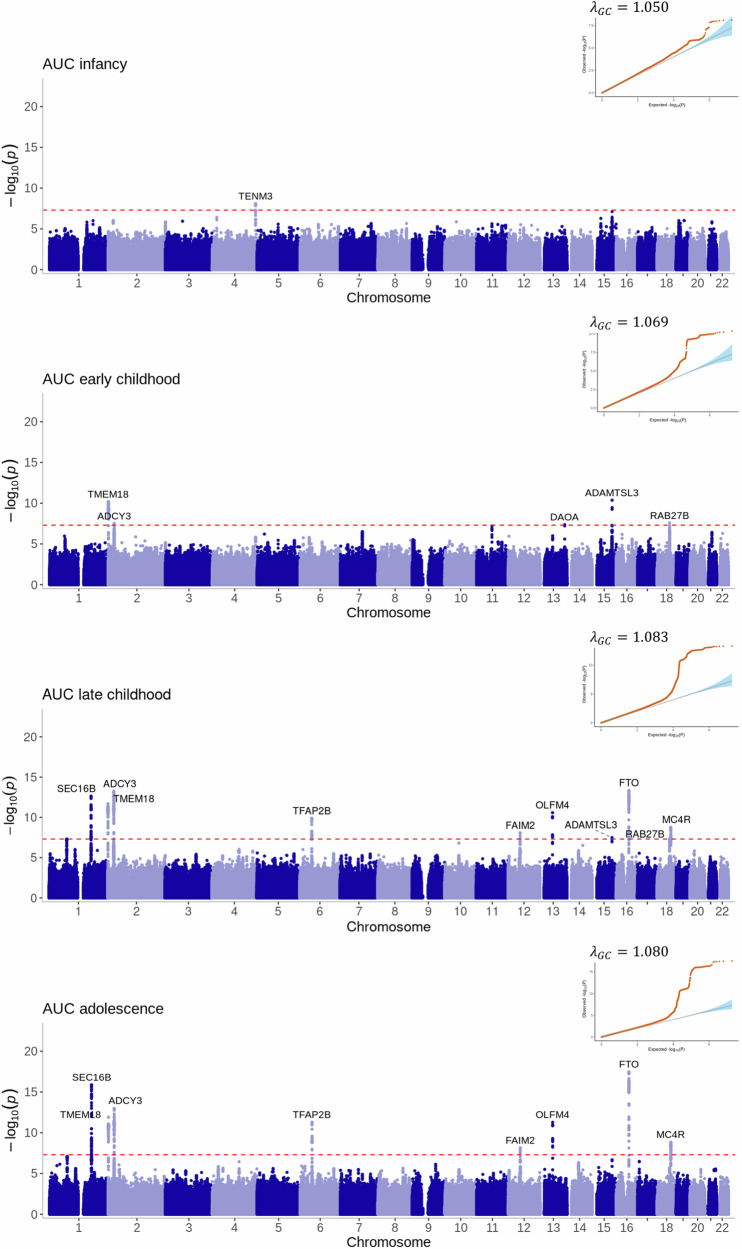
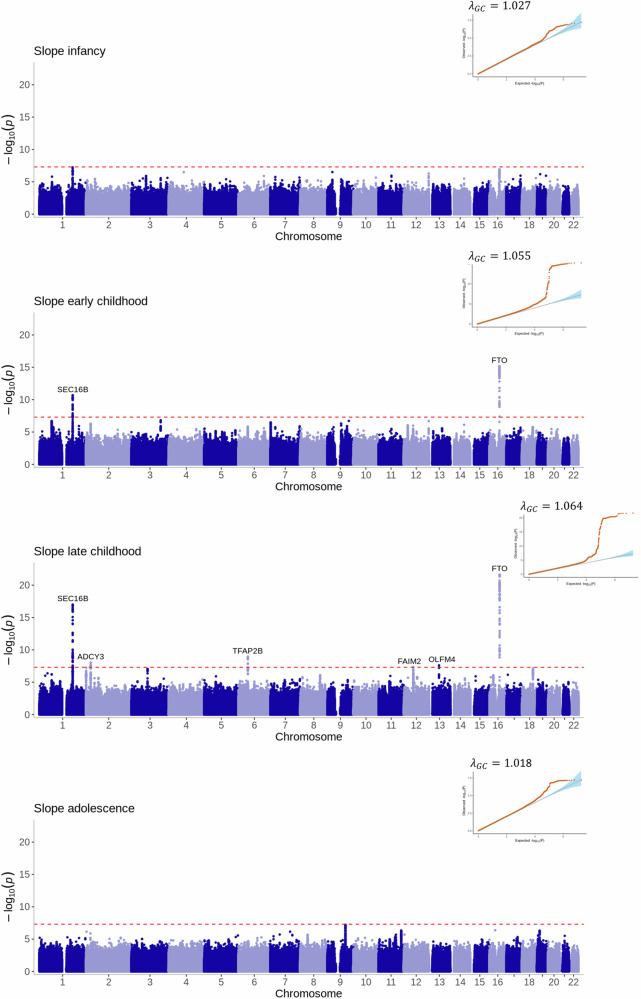
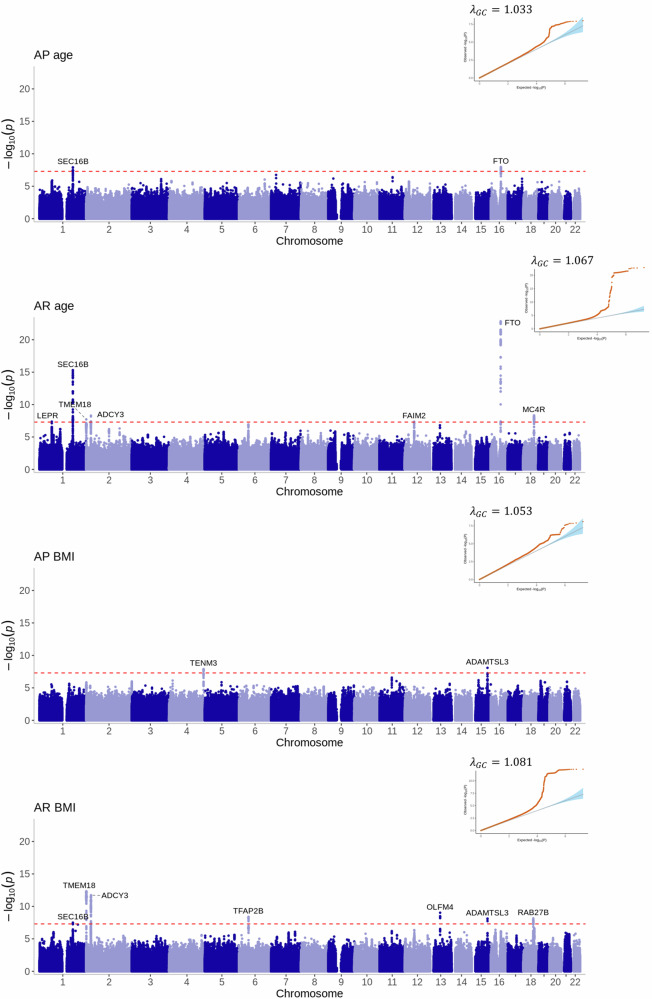
Genetic effects on changes in human traits over time are understudied and may have important pathophysiological impact. We propose a framework that enables data quality control, implements mixed models to evaluate trajectories of change in traits, and estimates phenotypes to identify age-varying genetic effects in GWAS. Using childhood BMI as an example trait, we included 71,336 participants from six cohorts and estimated the slope and area under the BMI curve within four time periods (infancy, early childhood, late childhood and adolescence) for each participant, in addition to the age and BMI at the adiposity peak and the adiposity rebound. GWAS of the 12 estimated phenotypes identified 28 genome-wide significant variants at 13 loci, one of which (in DAOA) has not been previously associated with childhood or adult BMI. Genetic studies of changes in human traits over time could uncover unique biological mechanisms influencing quantitative traits.


Conflict of interest statement

Competing interests: DAL received support from Medtronic Ltd and Roche Diagnostics for research unrelated to that presented here. KT acted as Expert Witness to the High Court in England, called by the UK MHRA, defendants in a case on hormonal pregnancy tests and congenital anomalies 2021/22. All other authors report no competing interests.

Figures

Fig. 1
Fig. 1. Average BMI trajectories predicted by our final chosen model (cubic spline function in the fixed effects with cubic slope function in the random effects) for each of the six cohorts.
Males are presented in panel (a) and females in panel (b). BMI trajectories were predicted from 2 weeks to 17 years, which corresponds to the age range that the slopes and AUCs were predicted from, in all cohorts except OBE where they were predicted from 2 weeks to 16 years due to the lack of data after age 16. The year(s) of recruitment for each cohort are as follows: ALSPAC: 1991–1993, CHOP: 1988-present, NFBC1966: 1966, NFBC1986: 1985–1986, OBE: 1981–2001. Source data are provided as a Source Data file.
Fig. 2
Fig. 2. SNP-based heritability (h2) and genome-wide genetic correlation (rg) between the twelve estimated phenotypes summarising growth across early life.
SNP-based heritabilities, presented on the diagonals with standard errors in brackets (SEh2), and genetic correlations, presented on the off diagonals, were derived using linkage disequilibrium score regression. SNP-based heritabilities for the age at the adiposity peak (AP age), infancy and adolescent slope are low, with high standard errors (resulting in a z-score <4), and therefore the genetic correlations with these traits are unreliable but are shown for completeness. *estimates of genetic correlation were >1; given this is not possible we have set these to one. AP=adiposity peak, AR=adiposity rebound, AUC=area under the curve. Source data for the genetic correlations are provided as a Source Data file. Source data for the heritability estimates are available in Supplementary Data 6.
Fig. 3
Fig. 3. Manhattan plots and quantile-quantile (QQ) plots of the meta-analyses for the area under the curve estimated phenotypes across infancy (0–0.5 years), early childhood (1.5–3.5 years), late childhood (6.5–10 years) and adolescence (12–17 years).
The two-sided association P value on the –log10 scale obtained from the inverse-variance-weighted fixed-effects meta-analysis for each of the SNPs (y-axis) was plotted against the genomic position (NCBI Build 37; x-axis). Loci are labelled with their nearest gene annotated by LocusZoom. The red dotted line in the Manhattan plots corresponds to the genome-wide significance level of P < 5×10⁻⁸, which accounts for multiple testing. The red dots in the QQ plots are the two-sided association P-values, the blue shading represents the 95% confidence bands of the expected values. λgc is the genomic inflation factor.
Fig. 4
Fig. 4. Manhattan plots and quantile-quantile (QQ) plots of the meta-analyses for the slope estimated phenotypes across infancy (0–0.5 years), early childhood (1.5–3.5 years), late childhood (6.5–10 years) and adolescence (12–17 years).
The two-sided association P value on the –log10 scale obtained from the inverse-variance-weighted fixed-effects meta-analysis for each of the SNPs (y-axis) was plotted against the genomic position (NCBI Build 37; x-axis). Loci are labelled with their nearest gene annotated by LocusZoom. The red dotted line in the Manhattan plots corresponds to the genome-wide significance level of P < 5 × 10-8, which accounts for multiple testing. The red dots in the QQ plots are the two-sided association P values, the blue shading represents the 95% confidence bands of the expected values. λgc is the genomic inflation factor.
Fig. 5
Fig. 5. Manhattan plots and quantile-quantile (QQ) plots of the meta-analyses for the age and BMI at adiposity peak and adiposity rebound estimated phenotypes.
The two-sided association P-value on the –log10 scale obtained from the inverse-variance-weighted fixed-effects meta-analysis for each of the SNPs (y-axis) was plotted against the genomic position (NCBI Build 37; x-axis). Loci are labelled with their nearest gene annotated by LocusZoom. The red dotted line in the Manhattan plots corresponds to the genome-wide significance level of P < 5×10⁻⁸, which accounts for multiple testing. The red dots in the QQ plots are the two-sided association P-values, the blue shading represents the 95% confidence bands of the expected values. λgc is the genomic inflation factor.

Update of

References

    1. Smith, E. N. et al. Longitudinal genome-wide association of cardiovascular disease risk factors in the Bogalusa Heart Study. PLOS Genet.6, e1001094 (2010). - PMC - PubMed
    1. Warrington, N. M. et al. A genome-wide association study of body mass index across early life and childhood. Int J. Epidemiol.44, 700–712 (2015). - PMC - PubMed
    1. Smith, A. D. et al. A structured approach to hypotheses involving continuous exposures over the life course. Int J. Epidemiol.45, 1271–1279 (2016). - PMC - PubMed
    1. Gouveia, M. H. et al. Genetics of cognitive trajectory in Brazilians: 15 years of follow-up from the Bambuí-Epigen Cohort Study of Aging. Sci. Rep.9, 18085 (2019). - PMC - PubMed
    1. Gouveia, M. H. et al. Trans-ethnic meta-analysis identifies new loci associated with longitudinal blood pressure traits. Sci. Rep.11, 4075 (2021). - PMC - PubMed

Publication types

LinkOut - more resources