. 2024 Nov 20;15(1):9755.
doi: 10.1038/s41467-024-53874-2.

Increased translation driven by non-canonical EZH2 creates a synthetic vulnerability in enzalutamide-resistant prostate cancer

Affiliations

Increased translation driven by non-canonical EZH2 creates a synthetic vulnerability in enzalutamide-resistant prostate cancer

Shankha S Chatterjee et al. Nat Commun. .

Abstract

Overcoming resistance to therapy is a major challenge in castration-resistant prostate cancer (CRPC). Lineage plasticity towards a neuroendocrine phenotype enables CRPC to adapt and survive targeted therapies. However, the molecular mechanisms of epigenetic reprogramming during this process are still poorly understood. Here we show that the protein kinase PKCλ/ι-mediated phosphorylation of enhancer of zeste homolog 2 (EZH2) regulates its proteasomal degradation and maintains EZH2 as part of the canonical polycomb repressive complex (PRC2). Loss of PKCλ/ι promotes a switch during enzalutamide treatment to a non-canonical EZH2 cistrome that triggers the transcriptional activation of the translational machinery to induce a transforming growth factor β (TGFβ) resistance program. The increased reliance on protein synthesis creates a synthetic vulnerability in PKCλ/ι-deficient CRPC.


Conflict of interest statement

Competing interests: The authors declare no competing interests.

Figures
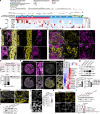
Fig. 1
Fig. 1. PKCλ/ι loss upregulates EZH2 in prostate cancer.
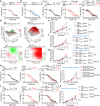
a Heatmap of RNAseq data from the International SU2C/PCF Dream Team metastatic CRPC dataset with the inclusion of only the top PRKCI-low (n = 30) and PRKCI-high (n = 30) samples shown. b Representative images of immunofluorescence staining for EZH2, PKCλ/ι, and DAPI in prostates from TRAMP+ mice (n = 3 mice). Scale bars 100 μm. c Representative images of immunofluorescence staining for EZH2, PKCλ/ι, and DAPI in prostate tumors from Ptenf/fRb1f/fMYCN+PbCre+ mice (n = 3 mice per group). Scale bars, 100 μm. d, e Quantification of nuclear EZH2 staining in CRPC samples (n = 177) from a tissue microarray (WCM TMA). CRPC patients were categorized in high or low PKCλ/ι (d). Representative images of immunofluorescence staining for EZH2, PKCλ/ι, and DAPI in CRPC samples from the TMA (n = 177). Scale bars, 100 μm (e). f Heatmap of RNA expression for neuroendocrine (NE)-related genes of human prostate organoids from GSE181374. g Immunoblots in human adenocarcinoma organoids (MSKPCa3) and NEPC organoids (WCM1262, WCM1078, and WCM154), and quantification (n = 3 independent experiments). h Representative images of immunofluorescence staining for EZH2, and DAPI in prostate tumors from Ptenf/fPbCre+ and Ptenf/fPrkcif/fPbCre+ mice (n = 3 mice per group). Scale bars, 100 μm. i Immunoblots in sgPRKCI and sgC LNCaP cells (n = 3 independent experiments). j Immunofluorescence staining of EZH2 in sgPRKCI and sgC LNCaP cells and quantification of EZH2 intensity (sgC: n = 181, sgPRKCI: n = 139 cells examined). Scale bars, 20 μm. k Representative images of immunofluorescence staining for EZH2, and Phalloidin in PtenΔ/Δ and PtenΔ/ΔPrkciΔ/Δ prostate organoids (n = 3 biological replicates). Scale bars, 20 μm. l Immunoblots in nuclear fraction from PtenΔ/Δ,PtenΔ/ΔPrkciΔ/Δ, PtenΔ/ΔRb1Δ/Δ, and PtenΔ/ΔRb1Δ/ΔPrkciΔ/Δ prostate organoids, and quantification (n = 3 independent experiments). Data shown as mean ± SEM (g, j, l). Pearson correlation of pairwise comparisons with PRKCI (a). Two-tailed Chi-square test (d). Two-tailed unpaired Student’s t-test (g, j, l). Source data are provided as a Source Data file.
Fig. 2
Fig. 2. PKCλ/ι promotes EZH2 degradation through a ubiquitin-dependent mechanism.
a Immunoblots in HEK293T cells transfected with the indicated plasmids and quantification of HA-EZH2 (n = 3 independent experiments). b Immunoblots in LNCaP cells transfected with the indicated plasmids and treated with cycloheximide (CHX) (50 μg/ml) and MG132 (10 μM), Bafilomycin A1 (100 nM) or MLN4924 (1 μM) for 12 h, and quantification of HA-EZH2 (n = 3 independent experiments). c sgPRKCI and sgC LNCaP cells were incubated with 50 μg/ml of CHX at indicated time points, and quantification of EZH2 (n = 3 independent experiments). d Immunoblotting of EZH2 immunoprecipitates in sgPRKCI and sgC LNCaP cells, transfected with the indicated plasmids (n = 2 independent experiments). e Signal Intensity of EZH2-RBBP6 interaction measured by Mass Spectrometry in sgC and sgPRKCI HEK293T cells transfected with HA-EZH2 (n = 1 sample per condition). f Immunoblotting of HA-tagged immunoprecipitates of sgPRKCI and sgC LNCaP cells, transfected with the indicated plasmids (n = 2 independent experiments). g Immunoblotting of EZH2 immunoprecipitates in sgPRKCI and sgC LNCaP cells (n = 2 independent experiments). h Immunoblots in HEK293T cells, transfected with the indicated plasmids and quantification of EZH2 (n = 3 independent experiments). i Immunoblots in LNCaP cells, transduced with siRNAs and quantification of EZH2 (n = 3 independent experiments). j Immunofluorescence staining of EZH2 in LNCaP cells transduced with siRNAs and quantification of the EZH2 intensity (siC: n = 143, siRBBP6: n = 138 cells examined). Scale bars 10 μm. k Immunoblots in sgPRKCI and sgC LNCaP cells, transduced with the indicated siRNAs and quantification of EZH2 (n = 3 independent experiments). l Immunoblotting of EZH2 immunoprecipitates in LNCaP cells, transduced with the indicated siRNAs (n = 2 independent experiments). m LNCaP cells, transduced with the indicated siRNAs, were treated as in (c), and EZH2 quantification (n = 3 independent experiments). Immunoblot experiments were performed at least two times independently, with similar results. Data shown as mean ± SEM of 3 biological replicates (a, b, c, h, i, k, m). Two-tailed unpaired Student’s t-test (a, b, h, i, j, k). Two-way ANOVA (c, m). Source data are provided as a Source Data file.
Fig. 3
Fig. 3. PKCλ/ι-mediated EZH2 phosphorylation regulates its protein stability.
a In vitro phosphorylation of HA-tagged EZH2 by recombinant PKCλ/ι (n = 3 independent experiments). b Identification of EZH2 phosphorylation sites by PKCλ/ι: HA-EZH2, in vitro phosphorylated with recombinant PKCλ/ι, or HA-EZH2 transfected into sgC and sgPRKCI cells were analyzed by MS (n = 1 sample per condition). c In vitro phosphorylation of HA-EZH2WT or EZH2S375/380AA as in (a) (n = 2 independent experiments). d Alignment of the amino acid sequence of human EZH2 (372-383 aa) with orthologs in other species. e EZH2WT or EZH2S375/380AA LNCaP cells were incubated with CHX (50 μg/ml) at indicated time points, and EZH2 levels were quantified (n = 3 independent experiments). f Immunofluorescent staining of EZH2 in EZH2WT or EZH2S375/380AA LNCaP cells and quantification (EZH2WT: n = 91, EZH2S375/380AA: n = 83 cells examined). Scale bars 10 μm. g, h Immunoblots of HA-tagged immunoprecipitates in HEK293T, transfected for the indicated plasmids (n = 2 independent experiments). i Immunoblots in nuclear lysates from sgPRKCI and sgC LNCaP cells (n = 2 independent experiments). j Immunofluorescence staining of pEZH2(S380) in sgPRKCI and sgC LNCaP cells (sgC: n = 459, sgPRKCI: n = 270 cells examined), and quantification. Scale bars 10 μm. k Immunoblots in PtenΔ/Δ, PtenΔ/ΔPrkciΔ/Δ, PtenΔ/ΔRb1Δ/Δ, and PtenΔ/ΔRb1Δ/ΔPrkciΔ/Δ prostate organoids (n = 3 independent experiments). l Immunofluorescence staining for pEZH2(S380), EZH2, PKCλ/ι, SYP and DAPI in prostate tumors from the NEPC model Ptenf/fRb1f/fMYCN+PbCre+ (n = 3 mice per group). Scale bars 200 μm and 20 μm. m Immunofluorescence staining for pEZH2(S380), EZH2, PKCλ/ι, and DAPI in human NEPC PDOs WCM154 (n = 1). Scale bars, 100 μm and 20 μm. n Immunoblots in human adenocarcinoma (MSKPCa3) and NEPC (WCM1262, WCM1078, WCM154) organoids (n = 3 independent experiments). o Immunoblots in control and PRKCI-overexpressed (OE) NEPC PDOs WCM1078 and WCM154 (n = 2 independent experiments). Immunoblot experiments were performed at least two times independently, with similar results. Data shown as mean ± SEM of the biological replicates (e). Two-way ANOVA (e). Two-tailed unpaired Student’s t-test (f, j). Source data are provided as a Source Data file.
Fig. 4
Fig. 4. EZH2 inhibitors restore ENZA sensitivity in PKCλ/ι-deficient PCa cells.
a, b Dose-response curves using CFU assay for 14 days to determine the IC50 of ENZA for sgC and sgPRKCI (a) or EZH2WT, EZH2S375/380AA (b) LNCaP cells. IC50 value as the average of two biological replicates. c Dose-response curves using CFU assay for 14 days to determine the IC50 of ENZA treated with vehicle or 5 μM GSK126 in sgC and sgPRKCI LNCaP cells. IC50 value as the average of two biological replicates. d sgC and sgPRKCI LNCaP cells were treated with ENZA and GSK126 alone or combined and drug synergism was assessed using Bliss Independence method (n = 3 technical replicates). The positive drug synergy is represented as red peaks and the Bliss synergy scores are indicated on the 3-D plots. e Growth curves of sgC and sgPRKCI LNCaP cells treated with 5 μM ENZA and 5 μM GSK126 alone or combined. Representative experiment of two biological replicates. fg Growth curves of PtenΔ/Δ and PtenΔ/ΔPrkciΔ/Δ (f) and PtenΔ/ΔRb1Δ/Δ and PtenΔ/ΔRb1Δ/ΔPrkciΔ/Δ (g) mouse prostate organoids treated with 5 μM ENZA and 10 μM GSK126 alone or combined. Representative experiment of two biological replicates. h Dose-response curves using CFU assay for 14 days to determine the IC50 of ENZA treated with vehicle or 75 nM EPZ6438 in sgC and sgPRKCI LNCaP cells. IC50 value as the average of two biological replicates. i Growth curves of WCM1262 and WCM1078 human prostate organoids treated with 10 μM ENZA and 10 μM EPZ6438 alone or combined. Representative experiment of two biological replicates. j Dose-response curves using CFU assay for 14 days to determine the IC50 of ENZA treated with vehicle or 1 μM MS1943 in sgC and sgPRKCI LNCaP cells. IC50 value is the average of two biological replicates. k Growth curves of PtenΔ/Δ and PtenΔ/ΔPrkciΔ/Δ mouse organoids treated with 5 μM ENZA and 5 μM MS1943 alone or combined. Representative experiment of two biological replicates. Data shown as mean ± SD of technical triplicates (e, f, g, i, k). Bliss synergy scores were calculated using SynergyFinder 2.2 (d). Two-way ANOVA (e, f, g, i, k). Source data are provided as a Source Data file.
Fig. 5
Fig. 5. PKCλ/ι loss promotes NEPC features by reducing the canonical EZH2 function.
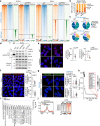
a Heatmaps (CUT&RUN) for EZH2, H3K27me3 and H3K4me3 ± 8 kb from the centers of canonical EZH2+/H3K27me3+ peaks (EZH2 ensemble; top panels) or non-canonical EZH2+/H3K27me-/H3K4me3+ peaks (EZH2 solo; bottom panels) in sgPRKCI and sgC LNCaP cells treated or not with 10 μM ENZA for 72 h (n = 3 biological replicates). b Percentage of EZH2 solo peaks and ensemble peaks found in (a) (n = 3 biological replicates). c Pie-chart plot showing the genomic distribution of peaks for EZH2 ensemble or solo in sgPRKCI and sgC LNCaP cells, treated as in (a) (n = 3 biological replicates). d Immunoblotting of nuclear lysates and EZH2 immunoprecipitates of sgC and sgPRKCI LNCaP cells, treated as in (a) (n = 2 independent experiments). eg Proximity Ligation Assay (PLA) of EZH2-EED or EZH2-SUZ12 in sgPRKCI (EZH2-EED: n = 25; EZH2-SUZ12: 40 cells examined) and sgC (EZH2-EED: n = 33; EZH2-SUZ12: 40 cells examined) LNCaP cells (e), PtenΔ/Δ (EZH2-EED: n = 39; EZH2-SUZ12: 39 cells examined) and PtenΔ/ΔPrkciΔ/Δ (EZH2-EED: n = 39; EZH2-SUZ12: 34 cells examined) mouse organoids (f), or PRKCI-OE (EZH2-EED: n = 82; EZH2-SUZ12: 75 cells examined) and Control (EZH2-EED: n = 68; EZH2-SUZ12: 75 cells examined) NEPC PD)Os WCM154 (g) treated as in (a), and quantification. Scale bars, 10 μm. h Enrichment of differential transcription factor motifs between EZH2 ensemble peaks (all genomic regions) in sgPRKCI and sgC LNCaP cells, plotted by ranks generated from their associated p values (n = 3 biological replicates). i Top 15 GO pathways from findGO.pl, analysis of genes with unique EZH2 ensemble peaks in sgPRKCI and sgC LNCaP cells treated with ENZA (n = 3 biological replicates). j Averaged signal intensities and Heatmap (CUT&RUN) for EZH2 ± 4 kb from the centers of EZH2 ensemble peaks in genes from neuronal-related pathways (n = 3 biological replicates). Immunoblot experiments were performed at least two times independently with similar results. Data shown as mean ± SEM (eg). Fisher’s exact test (b). Two-tailed unpaired Student’s t-test (eg). Source data are provided as a Source Data file.
Fig. 6
Fig. 6. PKCλ/ι loss promotes ENZA resistance through a non-canonical EZH2:YY1 complex.
a Enrichment of differential transcription factor motifs between EZH2 solo peaks (all genomic regions) in sgPRKCI and sgC LNCaP cells, plotted by ranks generated from their associated p values (n = 3 biological replicates). b Heatmap of CUT&RUN for YY1 ± 8 kb from the centers of EZH2 solo or ensemble peaks in sgPRKCI and sgC LNCaP cells treated with 10 μM ENZA for 72 h (n = 3 biological replicates). c, Venn diagrams showing the overlap of EZH2 solo or ensemble peaks with YY1 in sgPRKCI and sgC LNCaP cells treated as in (b) (n = 3 biological replicates). d, e Immunoblots and quantification of soluble EZH2 (d) or YY1 (e) extracted using sequential salt extraction assay from sgC and sgPRKCI LNCaP cells treated or not with ENZA (n = 3 independent experiments). f Immunoblots of EZH2 immunoprecipitates in LNCaP cells treated or not with 10 μM ENZA for 72 h (n = 2 independent experiments). g PLA of EZH2 and YY1 in sgC and sgPRKCI LNCaP cells treated or not with 10 μM GSK126 and 10 μM ENZA for 72 h and quantification (sgC-DMSO: n = 40, sgPRKCI-DMSO: n = 41, sgC-GSK126: n = 43, sgPRKCI-GSK126: n = 42 cells examined). Scale bars, 10 μm. h, i PLA of EZH2 and YY1 in PtenΔ/Δ and PtenΔ/ΔPrkciΔ/Δ, PtenΔ/ΔRb1Δ/Δ and PtenΔ/ΔRb1Δ/ΔPrkciΔ/Δ mouse prostate organoids (h), or PRKCI-overexpressing (PRKCI-OE) and control NEPC PDOs WCM154 (i), with quantification (PtenΔ/Δ: n = 51, PtenΔ/ΔPrkciΔ/Δ: n = 34, PtenΔ/ΔRb1Δ/Δ: n = 30, PtenΔ/ΔRb1Δ/ΔPrkciΔ/Δ: n = 26, PRKCI-OE: n = 42, Control WCM154: n = 41 cells examined). Scale bars, 10 μm. j, k Dose-response curves using CFU assay for 14 days to determine IC50 of ENZA for sgC and sgPRKCI LNCaP cells transduced with the indicated siRNAs or treated with 10 μM GSK126. IC50 value is the average of two biological replicates. Data shown as mean ± SD (d, e) and mean ± SEM (g, h, i) of 3 biological replicates. Two-tailed unpaired Student’s t-test (d, e, g, h, i). Source data are provided as a Source Data file.
Fig. 7
Fig. 7. PKCλ/ι loss enhances protein translation through the non-canonical EZH2:YY1 complex.
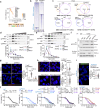
a findGO.pl analysis of upregulated genes that exhibit EZH2 solo cobound with YY1 in sgPRKCI cells treated with 10 μM ENZA for 72 h (n = 3 biological replicates). b GSEA from RNA-seq of sgPRKCI and sgC LNCaP cells treated as in (a) using C2, and C5 gene sets (n = 3 biological replicates). FDR, false discovery rate. c EZH2, YY1, H3K4me3, and H3K27me3 binding (depth normalized) at the indicated loci in sgPRKCI and sgC LNCaP cells treated as in (a) (n = 3 biological replicates). d qPCR from sgPRKCI and sgC LNCaP cells, transduced with siRNAs, and treated as in (a) (n = 3 biological replicates). e Immunoblots in sgPRKCI and sgC LNCaP cells, transduced with siRNAs, and treated as in (a) (n = 2 independent experiments). f Dot plot pathway enrichment map showing the pathway enriched in each cluster of TRAMP+ (n = 1 tumor sample from 1 mouse) and TRAMP+Prkcif/fPbCre+ mice (n = 3 tumor samples from 1 mouse). g Puromycylation assay. Cells were stimulated with 1 μM Puromycin for 30 min, and puromycin-incorporated peptides were detected by immunoblotting. h Puromycylation assay in sgPRKCI and sgC LNCaP cells, treated as in (a), and quantification (n = 3 independent experiments). i Puromycin staining in sgPRKCI and sgC LNCaP cells, treated as in (a) (n = 3 biological replicates). Scale bars, 10 μm. j, k Puromycylation assay in PtenΔ/Δ and PtenΔ/ ΔPrkciΔ/Δ prostate organoids mouse (j) or EZH2WT and EZH2S375/380AA LNCaP cells (k) treated as in (a), and quantification (n = 3 independent experiments). ln Puromycylation assay in sgPRKCI and sgC LNCaP cells, treated with 10 μM ENZA for 72 h, and 0,2, and 4 μM MS1943 (l), or transduced with the indicates siRNAs (m), or treated with 10 μM GSK126 (n), and quantification (n = 3 independent experiments). Data shown as mean ± SEM of 3 biological replicates (d, h, i, j, k, l, m, n). Two-tailed unpaired Student’s t-test (d, h, i, j, k, l, m, n). Source data are provided as a Source Data file.
Fig. 8
Fig. 8. Pharmacological inhibition of translation restores ENZA sensitivity in PKCλ/ι-deficient cells.
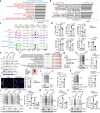
a Mechanisms of action of eFT508, INK128 and HHT inhibitors in translation. b Growth curves of sgC and sgPRKCI LNCaP cells treated with 10 μM ENZA and 10 μM eFT508 alone or combined. Representative experiment from two biological replicates. c Growth curves of PtenΔ/ΔRb1Δ/Δ and PtenΔ/ΔRb1Δ/ΔPrkciΔ/Δ mouse organoids treated as in (b). Representative experiment from two biological replicates. d Growth curves of PRKCI-overexpressing (PRKCI-OE) WCM1078 human prostate organoids treated with 10 μM ENZA and 7.5 μM eFT508 alone or combined. Representative experiment from two biological replicates. e Subcutaneous inoculation of mouse prostate Ptenf/fTrp53f/fRb1 f/fPbCre+ organoids in mice treated with ENZA (50 mg/Kg) alone or in combination with eFT508 (2.5 mg/Kg) for 14 days, and tumor volume quantification (sgC-veh: n = 9, sgC-ENZA: n = 9, sgC-ENZA+efT508: n = 8, sgPrkci-veh: n = 8, sgPrkci-ENZA: n = 7, sgPrkci-ENZA+eFT508: n = 7 mice examined). Data shown as mean ± SD of technical triplicates (b, c, d), mean ± SEM (e). Two-way ANOVA (b, c, d, e). Source data are provided as Source Data file.
Fig. 9
Fig. 9. PKCλ/ι loss increases selective translation to promote a TGFβ resistant program.
a Schematic of monosome and polysome isolation by sucrose gradient fractionation. b Polysome profiles of sgPRKCI and sgC LNCaP cells treated with 10 μM of ENZA for 72 h (n = 3 biological replicates). c Top 5 Hallmark pathways enriched in translationally efficient mRNAs upregulated in LNCaP sgPRKCI, by HOMER software (n = 3 biological replicates). d Ingenuity Pathway Analysis for translationally efficient mRNAs of LNCaP sgPRKCI vs sgC determined by Xtail (n = 3 biological replicates). e Volcano plot of translationally efficient mRNAs of LNCaP sgPRKCI vs sgC determined by Xtail (n = 3 biological replicates) (Blue= neuronal genes, red= EMT-related genes). f Immunoblots in sgPRKCI and sgC LNCaP cells transduced with the indicated siRNAs, treated as in (a) and quantification (n = 3 independent experiments). g Upstream regulator analysis of translationally efficient genes enriched mRNAs in sgPRKCI, treated with ENZA for 72 h (n = 3 biological replicates). h Dose-response curves to determine the IC50 of ENZA either treated with vehicle or 20 μM galunisertib (Gal) in sgC and sgPRKCI LNCaP cells for 6 days. IC50 value is the average of two biological replicates. i Growth curves of sgC and sgPRKCI LNCaP cells treated with 10 μM of ENZA and 20 μM of galunisertib alone or combined. Representative experiment of two biological replicates. j Growth curves of PRKCI-overexpressing (PRKCI-OE) WCM1078 organoids treated as in (i). Representative experiment of three biological replicates. k PKCλ/ι’s dual role in EZH2 regulation. First, by controlling its stability, mediating its interaction with RBBP6. Second, by facilitating the transition of EZH2 from a Polycomb repressor to a transcriptional coactivator of YY1. This transition mediates resistance to enzalutamide induced by the loss of PKCλ/ι. Data shown as mean ± SEM of 3 biological replicates (f), mean ± SD of technical triplicates (i), mean ± SD of 3 biological replicates (j). Two-way ANOVA (i, j). Two-tailed unpaired Student’s t-test (f). Source data are provided as a Source Data file.

References

    1. Mateo, J. et al. Accelerating precision medicine in metastatic prostate cancer. Nat. Cancer1, 1041–1053 (2020). - PMC - PubMed
    1. Watson, P. A., Arora, V. K. & Sawyers, C. L. Emerging mechanisms of resistance to androgen receptor inhibitors in prostate cancer. Nat. Rev. Cancer15, 701–711 (2015). - PMC - PubMed
    1. Robinson, D. et al. Integrative clinical genomics of advanced prostate cancer. Cell161, 1215–1228 (2015). - PMC - PubMed
    1. Beltran, H. et al. Divergent clonal evolution of castration-resistant neuroendocrine prostate cancer. Nat. Med.22, 298–305 (2016). - PMC - PubMed
    1. Davies, A. H., Beltran, H. & Zoubeidi, A. Cellular plasticity and the neuroendocrine phenotype in prostate cancer. Nat. Rev. Urol.15, 271–286 (2018). - PubMed

Publication types

MeSH terms