. 2024 Nov 20;10(1):132.
doi: 10.1038/s41522-024-00602-9.

Minibioreactor arrays to model microbiome response to alcohol and tryptophan in the context of alcohol-associated liver disease

Affiliations

Minibioreactor arrays to model microbiome response to alcohol and tryptophan in the context of alcohol-associated liver disease

Wanchao Hu et al. NPJ Biofilms Microbiomes. .

Abstract

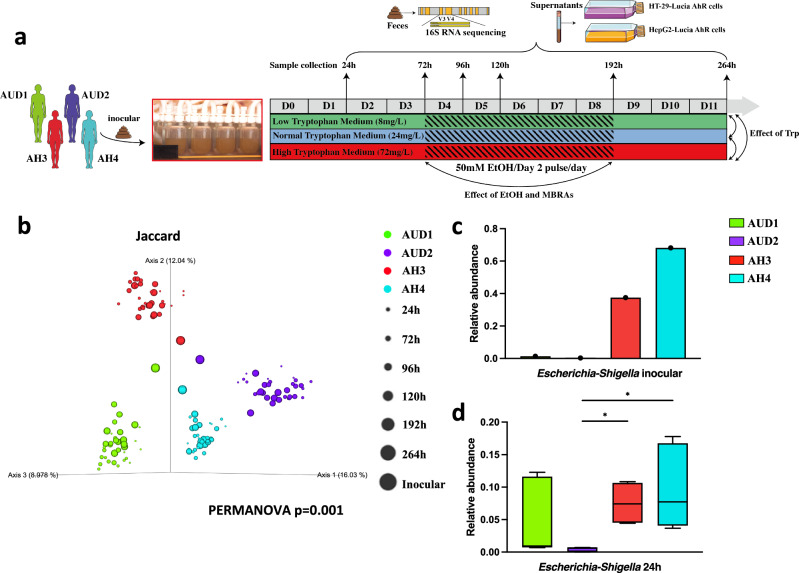
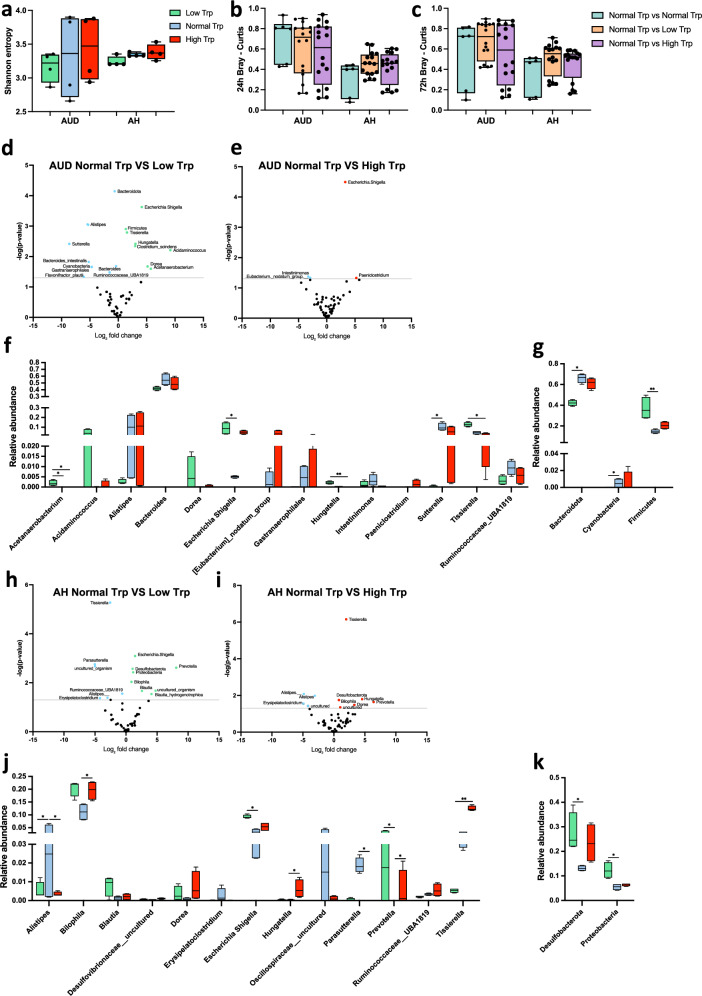
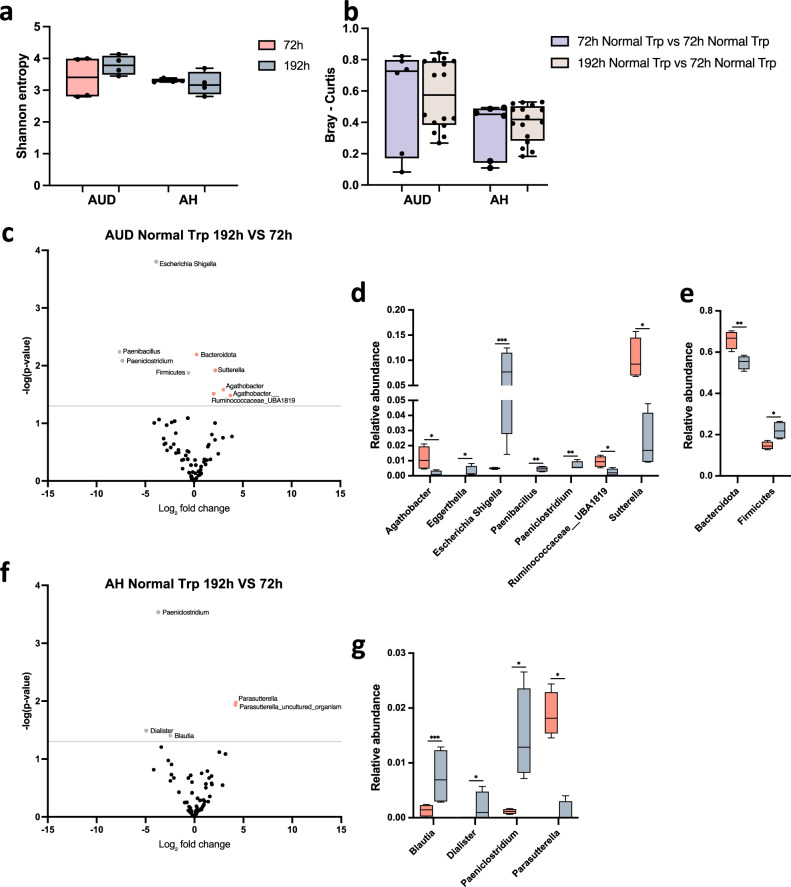
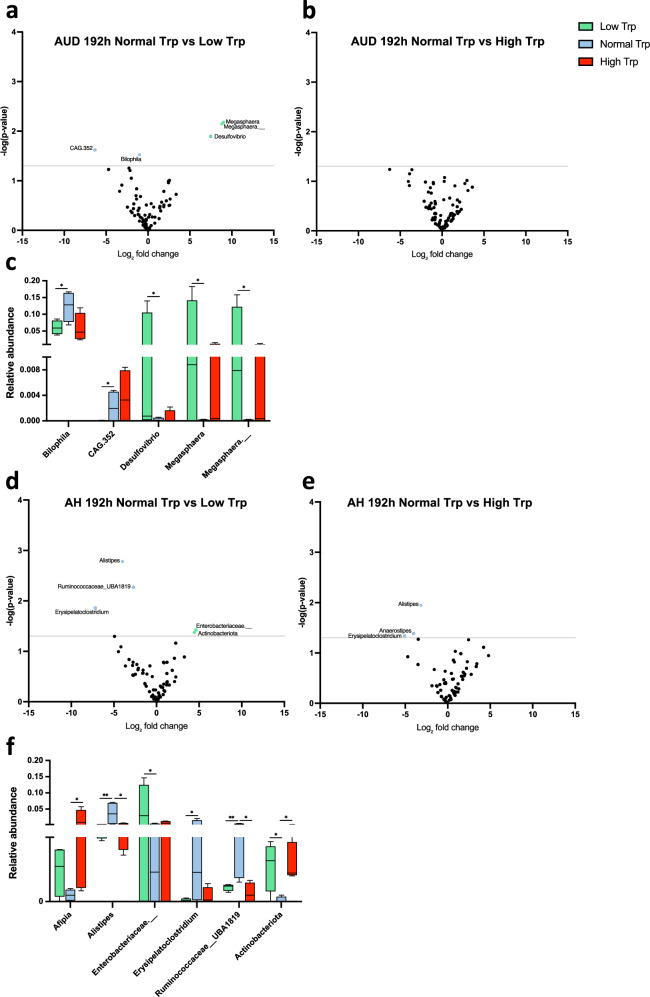
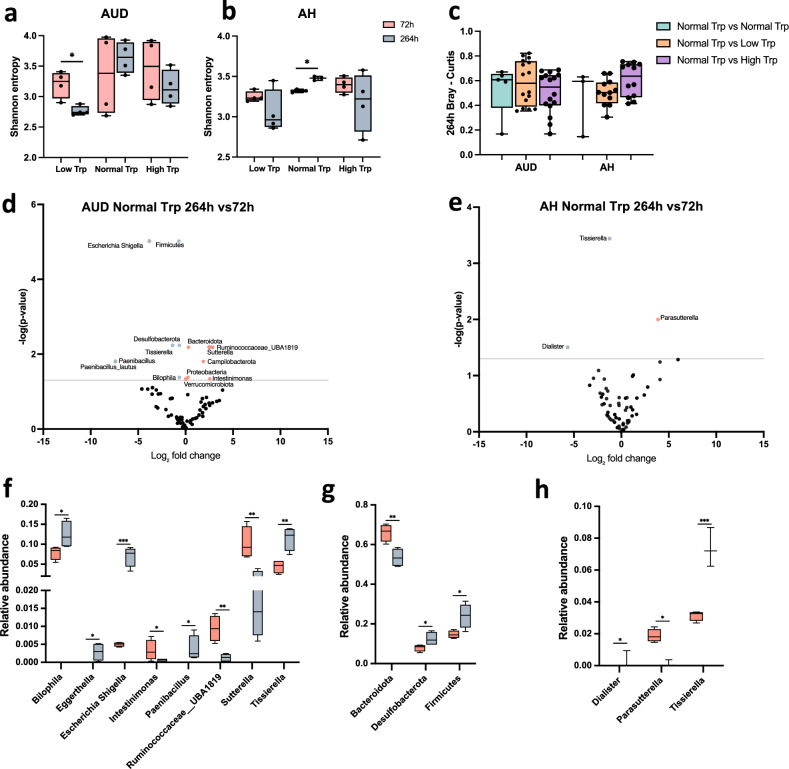
The intestinal microbiota (IM) plays a role in the severity of alcohol-associated liver disease. Modifying severe alcohol-associated hepatitis (AH) dysbiosis improves liver injury through tryptophan (Trp) metabolites and the aryl hydrocarbon receptor (AhR). However, Trp's effect on the IM in alcohol use disorder (AUD) patients remains unclear. Here, we used an in vitro microbiota modeling system named Minibioreactor arrays (MBRAs). Feces from AUD patients with or without AH were treated with low, normal, or high Trp concentrations, with subsequent treatment with alcohol. Microbiota composition and AhR activity were studied. We showed that microbial communities from donors were maintained in MBRAs. High and low Trp increased the abundance of pathogen Escherichia Shigella. In the absence of alcohol, Trp changed more bacteria in AUD IM compared to AH IM. Normal Trp increased the AhR activity. Overall, maintaining normal Trp levels may prevent dysbiosis in AUD or AH, pending in vivo confirmation.


Conflict of interest statement

Competing interests: D.C. received travel funds from Biocodex and Gilead, lecture fees from Gilead, and royalties from John Libbey Eurotext. G.P. received travel funds from Janssen and Gilead, consulting fees from Bayer, Biocodex, Roche, Gilead, Pierre Fabre, and Servier, and royalties from Elsevier-Masson, Solar, Flammarion/Versilio, and John Libbey Eurotext. A.M.C. received royalties from Elsevier-Masson, Solar, Flammarion/Versilio, and John Libbey Eurotext. All other authors declare no conflicts of interest.

Figures

Fig. 1
Fig. 1. MBRA is stable to keep each individual fecal community.
AUD, alcohol use disorder; AH, alcohol-related hepatitis. a Experimental design: fecal samples from two AUD patients and two AH patients were transferred to MBRA chambers in three different tryptophan mediums (8 mg/L, 24 mg/L and 72 mg/L) through 13 days. Ethanol was introduced into the medium on Day 4, 50 mM per day, and eliminated on Day 9. Fecal samples and supernatants were collected at 24 h, 72 h, 96 h, 120 h, 192 h and 264 h. Fecal samples were subjected to 16S rRNA sequencing and the supernatant was used to process HT-29-Lucia AhR cells and HepG2-Lucia AhR cells. Microbiota analysis: b PCoA plot, showing the Jaccard distance (PERMANOVA analysis, p = 0.001, 6 samples per patient, per time point). c, d The level of Escherichia Shigella in 4 individual inocula and corresponding samples in 24 h (n = 6 for each group, Statistical analyses were performed using Kruskal–Wallis tests and significant differences were recorded as *p < 0.05, **p < 0.01, and ***p < 0.001.).
Fig. 2
Fig. 2. Low concentrations of tryptophan (Trp) can affect the intestinal microbiota (IM) of AUD and AH, but high concentrations of Trp can only affect the AH IM and have less impact on the AUD IM.
Trp, tryptophan; IM, intestinal microbiota; a Shannon alpha-diversity index at 72 h among low, normal and high Trp groups. b, c Bray–Curtis distance separating samples from different groups at (b) 24 h and (c) 72 h. d, e, h, i Volcano plots show differential bacteria between Normal Trp and Low Trp in AUD IM (d) and AH IM (h), and between Normal Trp and High Trp in AUD IM (e) and AH IM (i) in 72 h (MaAsLin2 analysis p < 0.05 and fold change > 1.5). f, g Differential bacteria shown in different levels including genus (f, j) and phylum (g, k). (n = 4/group for the Shannon index, and n = 6–16/group for Bray–Curtis distance. Significant results for *p < 0.05, **p < 0.01, and ***p < 0.001 were determined by MaAsLin2 analysis unless stated otherwise.).
Fig. 3
Fig. 3. Alcohol can alter AUD IM but has little effect on AH IM under Normal Trp conditions.
a, b Shannon alpha-diversity index (n = 4) (a) and Bray–Curtis distances (n = 6–16) (b) between 72 h samples and 192 h samples in Normal Trp group. ce Volcano plots show differential bacteria between 192 h samples and 72 h samples in AUD Normal Trp group (d), and differential bacteria are displayed in bar charts (d, e). f, g Volcano plots show differential bacteria between 192 h samples (n = 4) and 72 h samples (n = 4) in AH Normal Trp group (f), and differential bacteria are displayed in bar charts (g).
Fig. 4
Fig. 4. Trp has limited effects on AUD and AH IM in the presence of alcohol.
ac Volcano plots show differential bacteria between Normal Trp (n = 4) and Low Trp (n = 4) (a), and between Normal Trp and High Trp (n = 4) (b) in 72 h AUD samples, and display these differential bacteria in bar charts (c). df Volcano plots show differential bacteria between Normal Trp and Low Trp (d), and between Normal Trp and High Trp (e) in 72 h AH samples, and display these differential bacteria in bar charts (f).
Fig. 5
Fig. 5. Low concentration of Trp decreased alpha diversity in AUD IM. And AUD IM did not return to its pre-alcohol state after removing alcohol.
a, b Shannon alpha-diversity index between 72 h samples (n = 4) and 264 h samples (n = 4) in AUD samples (A) and AH samples (b). c Bray–Curtis distance separating samples from different treatments in AUD and AH samples at 264 h (n = 6–16). dh Differential bacteria between 264 h samples and 72 h samples in AUD (d) and AH (e) Normal Trp groups. And related differential bacteria in AUD samples display in bar charts (fh).
Fig. 6
Fig. 6. Metabolites in AH fecal supernatant decreased AhR activity in HT-29 cells and hepatocytes but can be reversed by normal concentrations of Trp.
Collected fecal supernatants from different time points in MBRA for treatments of HT-29 Lucia-AhR cells (ad) and HepG2 Lucia-AhR cells to test the activity of AhR (e–h). (n = 4–14, Significant results for *p < 0.05, **p < 0.01, ***p < 0.001, and ****p < 0.0001 were determined by Kruskal–Wallis test).

References

    1. Gao, B. & Bataller, R. Alcoholic liver disease: pathogenesis and new therapeutic targets. Gastroenterology141, 1572–1585 (2011). - PMC - PubMed
    1. Mackowiak, B., Fu, Y., Maccioni, L. & Gao, B. Alcohol-associated liver disease. J. Clin. Invest.134, 10.1172/jci176345 (2024). - PMC - PubMed
    1. Mirijello, A. et al. Identification and management of alcohol withdrawal syndrome. Drugs75, 353–365 (2015). - PMC - PubMed
    1. Rao, R. Endotoxemia and gut barrier dysfunction in alcoholic liver disease. Hepatology50, 638–644 (2009). - PMC - PubMed
    1. Bishehsari, F. et al. Alcohol and gut-derived inflammation. Alcohol. Res.38, 163–171 (2017). - PMC - PubMed

MeSH terms

LinkOut - more resources