. 2024 Nov 20;15(1):10046.
doi: 10.1038/s41467-024-54338-3.

Disorganized chromatin hierarchy and stem cell aging in a male patient of atypical laminopathy-based progeria mandibuloacral dysplasia type A

Affiliations

Disorganized chromatin hierarchy and stem cell aging in a male patient of atypical laminopathy-based progeria mandibuloacral dysplasia type A

Wei Jin et al. Nat Commun. .

Abstract

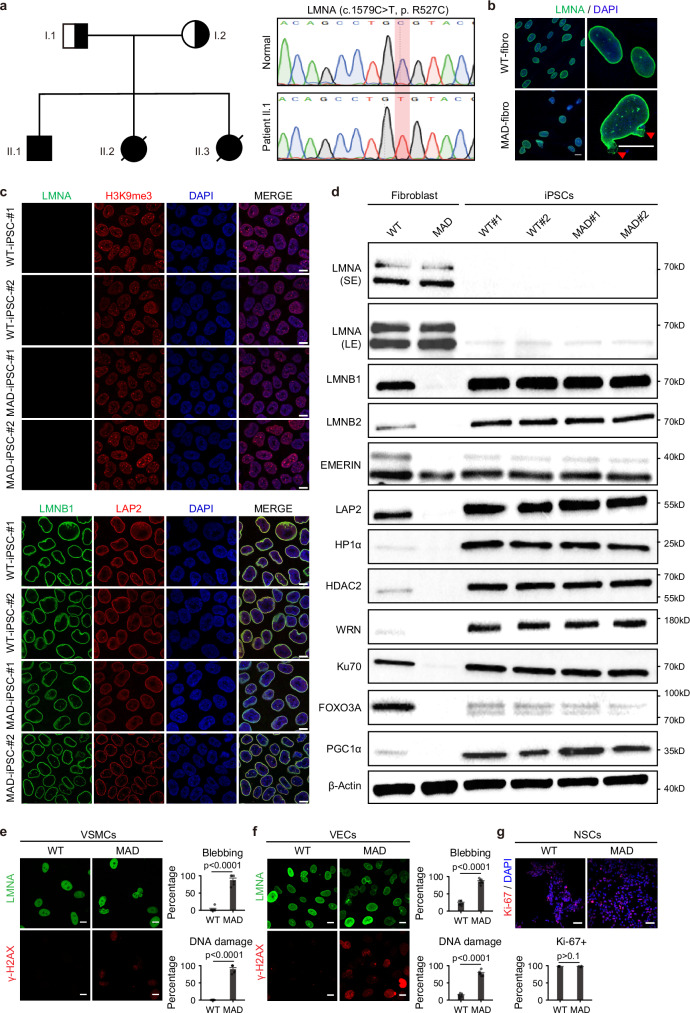
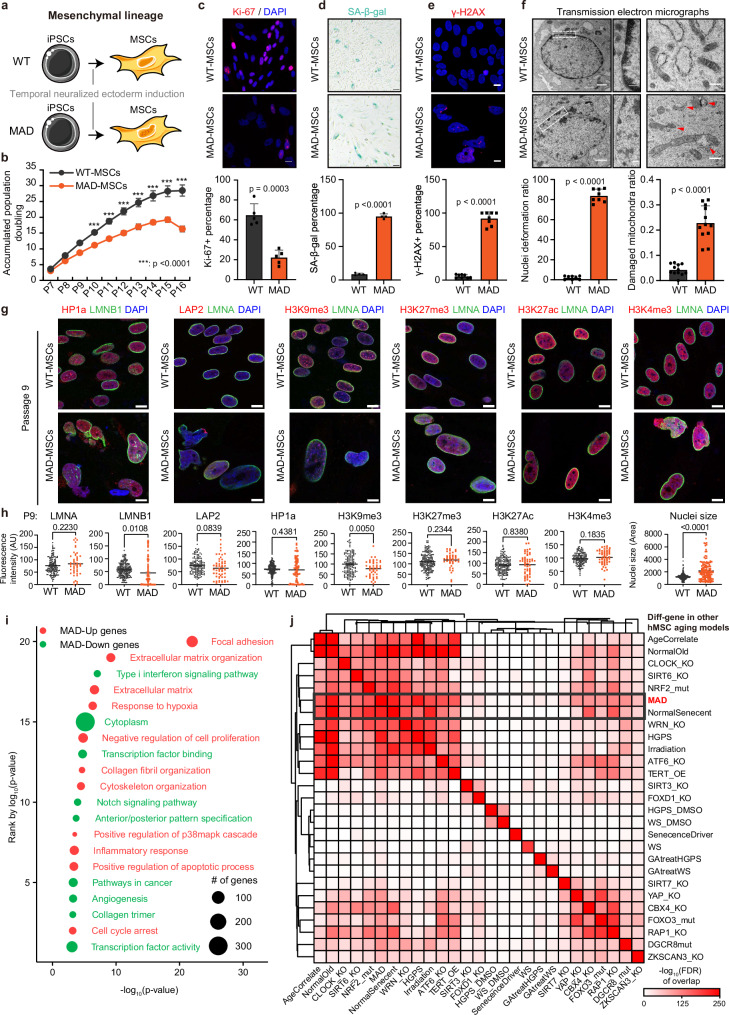
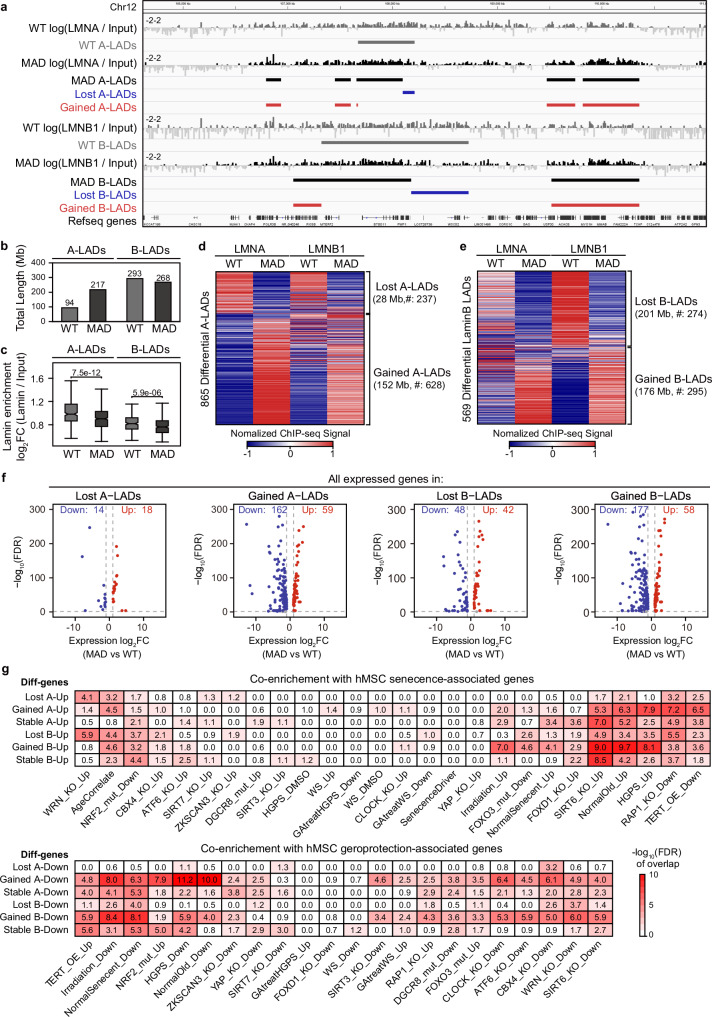
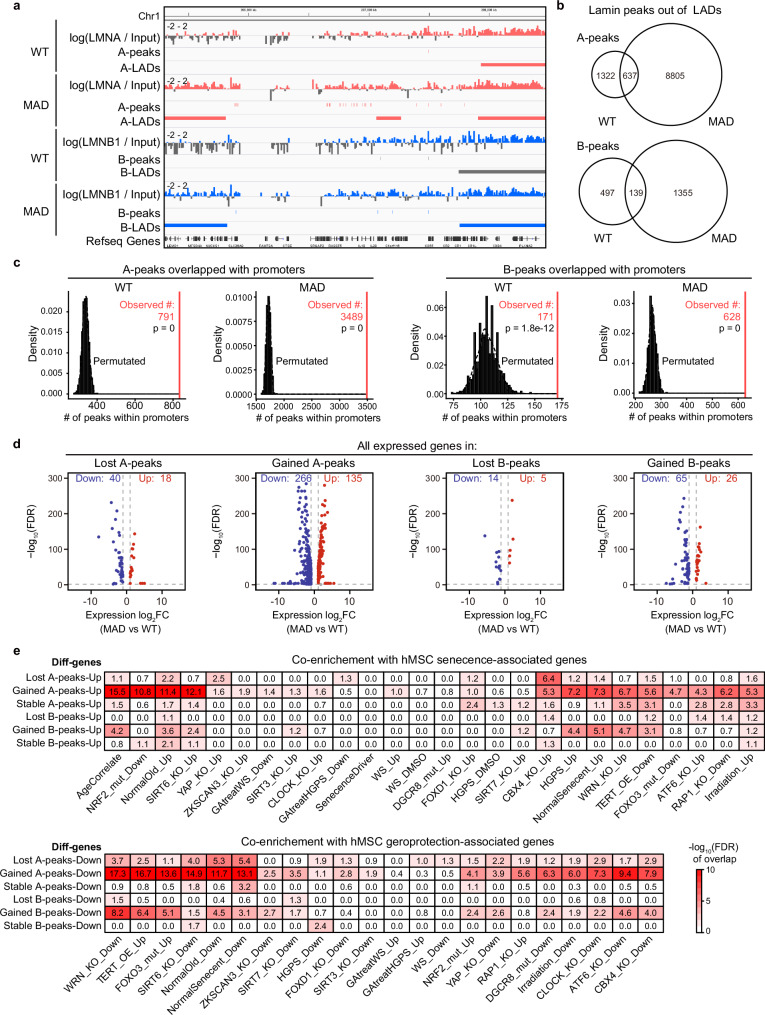
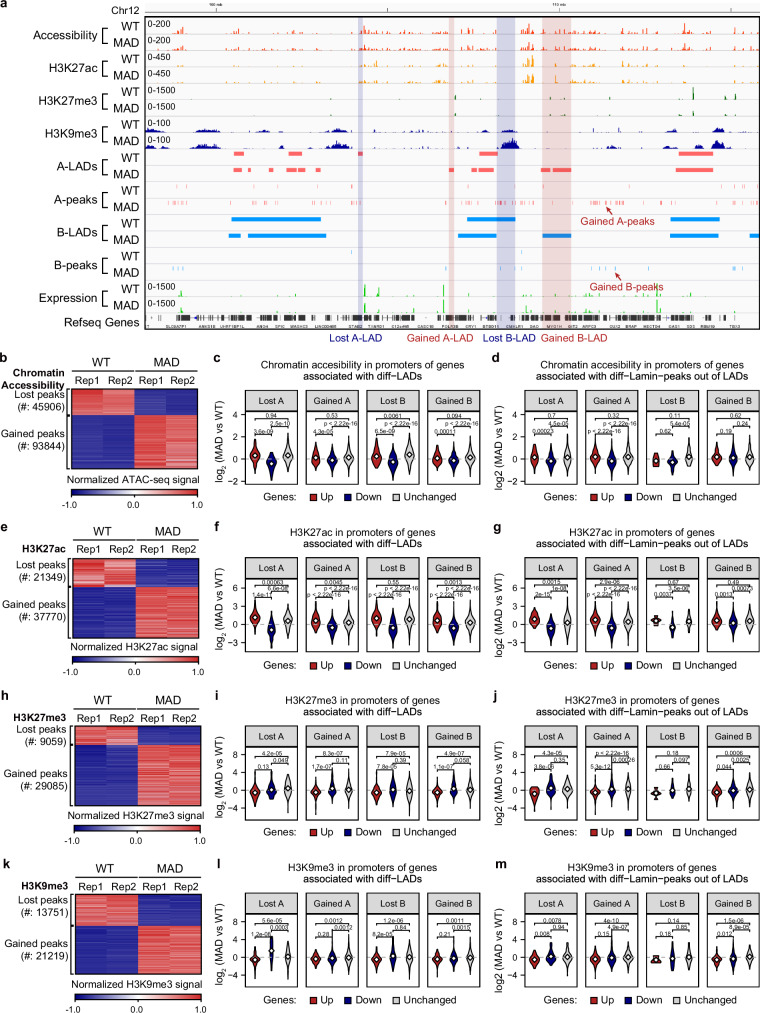
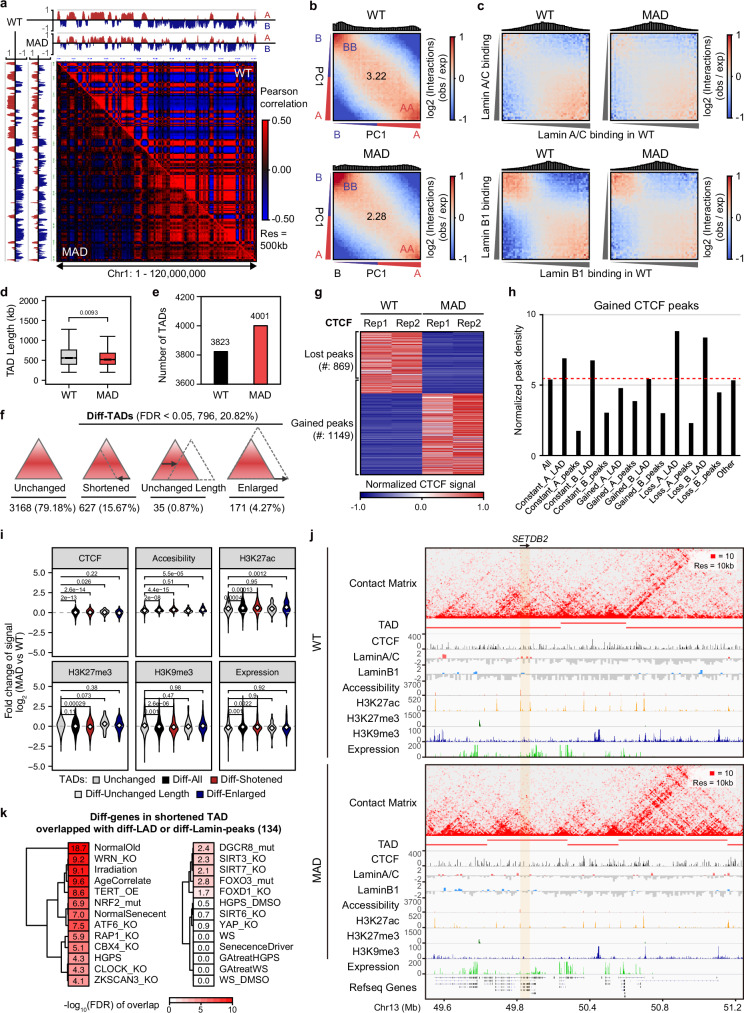
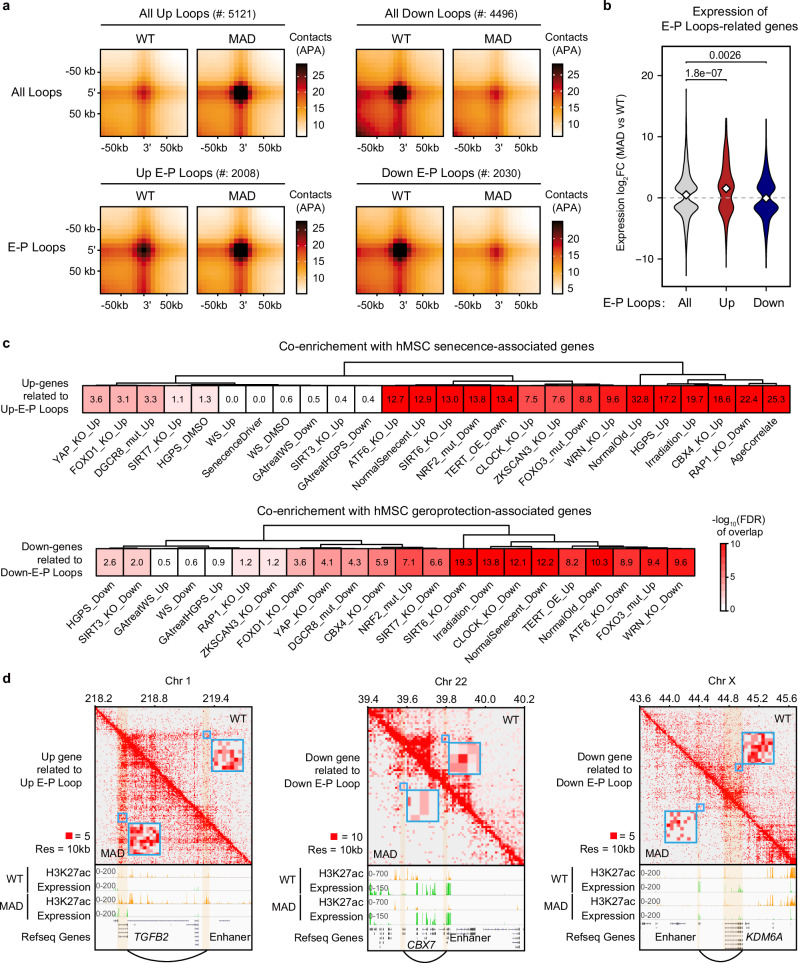
Studies of laminopathy-based progeria offer insights into aging-associated diseases and highlight the role of LMNA in chromatin organization. Mandibuloacral dysplasia type A (MAD) is a largely unexplored form of atypical progeria that lacks lamin A post-translational processing defects. Using iPSCs derived from a male MAD patient carrying homozygous LMNA p.R527C, premature aging phenotypes are recapitulated in multiple mesenchymal lineages, including mesenchymal stem cells (MSCs). Comparison with 26 human aging MSC expression datasets reveals that MAD-MSCs exhibit the highest similarity to senescent primary human MSCs. Lamina-chromatin interaction analysis reveals reorganization of lamina-associating domains (LADs) and repositioning of non-LAD binding peaks may contribute to the observed accelerated senescence. Additionally, 3D genome organization further supports hierarchical chromatin disorganization in MAD stem cells, alongside dysregulation of genes involved in epigenetic modification, stem cell fate maintenance, senescence, and geroprotection. Together, these findings suggest LMNA missense mutation is linked to chromatin alterations in an atypical progeroid syndrome.


Conflict of interest statement

Competing interests: The authors declare no competing interests.

Figures

Fig. 1
Fig. 1. Mesenchymal lineages derived from MAD iPSCs manifested progeroid defects.
a The pedigree of a MAD family and Sanger sequencing confirming the homozygous point mutation in LMNA (c.1579 C > T, p. R527C). b Immunostaining of lamin A/C (LMNA, green) in normal and MAD-patient derived dermal fibroblasts. DAPI, blue. Scale bar 10μm. The experiment was repeated three times with similar results. c Immunostaining of lamin A/C (LMNA, green), H3K9me3 (red), lamin B1 (LMNB1, green) and LAP2 (red) in WT-iPSCs and MAD iPSCs clones. DAPI, blue. Scale bar 10μm. The experiment was repeated three times with similar results. d Immunoblotting of lamin A/C (LMNA), lamin B1 (LMNB1), lamin B2 (LMNB2), EMERIN, LAP2, and WRN, KU70; HADC2, HP1a and FOXO3, PGC1a in dermal fibroblasts and two independent WT- and MAD- iPSCs clones. β-Actin was used as the loading control and only shown once as limited space. The experiment was repeated three times with similar results. e Representative images of lamin A/C (LMNA, green) and γ-H2A.X (red) co-immunostaining in passage 8 (P8) of WT and MAD-VSMCs with a corresponding statistical analysis. DAPI, blue. Scale bar 10 μm. Data are mean ± SD, the p value was calculated using two-tailed unpaired t-test, n = 6. Three independent differentiation experiments were performed with similar results. f Representative images of lamin A/C (LMNA, green) and γ-H2A.X (red) co-immunostaining in passage 12 (P12) of WT and MAD-VECs with a corresponding statistical analysis. DAPI, blue. Scale bar 10 μm. Data are mean ± SD, the p value was calculated using two-tailed unpaired t-test, n = 7. Three independentdifferentiation experiments were performed with similar results. g Representative images of Ki 67 (red) staining in WT-NSCs and MAD-NSCs at passage 20. Data are mean ± SD, the p value was calculated using two-tailed unpaired t-test, n = 4. Three independent differentiation experiments were performed with similar results. DAPI, blue. Scale bar 10 μm. Source data are provided as a Source Data file.
Fig. 2
Fig. 2. MAD-iPSCs derived mesenchymal stem cells (MAD-MSCs) recapitulated accelerated cellular senescence.
a, Human MSCs derived from WT and MAD-iPSCs by a temporal neuralized ectoderm induction method. b Growth curve of MSCs. Bars represent the mean ± SD.; n  =  3 independent biological replicates; ***p <  0.001; n.s., non-significant; p value was calculated using two-way ANOVA test. c Proliferative capability measured by Ki 67 (red) using P13 MSCs. DAPI, blue. Scale bar 10 μm. Data represent the mean ± SD, n  =  5. d SA-β-gal staining of MSCs at passage 13; Scale bar 100 μm. Data are mean ± SD, n =  3. e Representative image of γ-H2A.X (red) immunostaining at passage 13. DAPI, blue. Scale bar 10 μm. Data are mean ± SD, n =  8. The p values were calculated using two-tailed unpaired t-test. Experiments in c-e were repeated three times with similar results. f Representative transmission electron micrographs (TEM) of P13 WT- and MAD-MSCs. Scale bar 250 nm. The percentage of damaged mitochondria was  quantified and calculated in MSCs. Data are mean ± SD, n = 462 WT, n = 368 MAD. The p value was calculated using two-tailed unpaired t-test. Three independent replicates were performed with similar results. g Representative images of co-staining of lamin B1 (LMNB1, green) and HP1a (red), lamin A/C (LMNA, green) and LAP2 (red), lamin A/C (LMNA, green) and H3K9me3 (red), lamin A/C (LMNA, green) and H3K27me3 (red), lamin A/C (LMNA, green) and H3K27ac (red), and lamin A/C (LMNA, green) and H3K4me3 (red) in passage 9 MSCs. DAPI, blue. Scale bars 10 µm. h Fluorescence intensity of g were quantified, including Lamin B1 and HP1a (WT n = 189, MAD n = 79), lamin A/C and LAP2 (WT n = 84, MAD n = 51), H3K9me3 (WT n = 88, MAD n = 64), H3K27me3 (WT n = 71, MAD n = 31), H3K27ac (WT n = 163, MAD n = 55), H3K4me3 (WT n = 145, MAD n = 79) and nuclei size (WT n = 293, MAD n = 143). Data are mean ± SD; the lines in scatter dot plot indicate the averaged intensity and the p values were calculated using two-tailed unpaired t-test. Three independent biological experiments were performed with similar results. i GO and KEGG enriched signaling pathways in MAD-MSCs. All p-values were determined by two-sided modified Fisher’s exact test using DAVID. j Comparison of aging-associated gene profilings between MAD-MSCs and other human MSCs aging models. Color depth indicates the level of transcriptional similarity. Source data are provided as a Source Data file.
Fig. 3
Fig. 3. LADs reorganization is linked to aging-associated genes in MAD-MSCs.
a Representative distribution of LADs at specific genome loci in WT and MAD-MSCs, including A-LADs and B-LADs. b The length of genomic coverage of A-LADs and B-LADs in WT and MAD-MSCs. c Boxplot showing Lamin enrichment in WT A-LADs (n = 340), MAD A-LADs (n = 535), WT B-LADs (n = 257), and MAD B-LADs (n = 326), with 2 biological replicates for lamins ChIP-seq. Box plots display the median as the center line, the 25th and 75th percentiles as the bounds of the box, and the whiskers represent the minimum and maximum values within 1.5 times the interquartile range from the lower and upper quartiles. All p-values were determined using the two-sided Wilcoxon rank-sum test. d, e Heatmap of differential A-LADs and B-LADs in WT and MAD-MSCs. f Differentially expressed genes associated with LADs reorganization. Genes with over 2-fold transcriptional changes were counted. g Cross-analysis of the enrichment of dysregulated genes due to LAD reorganization in MAD-MSCs with geroprotection/senescence-associated profile in different hMSCs aging models. Color depth indicates enrichment score.
Fig. 4
Fig. 4. Reposition of non-LAD lamina-chromatin binding peaks modulates aging-associated genes in MAD- MSCs.
a Distribution of non-LADs lamina-chromatin binding peaks at specific genome loci in WT and MAD-MSCs. Each vertical bar represents one peak out of LADs. b Global non-LAD lamina-chromatin binding peaks identified in WT and MAD-MSCs. The number of the peaks are indicated. c Genome-wide co-occurrence of non-LAD lamina-chromatin binding peaks with promoters using a one-sided permutation test. The vertical axis density represents the frequency of co-occurrence of non-LAD binding peaks with promoters while horizonal axis represents predicted co-occurrence number. The observed co-occurrence number are indicated. d Differentially expressed genes associated with repositioned non-LADs lamina-chromatin binding peaks in MAD-MSCs Genes with over 2-fold transcriptional changes were counted. e Cross-analysis of enrichment of dysregulated genes due to reposition of non-LAD lamina-chromatin binding peaks in MAD-MSCs with geroprotection/senescence-associated profile in different hMSCs aging models. Color depth indicates the enrichment score.
Fig. 5
Fig. 5. Lamina-chromatin interaction coordinates with chromatin features to regulate gene expression.
a Representative distribution of different chromatin features in lamina-chromatin binding sites. b Overall view of ATAC peaks redistribution in MAD-MSCs. c Averaged chromatin accessibility in promoter regions with different A and B-LADs reorganization. d Averaged chromatin accessibility in the promoter region with different non-LAD lamina-chromatin binding peaks. e Overall view of H3K27ac peaks redistribution in MAD-MSCs. f Averaged H3K27ac peaks in promoter regions with different A and B-LADs reorganization. All p-values were determined using the two-sided Wilcoxon rank-sum test. g Averaged H3K27ac peaks in promoter regions with different non-LAD lamina-chromatin binding peaks. All p-values were determined using the two-sided Wilcoxon rank-sum test. h Overall view of H3K27me3 redistribution in MAD-MSCs. i Averaged H3K27me3 peaks in the promoter regions with different A and B-LADs reorganization. All p-values were determined using the two-sided Wilcoxon rank-sum test. j Averaged H3K27me3 peaks in promoter regions with different non-LAD lamina-chromatin binding peaks. All p-values were determined using the two-sided Wilcoxon rank-sum test. k Overall view of H3K9me3 redistribution in MAD-MSCs. l Averaged H3K9me3 peaks in promoter regions with different A and B-LADs reorganization. All p-values were determined using the two-sided Wilcoxon rank-sum test. m Averaged H3K9me3 peaks in promoter regions with different non-LAD lamina-chromatin binding peaks. All p-values were determined using the two-sided Wilcoxon rank-sum test.
Fig. 6
Fig. 6. MAD mutation associates with loss of chromatin compartmentalization and increase in TADs.
a Normalized heatmap of specific region (q arm of chromosome 1) in WT and MAD-MSCs. The color maps of relative interaction probability in WT-MSCs and MAD-MSCs were displayed on the same scale. The A and B compartments were defined by PC1 signal (positive PC1 regions in red color represent A compartments, negative PC1 regions in blue color represent B compartments). b Statistical analysis of compartment interaction between compartment A and compartment B in WT-MSCs and MAD-MSCs according to Saddle plot analysis. c Analysis of the lamina-compartment interactions. d Boxplot showing length of WT TADs (n = 3823) and MAD TADs (n = 4001), with 2 biological replicates for Hi-C. Box plots display the median as the center line, the 25th and 75th percentiles as the bounds of the box, and the whiskers represent the minimum and maximum values within 1.5 times the interquartile range from the lower and upper quartiles. All p-values were determined using the two-sided Wilcoxon rank-sum test. e Overall view of TAD number in WT-MSCs and MAD-MSCs. f Category of differential TADs number presented in MAD-MSCs, including stable, shortened, shifted without change in length, and enlarged. g Overall view of CTCF redistribution in MAD-MSCs. h The distribution of CTCF across lamin-chromatin interaction sites. i Overall view of altered chromatin features, including CTCF binding, ATAC, H3K27ac, H3K27me3, H3K9me3, and gene expression in TADs. All p-values were determined using the two-sided Wilcoxon rank-sum test. j Integrative analysis of TAD disorganization and chromatin features in genomic region covering a dysregulated aging-associated gene, SETDB2, in MAD-MSCs. k Cross-analysis of the enrichment of dysregulated genes resulted from shortened TADs in MAD-MSCs with geroprotection/senescence-associated profile in hMSCs aging models. Color depth indicates enrichment score.
Fig. 7
Fig. 7. Altered chromatin E-P loops in MAD-MSCs are implicated in stem cell aging.
a Statistical analysis of global changes in chromatin loop and enhancer-promoter loop. b The transcription changes of altered E-P loops in MAD-MSCs. All p-values were determined using the two-sided Wilcoxon rank-sum test. c Cross-analysis of the enrichment of dysregulated genes resulted from E-P loop alteration in MAD-MSCs with geroprotection/senescence-associated profile plotted by hMSCs aging models. Color depth indicates enrichment score. d Representative transcriptional dysregulation corresponds with strengthened and weakened E-P loops, respectively.

References

    1. Rankin, J. & Ellard, S. The laminopathies: a clinical review. Clin. Genet70, 261–274 (2006). - PubMed
    1. Doubaj, Y. et al. An inherited LMNA gene mutation in atypical Progeria syndrome. Am. J. Med Genet A158A, 2881–2887 (2012). - PubMed
    1. Csoka, A. B. et al. Novel lamin A/C gene (LMNA) mutations in atypical progeroid syndromes. J. Med Genet. 41, 304–308 (2004). - PMC - PubMed
    1. Garg, A. et al. Atypical progeroid syndrome due to heterozygous missense LMNA mutations. J. Clin. Endocrinol. Metab.94, 4971–4983 (2009). - PMC - PubMed
    1. Chen, L. et al. LMNA mutations in atypical Werner’s syndrome. Lancet362, 440–445 (2003). - PubMed

Publication types

Supplementary concepts

LinkOut - more resources