. 2024 Nov 20;15(1):10007.
doi: 10.1038/s41467-024-53802-4.

A developmental biliary lineage program cooperates with Wnt activation to promote cell proliferation in hepatoblastoma

Affiliations

A developmental biliary lineage program cooperates with Wnt activation to promote cell proliferation in hepatoblastoma

Peng V Wu et al. Nat Commun. .

Abstract

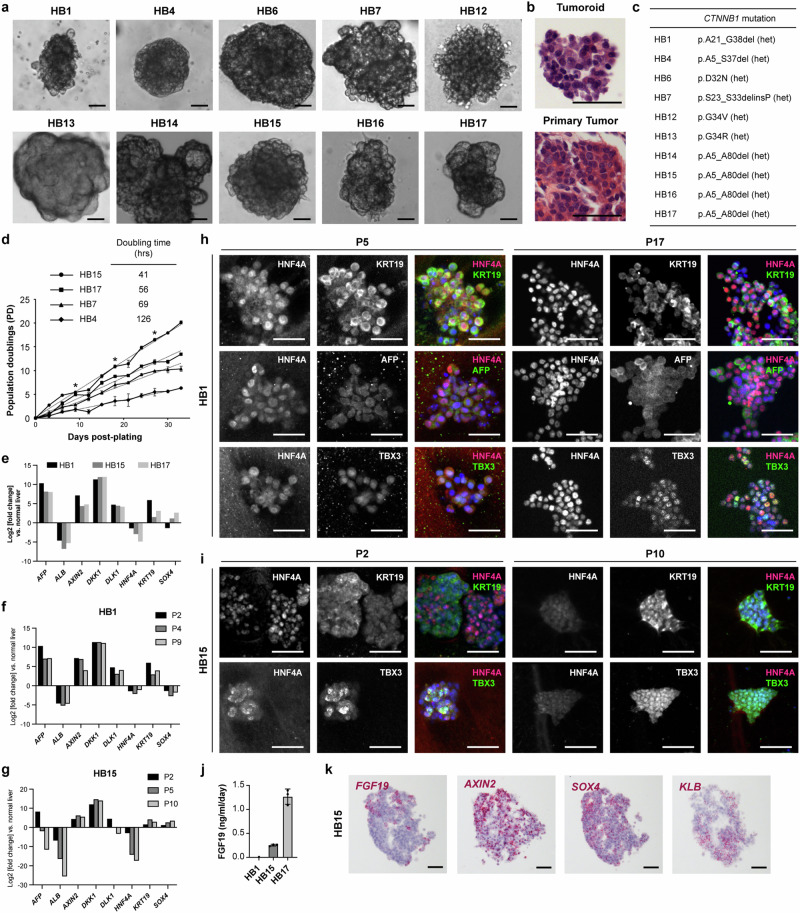
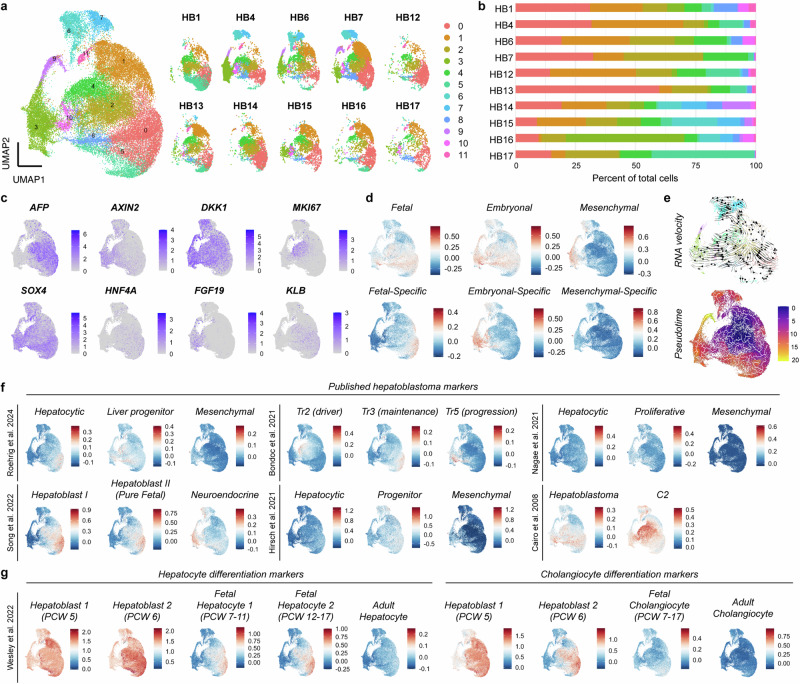
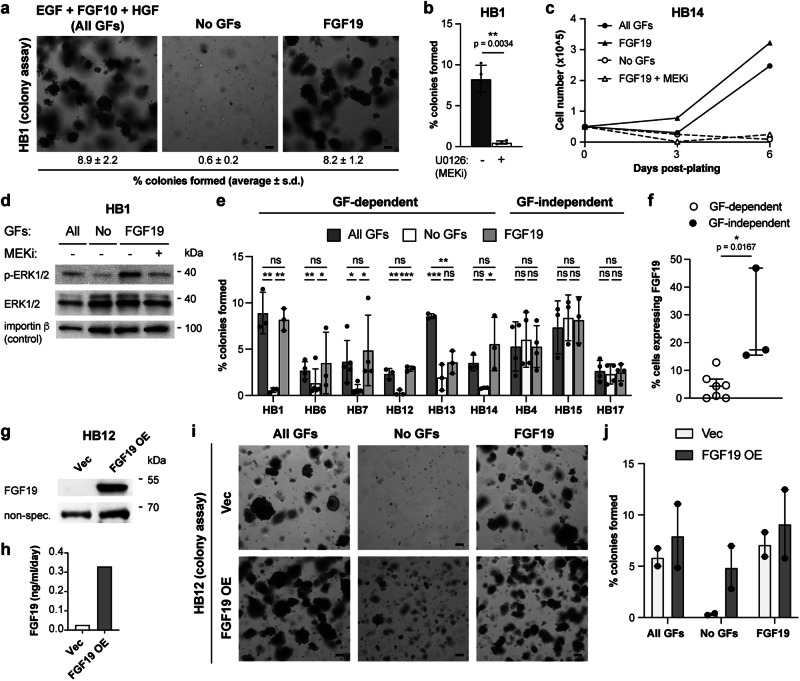
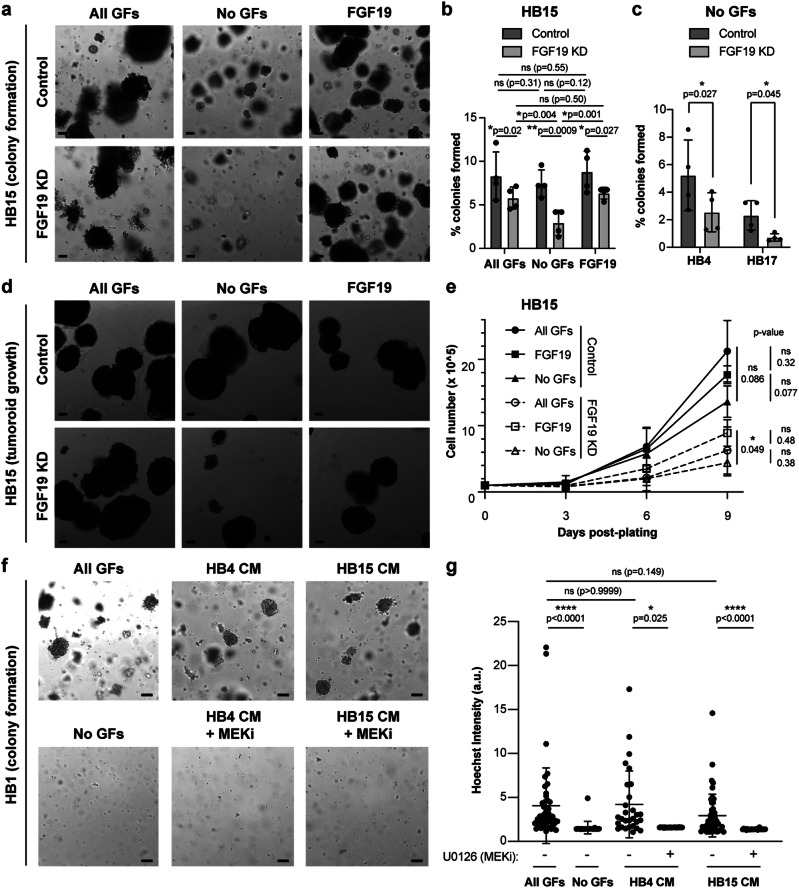
Cancers evolve not only through the acquisition and clonal transmission of somatic mutations but also by epigenetic mechanisms that modify cell phenotype. Here, we use histology-guided and spatial transcriptomics to characterize hepatoblastoma, a childhood liver cancer that exhibits significant histologic and proliferative heterogeneity despite clonal activating mutations in the Wnt/β-catenin pathway. Highly proliferative regions with embryonal histology show high expression of Wnt target genes, the embryonic biliary transcription factor SOX4, and striking focal expression of the growth factor FGF19. In patient-derived tumoroids with constitutive Wnt activation, FGF19 is a required growth signal for FGF19-negative cells. Indeed, some tumoroids contain subsets of cells that endogenously express FGF19, downstream of Wnt/β-catenin and SOX4. Thus, the embryonic biliary lineage program cooperates with stabilized nuclear β-catenin, inducing FGF19 as a paracrine growth signal that promotes tumor cell proliferation, together with active Wnt signaling. In this pediatric cancer presumed to originate from a multipotent hepatobiliary progenitor, lineage-driven heterogeneity results in a functional growth advantage, a non-genetic mechanism whereby developmental lineage programs influence tumor evolution.


Conflict of interest statement

Competing interests: R.N. is a board member of Bio-Techne and a member of the Scientific Advisory Board of Surrozen Inc. The authors declare no other competing interests.

Figures

Fig. 1
Fig. 1. Histology-based RNA sequencing reveals increased expression of Wnt target genes, proliferation, and cholangiocyte markers in embryonal hepatoblastoma.
a Schematic of Smart-3SEQ. b Principal component analysis plot of RNA sequencing from 72 samples with the histologies noted, using top 1500 expressed genes. c Venn diagram of differentially expressed, upregulated and downregulated, genes (log2 fold change > 1 or < −1, padj <0.05 by two-tailed Wald test with Benjamini-Hochberg adjustment for multiple hypothesis testing) in embryonal, fetal, or mesenchymal hepatoblastoma compared to normal liver, determined by DESeq2. d Top hallmark pathways differentially expressed between embryonal and fetal components of hepatoblastoma (FDR < 0.05), using gene set enrichment analysis (GSEA) on pre-ranked gene lists obtained by DESeq2. e Volcano plot of differentially expressed genes between embryonal and fetal components of hepatoblastoma with SOX4 and target genes labeled. Note: range of axes chosen for clarity, with one outlier differentially upregulated gene falling beyond the plotted axes. Adjusted p-values determined by two-tailed Wald test with Benjamini-Hochberg adjustment for multiple hypothesis testing. f Normalized counts of representative markers of Wnt pathway, proliferation, and cholangiocytic differentiation detected by Smart-3SEQ. Adjusted p-values determined by two-tailed Wald test with Benjamini-Hochberg adjustment for multiple hypothesis testing. Blue: embryonal, green: fetal, pink: mesenchymal, purple: normal liver. g Clusters identified by 10x Visium spatial transcriptomics on primary hepatoblastoma HB4, assigned to fetal, embryonal, or mesenchymal histologies based on genes identified by Smart-3SEQ. h Spatial expression of AXIN2, SOX4, and MKI67 in HB4. Adjusted p-values determined in CellRanger by negative binomial test with Benjamini-Hochberg adjustment for multiple hypothesis testing. Source data are provided as a Source Data file. See also Supplementary Table S1, S2, Supplementary Fig. S1.
Fig. 2
Fig. 2. FGF19 is expressed focally within proliferative areas of embryonal hepatoblastoma.
a Normalized counts of FGF19 detected by Smart-3SEQ. b Spatial expression of FGF19 in HB4 by 10x Visium. Adjusted p-values determined in CellRanger by negative binomial test with Benjamini-Hochberg adjustment for multiple hypothesis testing. c Quantification of FGF19+ spots/total spots in each cluster. d RNA in situ hybridization in primary hepatoblastoma HB15 detecting FGF19 (red) at low and high magnification. White dashed lines outline cells expressing FGF19. e Representative RNA in situ hybridization in serial sections of primary hepatoblastoma HB4 detecting FGF19, AXIN2, and SOX4 in red. White dashed lines outline cells expressing FGF19. Similar results obtained for n = 4 different patient specimens. f Double RNA in situ hybridization of AXIN2 (blue) / FGF19 (red), SOX4 (blue) / FGF19 (red) and FGF19 (blue) / KLB (red) in HB15 at low and high magnification. Similar results obtained for n = 4 different patient specimens. g Quantification of cells expressing AXIN2 (n = 5 images, 3074 cells), SOX4 (n = 6 images, 1441 cells), or KLB (n = 3 images, 1935 cells) that also co-express FGF19 as detected in f. Mean and s.d, ordinary one-way ANOVA with Tukey’s correction for multiple comparisons. h Quantification of cells expressing FGF19 that also co-express AXIN2 (n = 5 images, 84 cells), SOX4 (n = 6 images, 161 cells), or KLB (n = 3 images, 101 cells) as detected in f. Mean and s.d., ordinary one-way ANOVA with Tukey’s correction for multiple comparisons. For all panels – scale bar: 50 μm unless otherwise indicated, *: p < 0.05, **: p < 0.01, ***: p < 0.001, ns: not significant. Source data are provided as a Source Data file. See also Supplementary Fig. S2, S3, S4.
Fig. 3
Fig. 3. FGF19-expressing foci are distinguished from surrounding cells with high proliferative activity by different patterns of nuclear β-catenin and expression of hepatobiliary markers.
a High magnification of three patterns of nuclear β-catenin localization (1: Low, 2: Med, 3: High) corresponding to numbered regions outlined with white dotted squares in b. scale bar: 25 μm. b Serial sections of primary hepatoblastoma LCM-6 showing (from left): Co-immunofluorescence of β-catenin (green) and MKI67 (magenta), merged with DAPI (blue); RNA in situ hybridization of FGF19. White dashed lines outline cells expressing FGF19. White arrowheads indicate MKI67+ cells. c Quantification of the percentage of MKI67+ cells with nuclear β-catenin staining patterns as shown in a. Mean and s.d., n = 3 patient specimens, >1000 cells scored for each specimen, ordinary one-way ANOVA, paired, with Tukey’s correction for multiple comparisons. d Co-immunofluorescence for HNF4A (magenta) and KRT19 (green), merged with DAPI (blue) in serial sections of primary hepatoblastoma LCM-6 as in b. White dashed lines outline cells expressing FGF19. e Quantification of percentage of total cells with HNF4A+KRT19- (hepatocytic, pink), HNF4A-KRT19+ (cholangiocytic, green), HNF4A+KRT19+ (hepatoblastic, yellow), and HNF4A-KRT19- (non-hepatobiliary, white) staining patterns in fetal (n = 4 patient specimens) and embryonal (n = 3) components of hepatoblastoma. Mean and s.d., >100 cells scored for each specimen, fetal vs. embryonal compared by ANOVA mixed effects, with Sidak’s correction for multiple comparisons. For all panels – scale bar: 50 μm unless otherwise indicated, **: p < 0.01, ****: p < 0.0001, ns: not significant. Source data are provided as a Source Data file. See also Supplementary Fig. S5.
Fig. 4
Fig. 4. Patient-derived hepatoblastoma tumoroids recapitulate features of primary tumors.
a Representative brightfield images of primary hepatoblastoma tumoroids at early passage (P1-2) from patients indicated. b Representative H&E image of early passage tumoroid compared to the primary tumor from the same patient. Similar results obtained for n = 5 different patient specimens. c CTNNB1 mutations in the hepatoblastoma tumoroids. d Growth curve of several tumoroids starting from early passage (P1-P2). Asterisks denote timepoints of passaging of all tumoroids except for HB7, which was passaged every 6 days instead of every 9 days. Mean and s.d., n = 3 experiments for each time point. e Expression of hepatoblastoma and hepatobiliary marker genes in early passage (P1-P2) tumoroids by qRT-PCR, compared to normal liver. f Expression of hepatoblastoma and hepatobiliary marker genes by qRT-PCR, compared to normal liver, in FGF19-negative tumoroid, HB1, at different passages, P2, P4, and P9, as indicated. g Expression of hepatoblastoma and hepatobiliary marker genes by qRT-PCR, compared to normal liver, in FGF19-positive tumoroid, HB15, at different passages, P2, P5, and P10, as indicated. h Immunofluorescence detection of hepatobiliary markers (HNF4A in magenta, KRT19 in green, AFP in green) and Wnt target gene TBX3 (green) in a representative FGF19-negative tumoroid, HB1, at early (P5) and late (P17) passage. Similar results obtained on n = 4 different FGF19-negative patient tumoroids. i Immunofluorescence detection of hepatobiliary markers (HNF4A in magenta, KRT19 in green, AFP in green) and Wnt target gene TBX3 (green) in a representative FGF19-positive tumoroid, HB15, at early (P2) and late (P10) passage. Similar results obtained on n = 3 different FGF19-positive patient tumoroids. j ELISA detecting FGF19 in the tumoroids shown in e, reported as ng/ml of media/day per 100,000 cells plated. Mean and s.d., n = 3 independent experiments. k RNA in situ hybridization detecting FGF19, KLB, SOX4, and AXIN2 in red in serial sections of a representative HB15 tumoroid. Similar results obtained on n = 3 different FGF19-positive patient tumoroids. For all panels – scale bar: 50 μm. Source data are provided as a Source Data file. See also Supplementary Table S3, Supplementary Fig. S6.
Fig. 5
Fig. 5. Transcriptomic heterogeneity of hepatoblastoma tumoroids correlates with the embryonal and fetal gene signatures identified by Smart-3SEQ.
a UMAP representation of scRNA sequencing results of 10 patients, colored by cluster, along with separate UMAP plots for each patient. b Bar graph showing representation of different UMAP clusters across 10 tumoroids. c UMAP plots showing relative gene expression for hepatoblastoma markers, Wnt target genes, proliferation and differentiation markers, and FGF19 and its receptor/co-receptor, FGFR4/KLB. Color scales indicate normalized expression obtained by the LogNormalize function in Seurat. d UMAP plots showing relative expression of different gene signatures defined as follows and listed in Supplementary Table S2, and Supplementary Data 5: fetal = top 50 differentially upregulated genes between the fetal histology vs. normal liver; embryonal = top 50 differentially upregulated genes between the embryonal histology vs. normal liver; fetal-specific = top 50 differentially upregulated genes between the fetal vs. embryonal histologies; embryonal-specific = top 50 differentially upregulated genes between the embryonal vs. fetal histologies; mesenchymal = top 50 differentially upregulated genes between the mesenchymal histology vs. normal liver; mesenchymal-specific = top 50 differentially upregulated genes between the mesenchymal vs. embryonal histologies. Color scales indicate the average expression of the signature obtained by the AddModuleScore function in Seurat. e RNA velocity (using data from HB1, HB6, HB15) and pseudotime analyses (using all tumoroid data) projected onto the UMAP representation from a. Color scale indicates pseudotime. f UMAP plots showing relative expression of published gene signatures of hepatoblastoma from single-cell RNA sequencing and bulk gene expression analyses (gene lists in Supplementary Data 5). Color scales indicate average expression of the signature obtained by the AddModuleScore function in Seurat. g UMAP plots showing relative expression of published gene signatures of normal human hepatoblast differentiation along the hepatocyte and cholangiocyte trajectories (gene lists in Supplementary Data 5). Color scales indicate average expression of the signature obtained by the AddModuleScore function in Seurat. See also Supplementary Fig. S7, S8.
Fig. 6
Fig. 6. FGF19 is sufficient to promote proliferation of FGF19-negative tumoroid cells in vitro.
a Brightfield images of FGF19-negative hepatoblastoma colonies (HB1) seeded as single cells and grown for 2 weeks in media containing EGF + FGF10 + HGF (All GFs), no GFs, or FGF19. Numbers indicate % colonies formed, mean and s.d. of n = 3 independent experiments. b Quantification of colony assay of HB1 cells grown in media with all GFs or all GFs + MEK inhibitor U0126 (MEKi, 5 μM). Mean and s.d., n = 3 independent experiments, paired two-tailed t-test. c Growth curve of HB14 tumoroids in the presence of All GFs, FGF19, no GFs, or FGF19 + U0126. Filled circles: All GFs, filled triangles: FGF19, open circles: No GFs, open triangles: FGF19 + U0126. d Immunoblot of p-ERK1/2, total ERK1/2, and control (importin β) in HB1 in the presence of All GFs, no GFs, FGF19, or FGF19 + U0126. e Quantification of colony assay of the indicated tumoroids in media containing all GFs, no GFs, or FGF19. Mean and s.d., exact p-values by ANOVA/mixed effects with uncorrected Fisher’s LSD – HB1 (n = 3 independent experiments): 0.54 (All GFs vs. FGF19), 0.0014 (All GFs vs. No GFs), 0.002 (No GFs vs. FGF19); HB6 (n = 5): 0.86, 0.0074, 0.022; HB7 (n = 5): 0.64, 0.012, 0.036; HB12 (n = 5): 0.40, 0.0004, 0.0013; HB13 (n = 3): 0.002, 0.0007, 0.079; HB14 (n = 3): 0.17, 0.088, 0.017; HB4 (n = 3): 0.24, 0.44, 0.088; HB15 (n = 3): 0.22, 0.14, 0.71; HB17 (n = 4): 0.53, 0.24, 0.55. f Percentage of cells expressing FGF19 by scRNAseq. Median and interquartile range, comparing GF-dependent (open circles, n = 6) and GF-independent (filled circles, n = 3) tumoroids by two-sided Mann-Whitney test. g Immunoblot of FGF19 and control (non-specific/GFP) in HB12 expressing lentiviral vector or FGF19. h ELISA detecting FGF19 in HB12 expressing lentiviral vector or FGF19. i Brightfield images of HB12 colonies expressing lentiviral vector or FGF19 in media containing All GFs, no GFs, or FGF19. j Quantification of colony assay for HB12 as in i. Mean and S.E.M., n = 2 independent experiments. For all panels – scale bar: 100 μm, *p < 0.05, **p < 0.01, ***p < 0.001, ns: not significant. See also Supplementary Fig. S9, S10.
Fig. 7
Fig. 7. Endogenous FGF19 expression by a subset of tumor cells bypasses the requirement for exogenous growth factors.
a Brightfield images of HB15 colonies expressing lentiviral shRNA to luciferase (control) or FGF19 seeded as single cells after 3 days of antibiotic selection and grown for 2 weeks in media containing EGF + FGF10 + HGF (All GFs), no GFs, or FGF19. b Quantification of colony assay as in b. Mean and s.d., n = 4 independent experiments, 2-way ANOVA with uncorrected Fisher’s LSD. c Quantification of colony formation assays of HB4 and HB17, expressing lentiviral shRNA to luciferase (control) or FGF19, seeded as single cells and grown for 2 weeks in media containing no GFs. Mean and s.d, n = 4 independent experiments, paired two-tailed t-test. d Brightfield images of HB15 tumoroids expressing lentiviral shRNA to luciferase (control) or FGF19, at 9 days after initially seeding 100,000 cells as tumoroids, in media containing All GFs, no GFs, or FGF19. e Growth curve of experiment depicted in d. Mean and s.d., n = 3 independent experiments, 2-way ANOVA with uncorrected Fisher’s LSD. Filled circles: control + All GFs, filled squares: control + FGF19, filled triangles: control + No GFs, open circles: FGF19 KD + All GFs, open squares: FGF19 KD + FGF19, open triangles: FGF19 KD + No GFs. f Brightfield images of HB1 seeded as single cells and grown for 2 weeks in media containing All GFs, no GFs, HB4 conditioned media (CM) without or with MEK inhibitor (MEKi, U0126 5 μM), and HB15 conditioned media (CM) without or with MEK inhibitor (MEKi, U0126 5 μM). g Quantification of Hoechst intensities of tumoroid colonies from f. Mean and s.d., n = 46, 24, 29, 22, 49, and 25 tumoroids for each condition in f, respectively, Kruskal-Wallis with Dunn’s multiple comparisons test. Similar results obtained for n = 2 independent experiments. Due to the inability to accurately control the amount of growth factor secreted into conditioned media by a given tumoroid line across multiple experiments, data from each experiment was compared separately and results from one experiment are shown. For all panels – scale bar: 100 μm, *: p < 0.05, **: p < 0.01, ****: p < 0.0001, ns: not significant. See also Supplementary Fig. S11.
Fig. 8
Fig. 8. Endogenous FGF19 expression in tumor cells depends on β-catenin and SOX4.
a qRT-PCR of HB15 expressing lentiviral GFP (control, filled circles) or dominant negative TCF4 (DN TCF4, open circles). n = 3 independent experiments, paired two-tailed t-test. b Brightfield images of HB15 colonies expressing lentiviral GFP or DN TCF4 in media containing EGF + FGF10 + HGF (All GFs), no GFs, or FGF19. c Quantification of colony assay in b. Mean and s.d., n = 3 independent experiments, ANOVA, uncorrected Fisher’s LSD. d qRT-PCR of HB15 expressing lentiviral shRNA to luciferase (control, filled circles) or SOX4 (open circles). Exact p-values, paired two-tailed t-test – SOX4 (n = 7 independent experiments): 0.0001, MEX3A (n = 6): 0.0005, TEAD2 (n = 7): 0.0001, FGF19 (n = 7): 0.0001, FGF8 (n = 5): 0.0043, FGF9 (n = 5): 0.58, CTNNB1 (n = 7): 0.48, AXIN2 (n = 7): 0.0001, DKK1 (n = 6): 0.88, TBX3 (n = 5): 0.019, HNF4A (n = 5): 0.028, KRT19 (n = 5): 0.066. e Brightfield images of HB15 colonies expressing lentiviral shRNAs to luciferase (control) or SOX4 in media containing All GFs, no GFs, or FGF19. f Quantification of colony assay as in e. Mean and s.d., n = 3 independent experiments, ANOVA, uncorrected Fisher’s LSD. g qRT-PCR for FGF19 in HB17 expressing lentiviral control (luciferase shRNA or GFP, filled circles), compared to DN TCF4 or SOX4 shRNA, respectively (opens circles). n = 3 independent experiments each, paired two-tailed t-test. h Brightfield images of HB17 colonies expressing lentiviral GFP or DN TCF4, in media containing All GFs, no GFs, or FGF19. % colonies formed indicated. i Brightfield images of HB17 colonies expressing lentiviral shRNA to luciferase (control) or SOX4 in media containing All GFs, no GFs, or FGF19. % colonies formed indicated. j qRT-PCR of HB15 expressing lentiviral GFP (control, filled circles) or SOX4 (open circles). n = 4 independent experiments, paired two-tailed t-test. k) Model depicting the spatial organization of different tumor cell types in hepatoblastoma and relative levels of nuclear β-catenin, FGF19, KLB, SOX4, and HNF4A. For all panels – scale bar: 200 μm, *: p < 0.05, **: p < 0.01, ***: p < 0.001, ns: not significant. Source data are provided as a Source Data file. See also Supplementary Fig. S12.

References

    1. Nowell, P. C. The clonal evolution of tumor cell populations. Science194, 23–28 (1976). - PubMed
    1. Greaves, M. & Maley, C. C. Clonal evolution in cancer. Nature481, 306–313 (2012). - PMC - PubMed
    1. Marusyk, A., Janiszewska, M. & Polyak, K. Intratumor Heterogeneity: The Rosetta Stone of Therapy Resistance. Cancer Cell37, 471–484 (2020). - PMC - PubMed
    1. Brock, A., Chang, H. & Huang, S. Non-genetic heterogeneity–a mutation-independent driving force for the somatic evolution of tumours. Nat Rev Genet10, 336–342 (2009). - PubMed
    1. Flavahan, W. A., Gaskell, E. & Bernstein, B. E. Epigenetic plasticity and the hallmarks of cancer. Science357 (2017). 10.1126/science.aal2380. - PMC - PubMed

Publication types

MeSH terms

Associated data