. 2024 Nov 20;15(1):10062.
doi: 10.1038/s41467-024-54404-w.

Bias and negative values of COVID-19 vaccine effectiveness estimates from a test-negative design without controlling for prior SARS-CoV-2 infection

Affiliations

Bias and negative values of COVID-19 vaccine effectiveness estimates from a test-negative design without controlling for prior SARS-CoV-2 infection

Ryan E Wiegand et al. Nat Commun. .

Abstract

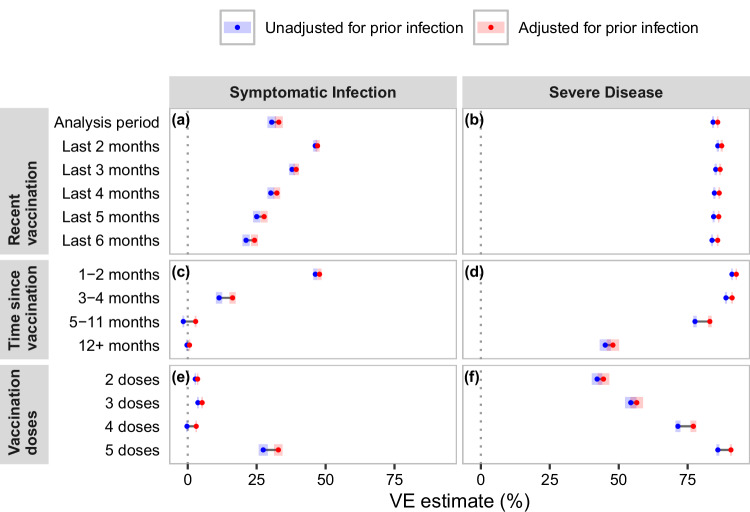
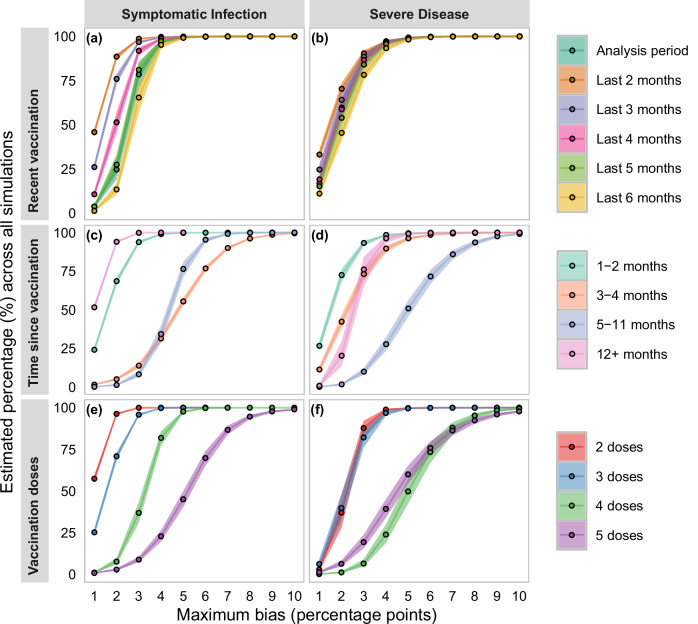
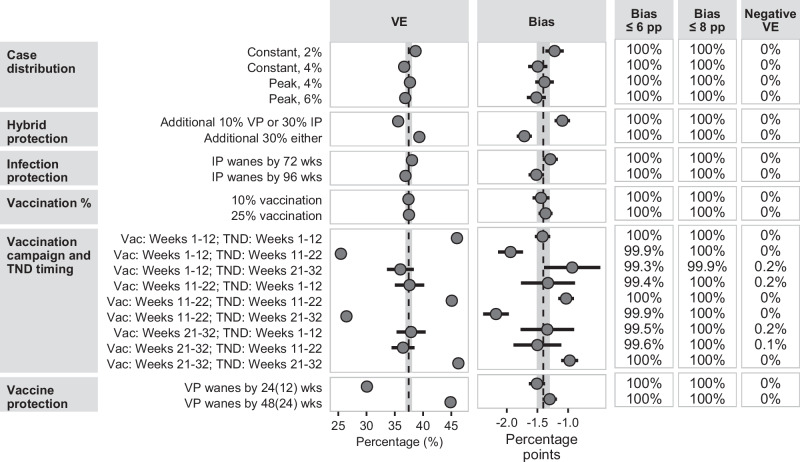
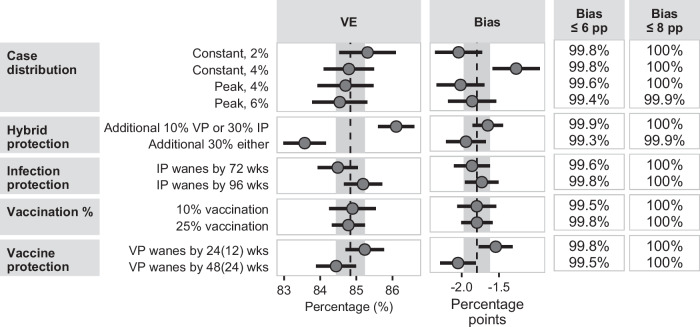
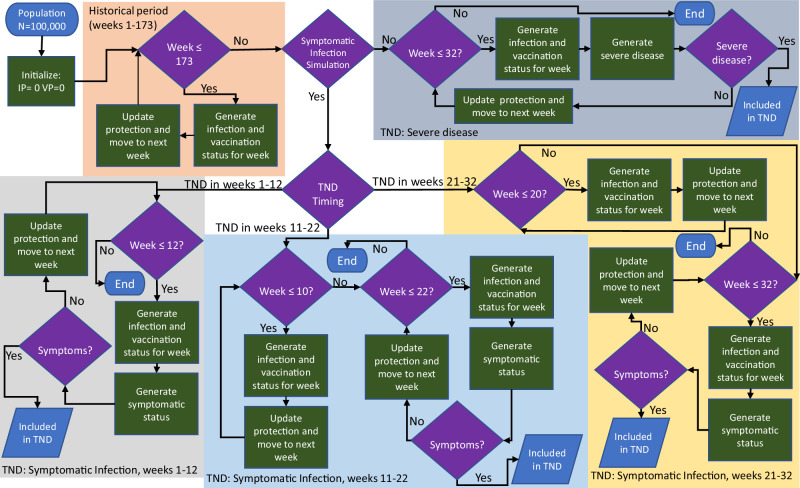
Test-negative designs (TNDs) are used to assess vaccine effectiveness (VE). Protection from infection-induced immunity may confound the association between case and vaccination status, but collecting reliable infection history can be challenging. If vaccinated individuals have less infection-induced protection than unvaccinated individuals, failure to account for infection history could underestimate VE, though the bias is not well understood. We simulated individual-level SARS-CoV-2 infection and COVID-19 vaccination histories and a TND. VE against symptomatic infection and VE against severe disease estimates unadjusted for infection history underestimated VE compared to estimates adjusted for infection history, and unadjusted estimates were more likely to be below 0%, which could lead to an incorrect interpretation that COVID-19 vaccines are harmful. TNDs assessing VE immediately following vaccine rollout introduced the largest bias and potential for negative VE against symptomatic infection. Despite the potential for bias, VE estimates from TNDs without prior infection information are useful because underestimation is rarely more than 8 percentage points.


Conflict of interest statement

Competing interests: The authors declare that they do not have any commercial or other associations that might pose a conflict of interest.

Figures

Fig. 1
Fig. 1. Plot of estimated marginal means of VE against symptomatic infection and VE against severe disease for each exposure.
VE estimates are generated from a simple meta-regression of 768 simulation conditions, each summarized from 1000 simulations without controlling for simulation parameters. Estimates are presented as the marginal mean (as dots) +/− the 95% confidence interval (represented by bars) that are a product of the standard error and normal distribution quantiles. Panel identifiers are (a) recent vaccination exposures for VE against symptomatic infection; (b) recent vaccination exposures for VE against severe disease; (c) time since vaccination exposures for VE against symptomatic infection; (d) time since vaccination exposures for VE against severe disease; (e) vaccination dose exposures for VE against symptomatic infection; and (f) vaccination dose exposures for VE against severe disease.
Fig. 2
Fig. 2. Plot of estimated percentage of bias less than or equal to a percentage point threshold for VE against symptomatic infection and VE against severe disease for multiple exposures.
Bias was computed as the difference between VE calculated from the model that does not adjust for prior infection (“unadjusted”) and the model adjusted for prior infection (“adjusted”). Bias estimates were generated from a meta-regression of aggregated results from 768 simulation conditions, each of which was summarized from 1000 simulations. Estimates are presented as the marginal mean estimate (as dots) +/− the 95% confidence interval (represented by bands connecting the maximum percentage point bias thresholds) that are a product of the standard error estimate and normal distribution quantiles. Panel identifiers are (a) recent vaccination exposures for VE against symptomatic infection; (b) recent vaccination exposures for VE against severe disease; (c) time since vaccination exposures for VE against symptomatic infection; (d) time since vaccination exposures for VE against severe disease; (e) vaccination dose exposures for VE against symptomatic infection; and (f) vaccination dose exposures for VE against severe disease.
Fig. 3
Fig. 3. Plot of estimated marginal means of unadjusted VE (not controlling for prior infection) against symptomatic infection, bias compared to adjusted VE (controlling for prior infection) against symptomatic infection, the percentage of simulations with a bias less than or equal to 6 percentage points (pp), 8 pp, and VE estimate less than zero (negative VE) for people vaccinated in the previous 3 months.
Estimates were generated from a meta-regression of aggregated results from 768 simulation conditions (each of which was summarized from 1000 simulations) after controlling for all other simulation parameters. Bias was computed as the difference between the unadjusted VE estimate compared to the VE estimate adjusted for prior infection. Estimates are presented as the marginal mean (as dots) +/− the 95% confidence interval (represented by solid lines) that are a product of the standard error and normal distribution quantiles. The bars may be narrower than the dot and not visible. The dashed line and shaded region in the VE column represent the overall mean and the 95% confidence interval, respectively, from Fig. 1. In the Bias column, the dashed line and shaded region represent the overall mean and the 95% confidence interval, respectively, from Supplementary Fig. 21.
Fig. 4
Fig. 4. Plot of estimated marginal means of unadjusted VE (not controlling for prior infection) against severe disease, bias compared to adjusted VE (controlling for prior infection), the percentage of simulations with a bias less than or equal to 6 percentage points (pp), or 8 pp for people vaccinated in the previous 3 months.
Estimates were generated from a meta-regression of aggregated results from 768 simulation conditions (each of which was summarized from 1000 simulations) after controlling for all other simulation parameters. Bias was computed as the difference between the unadjusted VE estimate compared to the VE estimate adjusted for prior infection. Estimates are presented as the marginal mean (as dots) +/− the 95% confidence interval (represented by solid lines) that are a product of the standard error and normal distribution quantiles. The dashed line and shaded region in the VE column represent the overall mean and the 95% confidence interval, respectively, from Fig. 1. In the Bias column, the dashed line and shaded region represent the overall mean and the 95% confidence interval, respectively, from Supplementary Fig. 3.
Fig. 5
Fig. 5. Diagram of the simulation process.
IP=infection-induced protection, VP=vaccination-induced protection, TND=test-negative design.

References

    1. Jackson, M. L. & Nelson, J. C. The test-negative design for estimating influenza vaccine effectiveness. Vaccine31, 2165–2168 (2013). - PubMed
    1. Foppa, I. M., Haber, M., Ferdinands, J. M. & Shay, D. K. The case test-negative design for studies of the effectiveness of influenza vaccine. Vaccine31, 3104–3109 (2013). - PubMed
    1. Link-Gelles, R. et al. Early estimates of bivalent mRNA booster dose vaccine effectiveness in preventing symptomatic SARS-CoV-2 infection attributable to omicron BA.5– and XBB/XBB.1.5–related sublineages among immunocompetent adults—increasing community access to testing program, United States. MMWR Morb. Mortal. Wkly. Rep.72, 119–124 (2023). - PMC - PubMed
    1. Tenforde, M. W. et al. Early estimates of bivalent mRNA vaccine effectiveness in preventing COVID-19–associated emergency department or urgent care encounters and hospitalizations among immunocompetent adults—VISION network, nine states. MMWR Morb. Mortal. Wkly. Rep.71, 1616–1624 (2022). - PMC - PubMed
    1. Britton, A. et al. Effectiveness of COVID-19 mRNA vaccines against COVID-19–associated hospitalizations among immunocompromised adults during SARS-CoV-2 omicron predominance — VISION Network, 10 States. MMWR Morb. Mortal. Wkly. Rep.71, 1335–1342 (2022). - PMC - PubMed

Publication types

Substances