. 2024 Nov 20;10(1):131.
doi: 10.1038/s41522-024-00604-7.

Staphylococcus epidermidis alters macrophage polarization and phagocytic uptake by extracellular DNA release in vitro

Affiliations

Staphylococcus epidermidis alters macrophage polarization and phagocytic uptake by extracellular DNA release in vitro

Samira Weißelberg et al. NPJ Biofilms Microbiomes. .

Abstract

Biofilm formation shields Staphylococcus epidermidis from host defense mechanisms, contributing to chronic implant infections. Using wild-type S. epidermidis 1457, a PIA-negative mutant (1457-M10), and an eDNA-negative mutant (1457ΔatlE), this study examined the influence of biofilm matrix components on human monocyte-derived macrophage (hMDM) interactions. The wild-type strain was resistant to phagocytosis and induced an anti-inflammatory response in hMDMs, while both mutants were more susceptible to phagocytosis and triggered a pro-inflammatory response. Removing eDNA from the 1457 biofilm matrix increased hMDM uptake and a pro-inflammatory reaction, whereas adding eDNA to the 1457ΔatlE mutant reduced phagocytosis and promoted an anti-inflammatory response. Inhibiting TLR9 enhanced bacterial uptake and induced a pro-inflammatory response in hMDMs exposed to wild-type S. epidermidis. This study highlights the critical role of eDNA in immune evasion and the central role of TLR9 in modulating macrophage responses, advancing the understanding of implant infections.


Conflict of interest statement

Competing interests: The authors declare no competing interests.

Figures

Fig. 1
Fig. 1. Presence of PIA and eDNA in S. epidermidis biofilms.
(PIA production) Dot blot analysis of cell surface-associated PIA. Surface-bound PIA was extracted from sessile cultures, and spotted onto PVDF membranes. PIA was detected using a polyclonal rabbit α-PIA antiserum and HRP-conjugated anti-rabbit IgG. Columns represent mean pixel depth values for S. epidermidis 1457 and 1457ΔatlE after subtraction of 1457-M10 results. Pixel depth was calculated as a proxy for PIA quantity using the ImageQuantTL software package. Data are representative of five biological replicates. (eDNA release) Left: eDNA detection in sessile S. epidermidis cultures after 24 h static growth using immunofluorescence staining. eDNA was stained with a rabbit α-dsDNA antibody, a conjugated α-rabbit A488 secondary antibody, bacterial cells were stained using DAPI. Scale bar: 5 µm. Right: qRT-PCR-based quantification of eDNA from sessile cultures of S. epidermidis 1457, 1457-M10, and 1457ΔatlE. eDNA was extracted from sessile overnight cultures grown in TSB and preparations were subjected to qRT-PCR analysis using gyrB-specific primers. (Biofilm formation) S. epidermidis 1457, 1457-M10, and 1457ΔatlE were tested for biofilm formation and cell adherence using the microtiter plate assay. Columns represent mean absorption at 570 nm from four biological replicates; error bars depict standard deviation. Results are presented as mean -ΔCt values from four biological replicates. Pairwise comparison was performed using one-way ANOVA. ns: not significant, *P ≤ 0.05; **P ≤ 0.01; ***P ≤ 0.001.
Fig. 2
Fig. 2. Structure of multicellular S. epidermidis assemblies.
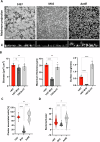
A CLSM analysis of sessile S. epidermidis cultures after overnight growth in TSB. Bacteria were grown for 24 h, stained with DAPI and subjected to microscopic imaging. The upper panel shows the maximum projection of DAPI channel and the lower panel shows the corresponding XZ-view (scale bar: 10 µm). B Biomass, maximum thickness and surface roughness of 1457, 1457-M10 and 1457ΔatlE. At least five confocal images of three independent 24 h sessile cultures per strain were processed using the Comstat add-on in ImageJ. Values represent mean with standard deviation. Pairwise comparison was assessed using one-way ANOVA. C Quantification of bacterial cells organized in cell clusters. Using Imaris and Matlab software packages the proportion of bacteria organized in cell clusters >5 cells was determined by analysis of at least 10 CLSM images per strain. In total, at least 30 images from three independent experiments were analyzed. Statistical analysis was performed using one-way ANOVA with Bonferroni´s correction for multiple testing. D Determination of bacterial aggregate sizes. The size of bacterial cell aggregates was determined using Imaris and Matlab software packages. Per strain, at least 30 images from three independent experiments were analyzed. Statistical analysis was performed using one-way ANOVA with Bonferroni´s correction for multiple testing. ns not significant, P > 0.05; *P ≤ 0.05; **P ≤ 0.01; ***P ≤ 0.001.
Fig. 3
Fig. 3. Phagocytosis of S. epidermidis.
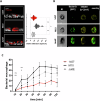
A Imaging of macrophage–S. epidermidis interactions: hMDM were infected with sessile S. epidermidis 1457, 1457-M10 and 1457∆atlE cultures, and the macrophage- bacteria interface was analyzed 2 h after infection using CLSM. Left panel: Representative image of macrophages interacting with sessile S. epidermidis 1457, 1457-M10, and 1457ΔatlE cultures. Co-cultures were stained using DAPI (white) and Phalloidin (red). Scale: 10 µm. Right panel: Quantitative analysis of macrophage infiltration depth. Based on three experiments using macrophages from independent donors, the mean depth of macrophage biofilm infiltration relative to the mean height of the respective sessile cultures was estimated using BiofilmQ and the Comstat plug-in in ImageJ. At least 10 images per experimental condition were analyzed. B Image Stream analysis of S. epidermidis uptake into hMDM. hMDM were infected with static cultures of GFP-expressing S. epidermidis 1457, 1457-M10, and 1457ΔatlE at a MOI 50. After 20 min infection was stopped, macrophages were stained with α-CD14 IgG coupled to A514, and cells were analyzed on an Imaging Flow Cytometer. Representative pictures of three biological replicates are shown. C Time-dependent uptake of S. epidermidis into hMDM. hMDM were infected (MOI 50) with sessile cultures of GFP-expressing 1457, 1457-M10, and 1457ΔatlE. After indicated time points, infection was stopped and extracellular bacteria were discriminated from engulfed bacteria by outside staining using a rabbit α-Staphylococcus epidermidis antiserum and an α-rabbit IgG coupled to AF568. Bacterial uptake by macrophages was evaluated using CLSM and number of intracellular bacteria was determined. At least five pictures (minimum 5 macrophages) per strain and time point were analyzed. Pairwise comparison with wild-type strain 1457 was carried out using one-way ANOVA. Upper significance: 1457 vs. 1457-M10, lower significance: 1457 vs. 1457ΔatlE. ns not significant, P > 0.05; *P ≤ 0.05; **P ≤ 0.01; ***P ≤ 0.001.
Fig. 4
Fig. 4. Macrophage polarization after infection with sessile S. epidermidis cultures.
A Representative FACS plots and quantification of CD14+ positive primary human macrophages uninfected and after infection with S. epidermidis 1457, 1457-M10, and 1457ΔatlE. Cell surface markers were analyzed by immunocytostaining of CD14, CD68, CD36, MHCII and CD163. B, C Quantitative FACS analysis of pro- and anti-inflammatory subtype distribution after hMDM infection with S. epidermidis 1457, 1457-M10, and 1457ΔatlE (MOI 50). Columns represent mean proportion of CD163-positive and CD36+MHCII+ cells, respectively, in the total number of CD14+ cells. Error bars indicate standard deviation. Pairwise comparison was done using one-way ANOVA. D Detailed anti-inflammatory subtype analysis of hMDM after infection with S. epidermidis 1457 (MOI 50). Using immunocytostaining the percentage of hMDM cells positive for CD14, MHCII, CD36, CD68, CD163, CD200R1, CD86, CD150, iNOs was quantified using FACS. EG Relative quantification of IL1B, TNFA, and IL10 gene expression in hMDM after infection with S. epidermidis 1457, 1457-M10, and 1457ΔatlE using GAPDH as a reference housekeeping gene. Columns show mean fold changes determined by the comparative C(t) method of three independent donors relative to uninfected hMDM control. Bars represent standard deviation. Statistical analysis was performed using one-way ANOVA. ns not significant, P > 0.05; *P ≤ 0.05; **P ≤ 0.01; ***P ≤ 0.001.
Fig. 5
Fig. 5. Uptake of S. epidermidis and inflammatory activation of hMDM after eDNA removal.
A Uptake of native, DNaseI-treated and eDNA supplemented, sessile S. epidermidis by hMDM. Uptake of GFP-expressing S. epidermidis was quantified by CLSM after DAPI staining and specific detection of extracellular bacteria S. epidermidis using a rabbit α-Staphylococcus epidermidis antiserum and an α-rabbit IgG coupled to AF568. At least nine images per condition and donor (n = 3) were recorded. B Comparison of anti-inflammatory priming of hMDM after infection with sessile S. epidermidis cultures after DNaseI treatment, and eDNA supplementation. Untreated cultures served as a control. CD14+ and CD163+ cells were detected by immunocytostaining and were quantified using FACS. Columns represent the mean proportion of CD163+ cells within the population of CD14+ cells. Error bars indicate standard deviation. C, D Relative quantification of IL1B, and IL10 expression in hMDM after infection with S. epidermidis 1457, 1457-M10, and 1457ΔatlE using GAPDH as a reference housekeeping gene. Cultures were untreated, treated with DNaseI, or DNaseI-treated and supplemented with chromosomal DNA. Columns represent mean fold changes relative to hMDM infected with S. epidermidis 1457, and based on the analysis of hMDM from four independent donors. Bars represent standard deviation. Statistical analysis was performed using one-way ANOVA with Bonferroni correction for multiple testing on ΔCt values. ns: not significant, P > 0.05; *P ≤ 0.05; **P ≤ 0.01; ***P ≤ 0.001.
Fig. 6
Fig. 6. Importance of TLR9 for hMDM activation by S. epidermidis.
hMDM were treated with TLR9 blocking agent ODN TTAGGG (A151; Invivogen) at 200 nM for 24 h, and subsequently infected with sessile 1457, 1457-M10 and 1457ΔatlE cultures for 2 h. A Quantification of bacteria per hMDM cell was done using CLSM. Inside-Outside staining was performed by staining total bacteria with DAPI and outside-located bacteria using rabbit α-Staphylococcus epidermidis antiserum and a α-rabbit IgG coupled to A568. At least 10 images per experimental condition were analyzed and three individual donors were tested. Columns represent mean number of intracellular bacteria; error bars represent standard deviation. B, C Quantitative analysis of IL1B, and IL10 expression levels in in ODN TTAGGG treated hMDM after infection with S. epidermidis 1457, 1457-M10, and 1457ΔatlE using the 2−ΔΔCt method and using GPDH as a reference housekeeping gene. Columns represent mean fold changes in expression levels relative to untreated hMDM infected with S. epidermidis 1457, and based on the analysis of hMDM from four independent donors. Bars represent standard deviation. Statistical analysis was performed using one-way ANOVA. ns not significant, *P ≤ 0.05; **P ≤ 0.01; ***P ≤ 0.001.
Fig. 7
Fig. 7. Infection of TLR9 KO cells with sessile S. epidermidis.
Murine wild-type macrophages NR-9456 and a corresponding TLR9−/− knock-out cell line NR-9569 cell line were infected with 1457, 1457-M10, and 14570ΔatlE at an MOI 50 for 2 h. A Quantification of bacterial uptake using CLSM. After DAPI staining, and extracellular S. epidermidis were specifically detected using a polyclonal rabbit α-S. epidermidis antiserum and α-rabbit IgG conjugated to AF488. At least 10 images per strain and cell line were recorded and four individual experiments were performed. Columns represent mean bacteria/cell, error bars indicate standard deviation. Pairwise comparison was done using one-way ANOVA. B, C Quantitative analysis of IL1b, and IL10 expression in mouse macrophage cell line NR-9456 and TLR9-/- knock-out cell line NR-9569 after infection with S. epidermidis 1457, 1457-M10, and 1457ΔatlE using GAPDH as a reference housekeeping gene. Columns represent mean fold changes in expression levels determined by comparative C(t)-method relative to untreated hMDM infected with S. epidermidis 1457, and based on the analysis of hMDM from four independent donors. Bars represent standard deviation. Statistical analysis was performed using one-way ANOVA with Bonferroni correction for multiple testing.ns: not significant, *P ≤ 0.05; **P ≤ 0.01; ***P ≤ 0.001.

References

    1. Rosenstein, R. & Gotz, F. What distinguishes highly pathogenic staphylococci from medium- and non-pathogenic? Curr. Top. Microbiol. Immunol.358, 33–89 (2013). - PubMed
    1. Howden, B. P. et al. Staphylococcus aureus host interactions and adaptation. Nat. Rev. Microbiol.21, 380–395 (2023). - PMC - PubMed
    1. Strasheim, W. et al. Surveillance of catheter-related infections: the supplementary role of the microbiology laboratory. BMC Infect. Dis.15, 5 (2015). - PMC - PubMed
    1. Ali, N., Adil, S. N. & Shaikh, M. U. Bloodstream and central line isolates from hematopoietic stem cell transplant recipients: data from a developing country. Transpl. Infect. Dis.16, 98–105 (2014). - PubMed
    1. Platanaki, C., Zareifopoulos, N., Lagadinou, M., Tsiotsios, K. & Velissaris, D. Correlation of positive blood cultures with peripherally inserted central catheter line infection in oncology patients. Cureus13, e12858 (2021). - PMC - PubMed

MeSH terms

LinkOut - more resources