. 2024 Nov 20;15(1):10060.
doi: 10.1038/s41467-024-54469-7.

Regulating copper homeostasis of tumor cells to promote cuproptosis for enhancing breast cancer immunotherapy

Affiliations

Regulating copper homeostasis of tumor cells to promote cuproptosis for enhancing breast cancer immunotherapy

Meng Guan et al. Nat Commun. .

Abstract

Cuproptosis is an emerging mode of programmed cell death for tumor suppression but sometimes gets resisted by tumor cells resist under specific mechanisms. Inhibiting copper transporter ATPase (ATP7A) was found to disrupt copper ion homeostasis, thereby enhancing the effect of cuproptosis and eventually inhibiting tumor invasion and metastasis. In this study, we develop a multifunctional nanoplatfrom based on Cu9S8 (CAPSH), designed to enhance cuproptosis in tumor cells by specifically targeting ATP7A interference, while combining thermodynamic therapy with immune effects. The release of copper ions from CAPSH and the copper homeostasis interference by siRNA cooperatively increases the concentration of copper ions in tumor cells, which induces effectively cuproptosis and activates immune responses for suppressing development and metastasis of tumor. This nanoplatform simultaneously regulates cuproptosis from both principles of onset and development, facilitating the application of cuproptosis in tumor therapy.


Conflict of interest statement

Competing interests: The authors declare no competing interests.

Figures

Fig. 1
Fig. 1. Synthesis and antitumor mechanism of CAPSH.
a Schematic diagram of the synthesis of CAPSH. b Schematic diagram of copper sulfide-based nanocarriers for the regulation of copper homeostasis in tumors enabling synergistic treatment of breast cancer. Figure 1b was created with BioRender.com released under a Creative Commons Attribution 4.0 International license (https://creativecommons.org/licenses/by/4.0/).
Fig. 2
Fig. 2. Characterization of CAPSH.
a TEM images of Cu9S8 and CAPSH, along with an element mapping image of CAPSH. Images are representative of three independent experimental replicates. Scale bar: 100 nm. b XRD pattern of Cu9S8. c, d XPS energy spectra of elemental Cu and elemental S of Cu9S8. e UV-vis absorption spectra of Cu9S8 and Cu2O. f Nitrogen adsorption and desorption curves and (illustration) pore size distribution of Cu9S8. g Hydration diameter of Cu9S8, CAP, CAPS, and CAPSH. Data were presented as the means ± SD (n = 3 independent experiments). h Zeta potential of Cu9S8, CAP, CAPS, and CAPSH. Data were presented as the means ± SD (n = 3 independent experiments). i UV-vis absorption spectra of Cu9S8, CA, CAP and CAPH. j Delayed determination of siRNA by agarose gel electrophoresis at different w/w ratios of Cu9S8 to siRNA. Images are representative of three independent experimental replicates. k Zeta potentials of Cu9S8 and siRNA with different w/w. Data were presented as the means ± SD (n = 3 independent experiments). l XPS energy spectra of elemental P of Cu9S8. m XPS energy spectra of elemental P of CAPS. Source data are provided as a Source Data file.
Fig. 3
Fig. 3. Photothermal, radical generation, and drug/copper ions release of CAPSH.
a, b Temperature versus time curves and thermal imaging results of Cu9S8 (0–100 μg/mL) under 1064 nm laser irradiation (0.75 W/cm2). Data were presented as the means ± SD (n = 3 independent experiments). c, d Temperature versus time curves and thermal imaging results of Cu9S8 at 100 μg/mL under 1064 nm laser irradiation (0.25–0.75 W/cm2). Data were presented as the means ± SD (n = 3 independent experiments). e Temperature rise and fall curves of Cu9S8 irradiated repeatedly with a 1064 nm laser irradiation (0.75 W/cm2). f Photothermal conversion efficiency curve of Cu9S8. g Free radical production was induced by irradiating CAPH at different times using a 1064 nm laser. h ESR spectra in AIPH, Cu9S8, and CAPH solutions irradiated with a 1064 nm laser using POBN as a spin-trapping agent. i AIPH release from CAPH in PBS at different pH (n=independent experiments). j Copper ions release of CAPSH in PBS at different pH (n = 3 independent experiments). Source data are provided as a Source Data file.
Fig. 4
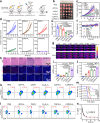
Fig. 4. Therapeutic effects of the CAPSH at the cellular level.
a MTT for CPH toxicity on 4T1 cells. Data were presented as the means ± SD (n = 4 independent experiments). b, c Cell survival of 4T1 cells after different treatments. The concentration of AIPH in (b) was 10 μg/mL, and the concentration of Cu9S8 in CPH, CAPH, and CAPSH was 40 μg/mL. Data were presented as the means ± SD (n = 5 independent experiments). The concentration of AIPH in (c) was 20 μg/mL, and the concentration of Cu9S8 in CPH, CAPH, and CAPSH was 80 μg/mL. Data were presented as the means ± SD (n = 5 independent experiments). d Flow cytometry was used to detect the intake of CAPSH by 3T3 and 4T1 cells at different time points. The gate strategy is shown in Supplementary Fig. 37. e Fluorescence images of intracellular free radicals. Images are representative of three independent experimental replicates. Scale bar: 50 μm. f Images of 4T1 cells co-stained with calcineurin-AM (green)/PI (red) after different treatments. Images are representative of three independent experimental replicates. Scale bar: 100 μm. g Flow cytometry for cell survival at 4T1 after different treatments. Images are representative of three independent experimental replicates. The gate strategy is shown in Supplementary Fig. 37. Significance between the two groups in (b, c) was assessed by unpaired two-tailed Student’s t-test. Source data are provided as a Source Data file.
Fig. 5
Fig. 5. Mechanism of cell death mediated by CAPSH.
a Bioinformatics analysis of ATP7A in BRCA. b Bioinformatics analysis of DLAT in BRCA. c, d Patient survival analysis of ATP7A and DLAT in BRCA. e, f mRNA levels of ATP7A and DLAT in 4T1 and 3T3 cells. Data were presented as the means ± SD (n = 3 independent experiments). g A functional model of ATP7A in tumor growth and metastasis. h Protein content of ATP7A in 4T1 cells after different treatments. Data were presented as the means ± SD (n = 3 independent experiments). i LOX activity of 4T1 cells after different treatments. Data were presented as the means ± SD (n = 3 independent experiments). j DLAT, FDX1, and LIAS protein levels after treatment of 4T1 cells with different samples. Images are representative of three independent experimental replicates. The samples of the same group were derived from the same experiment, and the gels/blots were processed in parallel. k, l Immunofluorescence analysis of the expression of HMGB1 and CRT in 4T1 cells after different treatments, DAPI was used to stain nuclei (blue). Images are representative of three independent experimental replicates. Scale bar: 50 μm. m Quantitative analysis of HSP70 expression in 4T1 cells after different treatments using flow cytometry. Images are representative of three independent experimental replicates. The gate strategy is shown in Supplementary Fig. 38. Significance between two groups in (e, f) was assessed by unpaired two-tailed Student’s t-test, and between each of the multiple groups in (h, i) was calculated using one-way ANOVA. Source data are provided as a Source Data file. Figure 5g was created with BioRender.com released under a Creative Commons Attribution 4.0 International license (https://creativecommons.org/licenses/by/4.0/).
Fig. 6
Fig. 6. Subcutaneous tumor model of breast cancer.
a Transplanted tumor model in mice. b Photographs of representative tumors after different treatments, n = 5 mice per group. c Tumor volume after different treatments. Data were presented as the means ± SD (n = 5 mice per group). d Tumor volume change curves for each mouse after different treatments. e Tumor weights obtained after different treatments. Data were presented as the means ± SD (n = 5 mice per group). f Changes in body weight of mice after different treatments. Data were presented as the means ± SD (n = 5 mice per group). g Thermal imaging of Cu9S8 + L and CAPH + L groups at different times. h H&E sections and immunofluorescence staining (Ki-67 and Tunel) of tumor tissues from mice of different treatment groups. Images are representative of three biologically independent mice. Scale bar: 100 μm. i mRNA levels of TNF-α in different treated tumors. Data were presented as the means ± S.D. (n = 3 mice per group). j mRNA levels of IFN-γ in different treated tumors. Data were presented as the means ± SD (n = 3 mice per group). k Flow cytometry analysis of DC cells in the tumor. Images are representative of three independent experimental replicates. The gate strategy is shown in Supplementary Fig. 39. l Flow cytometry analysis of CD8+ T cells in the tumor. Images are representative of three independent experimental replicates. The gate strategy is shown in Supplementary Fig. 39. m Survival rate of breast cancer model mice after different treatments, n = 10 mice per group. n Changes of Cu in blood over time. Data were presented as mean ± 95% confidence interval (n = 3 mice per group). The significance between each of the multiple groups in (c, e, i, j) was calculated using one-way ANOVA. Source data are provided as a Source Data file.
Fig. 7
Fig. 7. In situ tumor model of breast cancer.
a In situ tumor model in mice. b Photographs of representative tumors after different treatments, n = 4 mice per group. c Tumor volume after different treatments. Data are presented as the means ± SD (n = 4 mice per group). d Tumor volume change curves for each mouse after different treatments. e In vivo bioluminescence imaging of mice before and after treatment. f Tumor weights obtained after different treatments. Data were presented as the means ± SD (n = 4 mice per group). g Changes in body weight of mice after different treatments. Data were presented as the means ± SD (n = 4 mice per group). h mRNA levels of IFN-γ in different treated tumors. Data were presented as the means ± SD (n = 4 mice per group). i mRNA levels of TNF-α in different treated tumors. Data were presented as the means ± SD (n = 4 mice per group). j H&E sections and immunofluorescence staining (Tunel, Ki-67, CD8, and CD4) of tumor tissues from mice of different treatment groups. Images are representative of three biologically independent mice. Scale bar: 100 μm. k mRNA levels of ATP7A in different treated tumors. Data were presented as the means ± SD (n = 4 mice per group). l mRNA levels of LIAS in different treated tumors. Data were presented as the means ± SD (n = 4 mice per group). m mRNA levels of FDX 1 in different treated tumors. Data were presented as the means ± SD (n = 4 mice per group). The significance between each of the multiple groups in (c, f, h, i, k, l, m) was calculated using one-way ANOVA. Source data are provided as a Source Data file. Figure 7a was created with BioRender.com released under a Creative Commons Attribution 4.0 International license (https://creativecommons.org/licenses/by/4.0/).
Fig. 8
Fig. 8. Inhibition of metastasis and long-term immune memory.
a Schematic diagram of experimental design for transferring animals. b Representative photos of lung tissue and H&E staining of middle lung tissue in each group of mice. Images are representative of three biologically independent mice. Scale bar: 2 mm (top) and 400 μm (bottom). c Flow cytometry analysis of CD4+ T cells in the lymph nodes and spleen. Images are representative of three biologically independent mice. Source data are provided as a Source Data file.

References

    1. Bedoui, S., Herold, M. & Strasser, A. Emerging connectivity of programmed cell death pathways and its physiological implications. Nat. Rev. Mol. Cell Biol.21, 678–695 (2020). - PubMed
    1. Fan, J. X. et al. Engineered bacterial bioreactor for tumor therapy via fenton-like reaction with localized H2O2 generation. Adv. Mater.31, 1808278 (2019). - PubMed
    1. Tsvetkov, P. et al. Copper induces cell death by targeting lipoylated TCA cycle proteins. Science375, 1254–1261 (2022). - PMC - PubMed
    1. Xu, Y. Z. et al. An enzyme-engineered nonporous copper (I) coordination polymer nanoplatform for cuproptosis-based synergistic cancer therapy. Adv. Mater.34, 2204733 (2022). - PubMed
    1. Chen, K. et al. An intelligent cell-derived nanorobot bridges synergistic crosstalk between sonodynamic therapy and cuproptosis to promote cancer treatment. Nano Lett.23, 3038–3047 (2023). - PubMed

Publication types

LinkOut - more resources