. 2024 Nov 20;14(1):28774.
doi: 10.1038/s41598-024-79315-0.

Impact of microgravity and lunar gravity on murine skeletal and immune systems during space travel

Affiliations

Impact of microgravity and lunar gravity on murine skeletal and immune systems during space travel

Yui Okamura et al. Sci Rep. .

Abstract

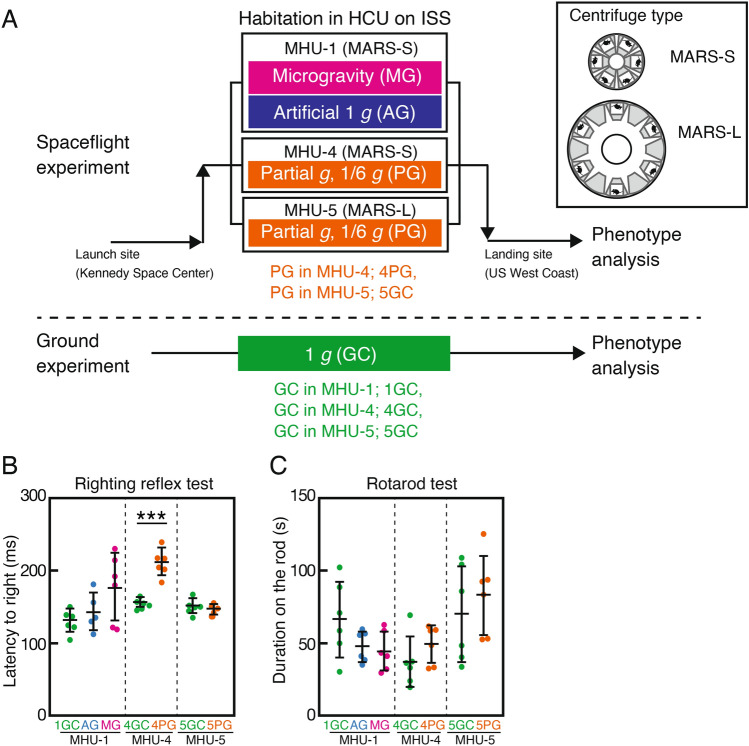
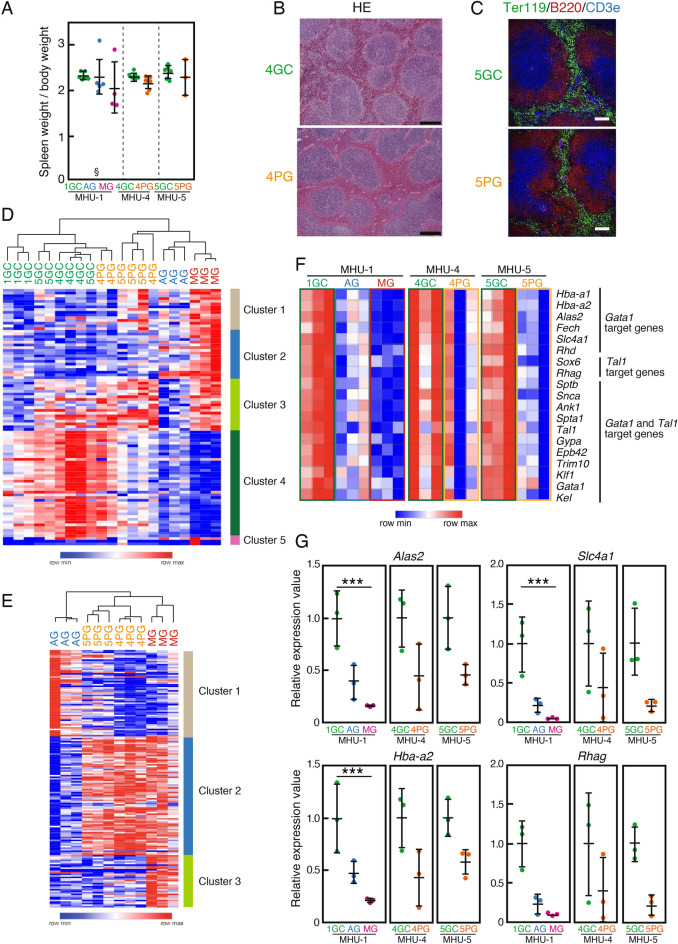
Long-duration spaceflight creates a variety of stresses due to the unique environment, which can lead to compromised functioning of the skeletal and immune systems. However, the mechanisms by which organisms respond to this stress remain unclear. The present study aimed to investigate the impact of three different gravitational loadings (microgravity, 1/6 g [lunar gravity], and 1 g) on the behavior, bone, thymus, and spleen of mice housed for 25-35 days in the International Space Station. The bone density reduction under microgravity was mostly recovered by 1 g but only partially recovered by 1/6 g. Both 1 g and 1/6 g suppressed microgravity-induced changes in some osteoblast and osteoclast marker gene expression. Thymus atrophy induced by microgravity was half recovered by both 1 g and 1/6 g, but gene expression changes were not fully recovered by 1/6 g. While no histological changes were observed due to low gravity, alterations in gene expression were noted in the spleen. We found that in bone and thymus, lunar gravity reduced microgravity-induced histological alterations and partially reversed gene expression changes. This study highlighted organ-specific variations in responsiveness to gravity, serving as an animal test for establishing a molecular-level gravity threshold for maintaining a healthy state during future spaceflight.

Keywords: Bone; Gene expression; Microgravity; Spaceflight; Spleen; Thymus.


Conflict of interest statement

Competing interests: The authors declare no competing interests.

Figures

Fig. 1
Fig. 1
Overview of spaceflight experiments and behavioral tests. (A) Overview of the Mouse Habitat Unit (MHU) missions. Each experimental group is color-coded (MG (microgravity) for magenta, AG (artificial 1 g) for dark blue, PG (partial gravity, 1/6 g) for orange, and GC (1 g) for green), and each color corresponds to a letter color and a plot point in the figure. 1GC: MHU-1_GC; 4GC: MHU-4_GC; 5GC: MHU-5_GC; MG: MHU-1_MG; AG: MHU-1_AG; 4PG: MHU-4_PG; 5PG: MHU-5_PG. (B,C) Effects of each gravity condition on vestibular function using a mid-air righting reflex test (B) and a rotarod performance test (C). Data are represented as the mean and standard deviation (SD), and each dot represents an individual mouse (n = 5–6). P-value from the Student’s t-test is indicated as ***P < 0.001.
Fig. 2
Fig. 2
Micro-computed tomography analysis of bone mass in the distal region of the right femur in the three MHU missions. (A) Three-dimensional images of the horizontal and vertical sections are shown in the upper and lower panels, respectively. (B) Bone structure and mineral content in the trabecular and cortical bones analyzed with micro-computed tomography. The sample size for each group was n = 6, except for the MG group of MHU-1 (n = 5), which was due to bone destruction caused by sampling error. BV/TV trabecular bone volume/tissue volume, Tb.Th trabecular bone thickness, Tb.N trabecular bone number, Tb.Sp trabecular bone separation, BMC/TV bone mineral content/tissue volume in trabecular bone, Ct.Th cortical bone thickness, Ct.Ar cortical bone cross-sectional area, BMD bone mineral density in cortical bone. P-values from Tukey’s test, Dunn’s test (MHU-1), Student’s t-test, and Mann–Whitney U test (MHU-4 and -5) are indicated as follows: *P < 0.05, **P < 0.01, and ***P < 0.001. Non-normally distributed data are indicated as §. (C) The plasma levels of TRAP and osteocalcin. Data are represented as mean ± SD, and each dot represents an individual mouse. P-values from Tukey’s test, Dunn’s test (MHU-1), Student’s t-test, and Mann–Whitney U test (MHU-4 and -5) are indicated as follows: *P < 0.05 and ***P < 0.001. Non-normally distributed data are indicated as §.
Fig. 3
Fig. 3
Analysis of gene expression profiling in osteocyte-rich fraction of bone. (A) Clustering heatmap illustrating normalized (Z-score and one plus log 2) expression values for 485 differentially expressed genes in the bone between MG and 1GC. (B) Gene ontology analysis of gene clusters 1, 3, and 4 in (A). (C) Heatmap illustrating normalized (Z-score and one plus log 2) expression values for representative osteoblast- and osteoclast-related genes. (D) Differentially expressed osteoblast-related genes in (C). (E) Differentially expressed osteoclast-associated genes in (C). Data are presented as the mean and SD, and each dot represents an individual mouse (n = 3). FDR-corrected P values were calculated P < 0.05 (CLC MW, Empirical analysis of DGE tool). *P < 0.05, **P < 0.01, and ***P < 0.001.
Fig. 4
Fig. 4
Analysis of histological and gene expression changes in the thymus under microgravity and lunar gravity conditions. (A) Body-weight normalized thymus weights (mg/g) from MHU-1, -4, and -5 missions and ground control (GC). Data are represented as the mean and SD, and each point represents an individual mouse; MHU-1 (MG: n = 4, AG: n = 5, 1GC: n = 6), MHU-4 (4GC: n = 6, 4PG: n = 6), MHU-5 (5GC: n = 6, 5PG: n = 3). P-values from Dunn’s test (MHU-1) and Student’s t-test (MHU-4 and -5) are indicated as follows: *P < 0.05 and **P < 0.01. Non-normally distributed data are indicated as §. (B) Hematoxylin–eosin staining of paraffin-embedded thymus sections from MHU-4 mission. Scale bars indicate 100 μm. MHU-4 (4GC: n = 6, 4PG: n = 6), MHU-5 (5GC: n = 6, 5PG: n = 5). (C) Immunohistochemical staining of frozen sections of thymus from MHU-4 mission with Krt8 (green) and Krt5 (red) in the left panels and Aire (green), UEA-1 (red), and nuclei (blue) in the right panels. Scale bars indicate 1 mm for left panels and 100 μm for right panels. MHU-4 (4GC: n = 6, 4PG: n = 6), MHU-5 (5GC: n = 6, 5PG: n = 5). (D) Clustering heatmap illustrating normalized (Z-score and one plus log 2) expression values for 2880 differentially expressed genes in the thymus between MHU-1_MG and MHU-1_GC. (E) Gene ontology analysis of genes in each cluster.
Fig. 5
Fig. 5
Effect of lunar gravity on the spleen. (A) Body-weight normalized spleen weights (mg/g) from MHU-1, -4, and -5 missions and ground control (GC). Data are presented as the mean and SD, and each point represents an individual mouse; MHU-1 (MG: n = 4, AG: n = 5, 1GC: n = 6), MHU-4 (4GC: n = 6, 4PG: n = 6), MHU-5 (5GC: n = 6, 5PG: n = 3). Non-normally distributed data are indicated as §. (B) Hematoxylin–eosin staining of paraffin-embedded spleen sections from MHU-4 mission. Scale bars indicate 200 μm. MHU-4 (4GC: n = 3, 4PG: n = 3), MHU-5 (5GC: n = 3, 5PG: n = 3). (C) Immunohistochemical staining of frozen sections of spleen from MHU-5 mission with Ter119 (green), B220 (red), and CD3e (blue). Scale bars indicate 100 μm. MHU-4 (4GC: n = 3, 4PG: n = 3), MHU-5 (5GC: n = 3, 5PG: n = 3). (D) Clustering heatmap illustrating normalized (Z-score and one plus log 2) expression values for 94 differentially expressed genes in the thymus between MG and 1GC. (E) Clustering heatmap illustrating normalized (Z-score and one plus log 2) expression values for 167 differentially expressed genes in the thymus between MHU-1_MG and MHU-1_AG. (F) Heatmap illustrating normalized (Z-score and one plus log 2) expression values for erythrocyte-related genes regulated by Gata1 and Tal1. (G) Differentially expressed erythrocyte-related genes in (F). Data are represented as mean ± SD, and each dot represents an individual mouse (n = 3). FDR-corrected P values were calculated at P < 0.05 (CLC MW, Empirical analysis of DGE tool). ***P < 0.001.

References

    1. Rutter, L. et al. A new era for space life science: international standards for space omics processing. Patterns (N Y)1, 100148, 10.1016/j.patter.2020.100148 (2020). - PMC - PubMed
    1. Witze, A. Lift off! Artemis Moon rocket launch kicks off new era of human exploration. Nature611, 643–644. 10.1038/d41586-022-02310-w (2022). - PubMed
    1. Vandenburgh, H., Chromiak, J., Shansky, J., Del Tatto, M. & Lemaire, J. Space travel directly induces skeletal muscle atrophy. FASEB J.13, 1031–1038. 10.1096/fasebj.13.9.1031 (1999). - PubMed
    1. Grimm, D. et al. The impact of microgravity on bone in humans. Bone87, 44–56. 10.1016/j.bone.2015.12.057 (2016). - PubMed
    1. Morita, H., Kaji, H., Ueta, Y. & Abe, C. Understanding vestibular-related physiological functions could provide clues on adapting to a new gravitational environment. J. Physiol. Sci.70, 17. 10.1186/s12576-020-00744-3 (2020). - PMC - PubMed

LinkOut - more resources