

Pediatric brain tumor patients display altered immune activation and reduced lymphopoiesis at the onset of disease
- PMID: 39567679
- PMCID: PMC11579487
- DOI: 10.1038/s41698-024-00755-y
Pediatric brain tumor patients display altered immune activation and reduced lymphopoiesis at the onset of disease
Abstract
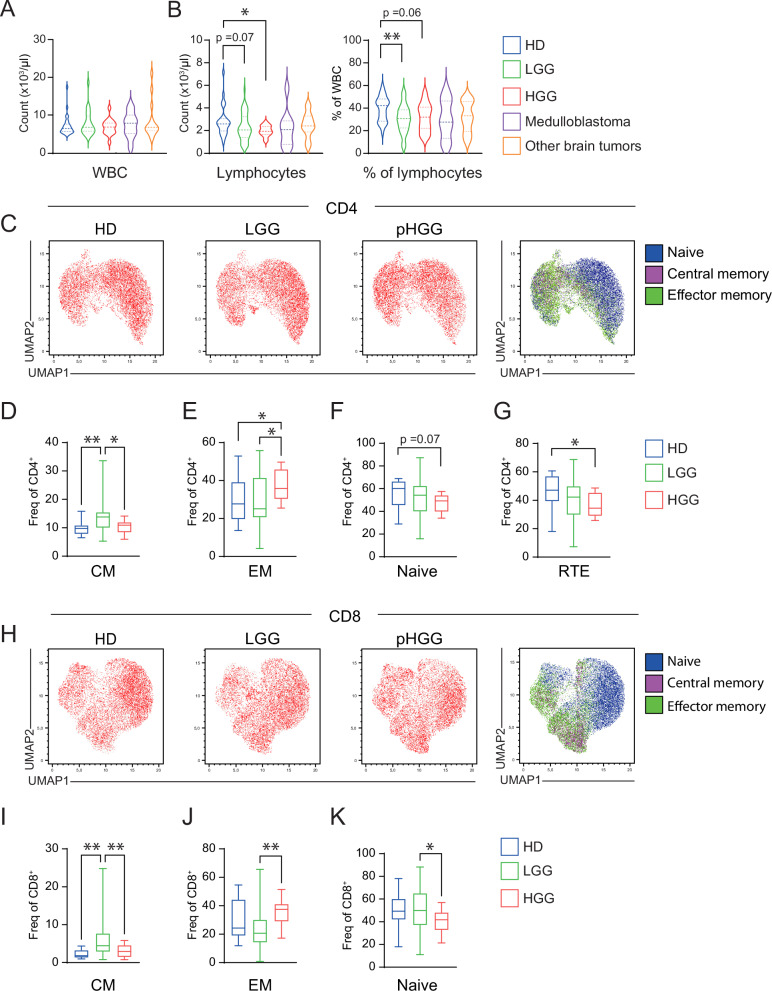
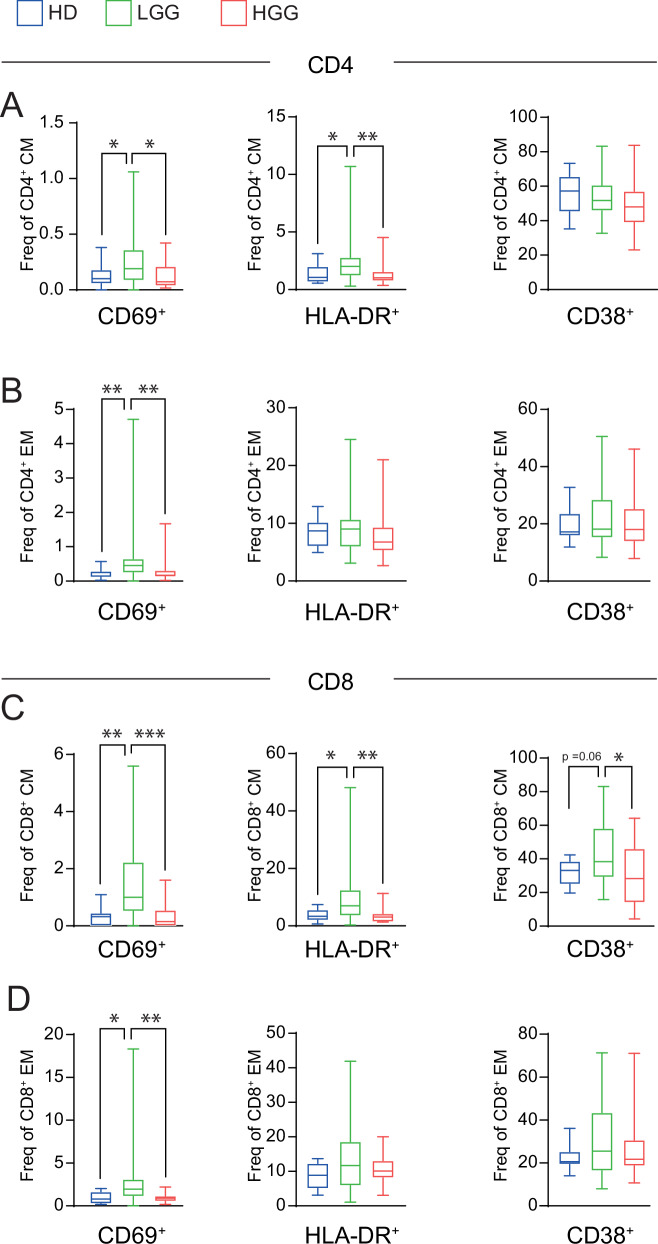
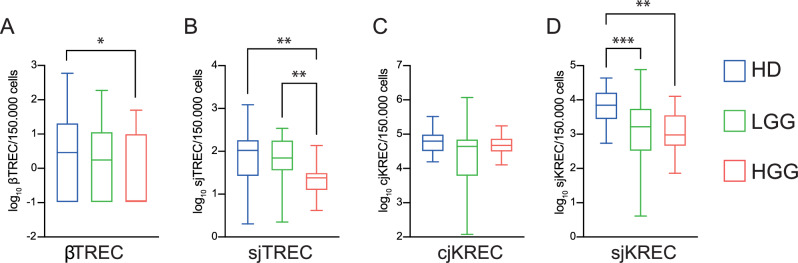
Optimal immune function is crucial in preventing cancer development and growth and for the success of anti-cancer therapies. Here, we characterized the peripheral immunological status of 83 steroids-naïve pediatric patients with central nervous system neoplasia at the disease onset. Tumors were classified into low-grade gliomas (LGG), high-grade gliomas (HGG), medulloblastoma, and other tumors. We revealed that glioma patients showed an altered lymphocyte pool. T-cells of HGG patients shifted from naïve to effector memory phenotype. LGG patients exhibited T-cell central memory expansion and higher T-cell activation. Interestingly, HGG patients displayed reduced thymic function. Furthermore, LGG and HGG patients showed reduced activated B-cells and suboptimal B-cell formation. Our data demonstrate that glioma patients have reduced lymphopoiesis at the disease onset, which could contribute to the systemic lymphopenia characterizing these patients. This study offers novel insights into the immunological status of brain tumor patients which may help in designing more effective treatments.
© 2024. The Author(s).
Conflict of interest statement
Competing interests: The authors have no conflict of interest related to this work. Prof. Locatelli reports personal fees from Amgen, personal fees from Novartis, other from Bellicum Pharmaceutical, other from Neovii, personal fees from Miltenyi, personal fees from Medac, personal fees from Jazz Pharmaceutical, personal fees from Takeda, outside the submitted work.
Figures

Similar articles
-
Low-grade glioma harbors few CD8 T cells, which is accompanied by decreased expression of chemo-attractants, not immunogenic antigens.Sci Rep. 2019 Oct 10;9(1):14643. doi: 10.1038/s41598-019-51063-6. Sci Rep. 2019. PMID: 31601888 Free PMC article.
-
Low- and high-grade glioma endothelial cells differentially regulate tumor growth.bioRxiv [Preprint]. 2023 Jul 7:2023.07.07.548125. doi: 10.1101/2023.07.07.548125. bioRxiv. 2023. Update in: Mol Cancer Res. 2024 Jul 2;22(7):656-667. doi: 10.1158/1541-7786.MCR-23-1069. PMID: 37461434 Free PMC article. Updated. Preprint.
-
Comparison of 3'-deoxy-3'-[18F]fluorothymidine PET and O-(2-[18F]fluoroethyl)-L-tyrosine PET in patients with newly diagnosed glioma.Nucl Med Biol. 2012 Oct;39(7):977-81. doi: 10.1016/j.nucmedbio.2012.02.009. Epub 2012 Apr 5. Nucl Med Biol. 2012. PMID: 22483845 Clinical Trial.
-
Development of immunotherapy for high-grade gliomas: Overcoming the immunosuppressive tumor microenvironment.Front Med (Lausanne). 2022 Sep 14;9:966458. doi: 10.3389/fmed.2022.966458. eCollection 2022. Front Med (Lausanne). 2022. PMID: 36186781 Free PMC article. Review.
-
An evidence-based approach to assess the accuracy of intravoxel incoherent motion imaging for the grading of brain tumors.Medicine (Baltimore). 2018 Nov;97(45):e13217. doi: 10.1097/MD.0000000000013217. Medicine (Baltimore). 2018. PMID: 30407363 Free PMC article. Review.
References
LinkOut - more resources
Full Text Sources
