. 2024 Dec;636(8042):481-487.
doi: 10.1038/s41586-024-08202-5. Epub 2024 Nov 20.

Cephalopod-inspired jetting devices for gastrointestinal drug delivery

Affiliations

Cephalopod-inspired jetting devices for gastrointestinal drug delivery

G Arrick et al. Nature. 2024 Dec.

Abstract

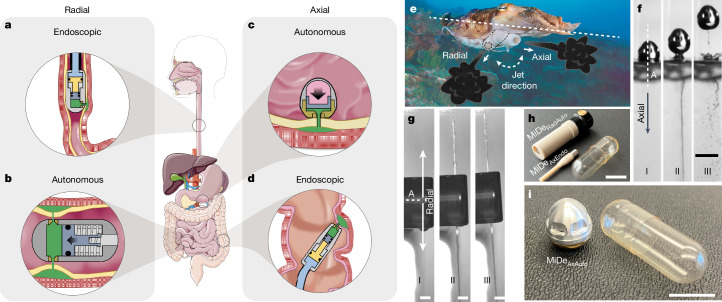
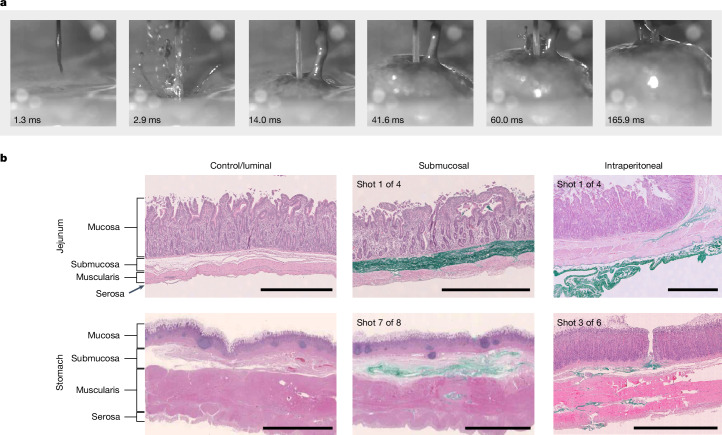
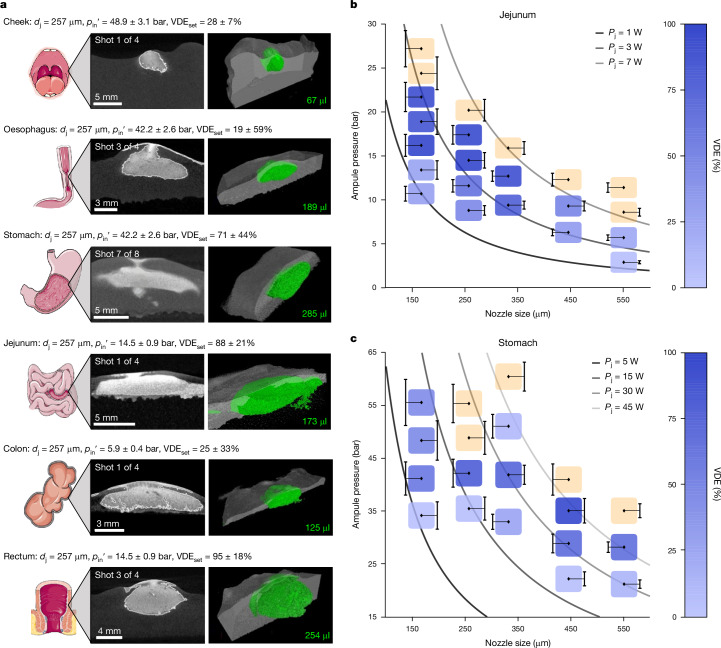
Needle-based injections currently enable the administration of a wide range of biomacromolecule therapies across the body, including the gastrointestinal tract1-3, through recent developments in ingestible robotic devices4-7. However, needles generally require training, sharps management and disposal, and pose challenges for autonomous ingestible systems. Here, inspired by the jetting systems of cephalopods, we have developed and evaluated microjet delivery systems that can deliver jets in axial and radial directions into tissue, making them suitable for tubular and globular segments of the gastrointestinal tract. Furthermore, they are implemented in both tethered and ingestible formats, facilitating endoscopic applications or patient self-dosing. Our study identified suitable pressure and nozzle dimensions for different segments of the gastrointestinal tract and applied microjets in a variety of devices that support delivery across the various anatomic segments of the gastrointestinal tract. We characterized the ability of these systems to administer macromolecules, including insulin, a glucagon-like peptide-1 (GLP1) analogue and a small interfering RNA (siRNA) in large animal models, achieving exposure levels similar to those achieved with subcutaneous delivery. This research provides key insights into jetting design parameters for gastrointestinal administration, substantially broadening the possibilities for future endoscopic and ingestible drug delivery devices.


Conflict of interest statement

Competing interests: D. Sticker, A.G., T.D., B.M., J.P.H.J., D. Schultz, E.M.D.A., M. Poulsen, C.A., H.D.P., N.E.E., C.C., A.H.U., M. Pereverzina, R.K.K., C.M.D., S.B.G., I.P., A.B., A.A., M.R.F., P.H., U.L.R., J.J.W. and S.T.B. are employees and shareholders of Novo Nordisk. G.T. has received consulting fees and grant funding from Novo Nordisk. B.M., J.P.H.J. and M.R.F. are inventors of the following patent: ‘Jensen, B. et al. Medical Device with Actuation Mechanism. WO2020157324 (6 August 2020)’. G.A., D. Sticker, A.G., Y.L., D.G., B.M., J.W., J.P.H.J., T.S.L., C.C., S.Y., A.B., N.R., J.J.W. and G.T. are inventors of the following patent: ‘Arrick, G. et al. Drug Delivery Device. WO2022034041 (17 February 2022)’. G.A., D. Sticker, A.G., D.G., J.W., J.P.H.J., M. Poulsen, C.C., J.J.W. and G.T. are inventors of the following patent: ‘Traverso, G. et al. Ingestible Drug Delivery Device. WO2022035750 (17 February 2022)’. The other authors declare no competing interests.

Figures

Fig. 1
Fig. 1. Axial and radial MiDe jetting concepts for needle-free drug delivery to gastrointestinal organs.
a, Radial endoscopic concept for jet delivery in the oesophagus (MiDeRadEndo). b, Radial autonomous concept for jet delivery in the small intestine (MiDeRadAuto). c, Axial autonomous concept for jet delivery in the stomach (MiDeAxAuto). d, Axial endoscopic concept for jet delivery in the colon (MiDeAxEndo). In ad, organ images are modified with permission from Servier Medical Art under CC BY 4.0 (https://creativecommons.org/licenses/by/4.0/). e, Visualization of a cuttlefish (Sepia officinalis), which is capable of actively adjusting the jet direction relative to its axis of rotation (indicated by the dashed line) and comparison between two distinct funnel orientations of the cuttlefish in axial and radial directions (image used in modified form with permission from Aleksei Permiakov). f,g, Corresponding MiDe drug delivery devices with sequential frames capturing the jet dynamics from the axial MiDeAxAuto delivery system (f; scale bar, 1 cm) and the radial MiDeRadAuto delivery system (g; scale bars, 2 mm), before triggering (I), during jet expulsion (II) and after the expulsion ceases (III). A is the axis of rotation. h, Photograph of the radial autonomous (MiDeRadAuto) and axial endoscopic (MiDeAxEndo) drug delivery systems alongside a 000 capsule for size reference. Scale bar, 1 cm. i, Photograph showing the axial autonomous gastric delivery system (MiDeAxAuto) alongside a 000 capsule for size reference. Scale bar, 1 cm.
Fig. 2
Fig. 2. Jet dynamics and histological characterization reveals bolus location past the mucosal barrier.
a, Frames from high-speed imaging showing a depot forming in porcine jejunal tissue ex vivo (see Supplementary Video 1). b, Representative haematoxylin and eosin (H&E)-stained histological tissue sections of porcine jejunum and stomach (antrum/lower corpus). Tissue layers are labelled for reference and typical depositions (green) are shown for targeting the submucosa or the intraperitoneal space. Number of independent replicates: n = 1 for jejunum and stomach control/luminal, n = 4 for jejunum submucosal and intraperitoneal, n = 8 for stomach submucosal, and n = 6 for stomach intraperitoneal (all with similar results as the representative sections shown). Scale bars: 1 mm (jejunum) and 5 mm (stomach).
Fig. 3
Fig. 3. Ex vivo tissue characterization following liquid jet delivery to multiple gastrointestinal locations.
a, Exemplary submucosal depots from the cross-organ study with porcine tissue. For each organ, the image on the left is a single slice from the micro-CT scan. Bright regions represent dye, dark grey regions represent tissue and black indicates void. The image on the right is the corresponding 3D reconstruction, with segmented submucosal fluid displayed in green. For each example, the nozzle diameter (dj), corrected ampule pressure (pin′) and mean VDE for the associated set (VDEset) are included. Organ cartoons are included with permission from Servier Medical Art under CC BY 4.0 (https://creativecommons.org/licenses/by/4.0/). b,c, Heat maps capturing the VDE in jejunal (b) and stomach (antrum/lower corpus) (c) tissue. The sizes of the coloured boxes are arbitrary and the error bars next to each box represent 99% prediction intervals for corrected ampule pressure (per linear regressions of the output performance of the jetting apparatus). The shade of the box surrounding each experimental point indicates the VDE of that point. Light orange boxes indicate shots that were observed to have gone through the tissue (intraperitoneal shots). Lines of constant jetting power (Pj) are also shown for reference.
Fig. 4
Fig. 4. In vivo testing with proof-of-concept jetting devices.
a,b, Plasma concentration of insulin analogue after jet delivery (0.21 mg in 200 µl) at different jet output pressures to pig small intestine (a) and dog stomach antrum (b) using MiDeAxEndo (under anaesthesia with recovery directly after). a, n = 3 pigs for 3.5 and 5.0 bar and n = 7 pigs for 9.4 bar. b, n = 4 dogs for 11.3 bar and n = 7 dogs for 24.5 bar. c, Plasma concentration of long-acting inactive GLP1 analogue after jet delivery to pig small intestine using MiDeRadEndo (at 14 ± 1.5 bar) (n = 6 pigs) or oral dosing of tablets with a chemical enhancer formulation to dog stomach (n = 8 dogs). Data are normalized by dose and body weight. d, Serum concentration of siRNA (20.4 mg in 120 µl) delivered to pig small intestine using MiDeAxEndo at 9.5 bar (n = 7 pigs) and subcutaneous control (SC; n = 4 pigs). e, Insulin bioavailability for each MiDe device. n represents number of animals. c.v., coefficient of variation. f, Section diagram of the autonomous intestinal device, MiDeRadAuto. g, Plasma concentration of insulin analogue from in vivo deployments (0.21 mg in 200 µl) with MiDeRadAuto (inserted into pig jejunum under anaesthesia, and activated and injected in fully awake animals 60 to 90 min post insertion). Results shown for device deployments (n = 7 pigs), subcutaneous controls (n = 6 pigs) and negative controls (NC; an intraluminal injection to the small intestine; n = 8 pigs). h, X-ray images from in vivo deployment of MiDeRadAuto in pigs. i, Section diagram of the autonomous gastric device, MiDeAxAuto. j, Plasma concentration of human insulin from in vivo deployments (0.25 U kg−1 in 80 µl) with MiDeAxAuto in pigs. Results shown for device deployments, subcutaneous controls, intragastric controls (IG) and negative controls (n = 3 pigs per group). k, Endoscopic image from in vivo deployment of MiDeAxAuto in pigs. Data in ad,g,j are mean ± s.d.
Extended Data Fig. 1
Extended Data Fig. 1. Setup for jetting performance study and physical characterisation of jet dynamics.
a, Diagram of an ideal jetting system. b, Diagram of our test-stand for the jetting mechanistic study. When the clamp is released, the hand-held jetting device can be removed so that the ampule can be refilled. c, Jetting impingement force vs. time profiles for four different ampule pressures (10.6 Bar, 14.1 Bar, 17.7 Bar and 21.2 Bar; n = 3 technical replicates per ampule pressure). For all experiments shown in this figure we used our pressure-regulated jetting test stand, a nozzle with an orifice diameter of 257 µm and deionized water (ρ = 1000 kg·m−3, ν = 1 cP) as the working fluid. d, Measured jetting period for each of the four ampule pressures. The columns represent experimental performance, while the dashed line represents theoretical performance per equation (E2) (see Supplementary Methods 1). e, Measured steady-state delivery force for the four ampule pressures. The theoretical curve was calculated using equation (E3). f, Measured delivery power for each of the four ampule pressures determined by inputting each of the force measurements into equation (E4). The theoretical curve was calculated using equation (E5). g, Experimental pressure factor from each of the four ampule pressures, calculated by inputting force measurements and corresponding theoretical values into equation (E8) (see Supplementary Methods 3). In (d-g), individual values are shown as black dots.
Extended Data Fig. 2
Extended Data Fig. 2. Summary of results for jetting performance study.
a, Summary of jetting period values as determined by calculating the elapsed time between the beginning and end of the jetting event. b, Summary of steady-state forces as measured directly by the force transducer. c, Summary of steady-state flow rate calculated from the force using the Bernoulli energy balance (Supplementary Methods 1). d, Summary of peak jetting forces as measured directly by the force transducer. e, Summary of percentage force overshoot values as calculated by equation (E6) (see Supplementary Methods 3). These values were used to generate the linear regressions in Supplementary Fig. 2 and Supplementary Table 2. f, Summary of steady-state power values as calculated by Equation E7. g, Summary of pressure factor values as calculated by Equation E8. These values were used to generate the linear regressions in Supplementary Fig. 1 and Supplementary Table 1. In (a-g), each different shade of the horisontal columns represents a certain nozzle diameter ranging from 167 µm (darkest) to 551 µm (lightest). Data are mean (reflected by the column length and written next to each column) and individual values (black dots) (n = 3 technical replicates). The pressure labels on each horisontal column in (a) are valid for columns in the same position in (b-g). h, Results from our evaluation of jetting performance at varying working-fluid viscosities with dj = 257 µm nozzle and pin = 14.1 Bar. Viscosity was varied by changing concentration of dissolved glycerol. The initial data point shows the performance of deionized water (DIW). The dotted line indicates ideal jetting performance. Data are mean (diamonds), 95% confidence intervals (error bars) and individual values (black dots) (n = 3 technical replicates). i, Comparison of output jetting forces at each of three ampule pressures between DIW and the contrast agent we used in subsequent ex vivo work (dj = 257 µm). j, Comparison of corresponding pressure factors at each of the three ampule pressures between DIW and the contrast agent (dj = 257 µm). In (i-j), data are mean and individual values (black dots) (n = 3 technical replicates).
Extended Data Fig. 3
Extended Data Fig. 3. Ex vivo tissue testing, procedure for segmenting scanned volumes and ex vivo characterisation.
a, First, the tissue is placed on a block of foam in a petri dish filled with buffer solution. Next, the hand-held jetting device is positioned above the sample with an adjustable linkage, and the device is triggered. In between trials, the jetting device is removed so that its ampule can be refilled with the payload fluid (a mixture of a iodine-based contrast agent and green tissue-staining dye). After injection, the tissue is transported to an imaging facility where it is scanned with a micro-CT machine. After scanning, the tissue is stored in formalin and sent to the histology facility while the 3D data from each micro-CT scan are then segmented (see f). b, Bulk sections of rectal tissue approximately 15 cm in length. c, The hand-held jetting device clamped to the linkage and positioned above a tissue sample. d, Close-up of the ampule positioned above a sample with the standoff collar fixture attached. e, Rectal tissue samples in histology storage cassettes after injection. f, During the procedure for segmenting scanned volumes, firstly, the micro-CT scan is reconstructed so that 2D slices can be extracted. Then, a starting plane is selected and 2D polygons are drawn to create segmented regions of interest (ROIs). Each 2D slice is then checked and, if necessary, the original ROIs are adjusted to maintain the desired segmentation. Finally, 2D ROIs on all slices are connected to create 3D ROIs so that all relevant voxels can be segmented into luminal, submucosal and intraperitoneal categories. g, Linear regression of volumetric diffusion of contrast agent in tissue after injection. Individual data points are shown as black dots (n = 4 tissue sections from the same animal for each 10 and 20 min delay). The solid line represents the regression line with the intercept set at 0, 0 and the shaded region represents the 95% confidence interval for the slope. h, Impact of standoff on VDE. The experimental replicates are referenced with respect to the mean of the control replicates at 0 mm standoff (n = 6 tissue samples for 0 and 5 mm standoff and n = 8 tissue samples for 2.5 mm standoff, all from the same animal). i, Impact of angle of incidence on VDE. The experimental replicates are referenced with respect to the mean of the control replicates at 0 degrees (n = 4 tissue samples per angle of incidence, all from the same animal). In (g-i), all replicates were taken at dj = 257 µm and pin′ = 11.6 ± 0.7 Bar. In (h-i), individual replicates are shown as black dots and means as horisontal lines.
Extended Data Fig. 4
Extended Data Fig. 4. Organ comparison study results.
a, Each sub-plot in this figure corresponds to one of thirteen corrected ampule pressures marked at the bottom. The corrected ampule pressure interval between each sub-plot is not constant. The upper, middle and lower sections of each sub-plot represent the luminal, submucosal and intraperitoneal tissue region, respectively. Each coloured bar has a length corresponding to 100% of the expelled volume and its position on the vertical axis represents the distribution of expelled volume between the tissue regions at the respective ampule pressure. Error bars represent 95% confidence intervals for the position of the coloured bars. As an example, for the colon tissue bar (brown) in the second sub-plot, approximately 75% of the volume is in the lumen and 25% within the submucosal tissue (and this distribution is between approximately 100%/0% and 45%/55% with 95% confidence). Likewise, for the oesophagus tissue bar (dark blue) in the last sub-plot, approximately 45% of the volume is within the submucosal tissue and 55% in the peritoneum (and this distribution is between approximately 90%/10% and 0%/100% with 95% confidence). All experiments shown in this figure were performed with contrast agent at dj = 257 µm. Number of replicates (tissue samples): n = 2 for oesophagus (28.6 Bar) and rectum (8.8 and 42.2 Bar), n = 6 for oesophagus (48.9 Bar) and stomach (48.9 and 55.4 Bar), n = 8 for stomach (35.5 and 42.2 Bar) and n = 4 for all other organs and ampule pressures. Colon and oesophagus samples originate from one animal, intestine samples from four animals, rectum and cheek samples from two animals, and stomach (antrum/lower corpus) samples from five animals. Exact VDE and uncertainty values, along with qualitative notes can be found in Supplementary Table 3. b-e, Micro-CT scans of a top-, side- and 3D-view of two different shots from the same set of injections. The input parameters and VDE of the set are detailed in the title of each panel. Submucosal depots in jejunal and stomach tissue are shown in (b) and (c), respectively. In these shots, most of the fluid is inside of the tissue. Intraperitoneal shots in jejunal and stomach tissue are shown in (d) and (e), respectively. In these shots, most of the fluid is in the foam beneath the tissue with a small depot visible in the tissue.
Extended Data Fig. 5
Extended Data Fig. 5. Histology from organ comparison study.
Each row shows a histological section of an exemplary injection (shot) in each tissue type from the organ comparison study. A control section for each tissue type (without any injection) is also shown for reference. The tables on the left provide details about the set of injections from which each section was taken. For example, the first table indicates that the adjacent histological section was taken from one of four injections in cheek tissue with dj = 257 µm and pin′ = 35.5 ± 2.2 Bar, the VDE of this set of injections was 17 ± 18% and the typical depth of penetration for this set of injections was submucosal.
Extended Data Fig. 6
Extended Data Fig. 6. Section diagrams of axial and radial endoscopic MiDes together with assembly steps of the radial autonomous MiDe.
a, System description of the axial endoscopic MiDe (MiDeAxEndo) including a section diagram. b, Section diagram of the radial endoscopic MiDe (MiDeRadEndo). Proximity bag not shown. c, Exploded view of MiDeRadAuto with parts labeled (pre-assembly). d, Trigger fabrication steps in which the polymer pellet is made by injection molding PVA. e, The filling steps in which the payload fluid is added to the device’s ampule. f, The load setting steps in which the spring is compressed and fixed in place. g, The final assembly step in which the ampule and spring sub-assemblies are joined. h, Views of MiDeRadAuto after the device has been filled (post-assembly).
Extended Data Fig. 7
Extended Data Fig. 7. Assembly of axial autonomous device for gastric delivery (MiDeAxAuto).
a, Exploded view of MiDeAxAuto with parts labeled (pre-assembly). b, Trigger fabrication steps in which the sugar plug is potted in the setscrew. c, The filling steps in which the payload fluid is added to the device. d, The pressurisation steps in which dry ice is added to the device and the top is joined to the bottom. e, Views of MiDeAxAuto after the device has been filled and pressurised (post-assembly).
Extended Data Fig. 8
Extended Data Fig. 8. Testing of proof-of-concept jetting devices with force transducer.
a, Test setup for MiDeRadAuto-X in which the device is fixed above the force transducer and triggered by manual removal of a steel rod. b, Resulting force profiles from a single MiDeRadAuto (n = 4 technical replicates). c, Test setup for MiDeAxAuto in which the device is placed on a film over the force transducer and triggered with a droplet of water. d-f, Resulting force profiles from three different MiDeAxAutos (n = 2, n = 2 and n = 3 technical replicates, respectively). Only MiDeAxAuto-A3 and MiDeAxAuto-A4 were used in in vivo experiments. In (b) and (d-f), dashed horisontal lines are estimates of thresholds for VDE performance based on linear interpolation of previous ex vivo data.
Extended Data Fig. 9
Extended Data Fig. 9. Design and testing of gastric device.
a, Our sugar-plug and burst-membrane based triggering mechanism. The steps involved in triggering are as follows: (I) The device is placed in a solvent, (II) The solvent begins to dissolve, (III) As the dissolution nears completion, the burst-membrane becomes unsupported and begins to deflect, (IV) When the sugar is completely dissolved, the burst membrane ruptures, releasing the jet. b, Setup for imaging the triggering event in which the device is placed on a film with a hole over a beaker, then triggered with a droplet of water. Further details are provided in Supplementary Methods 9. c, Qualitative results from the triggering tests showing proportion of successes to the two observed failure modes. d, Mass loss vs. time for five different MiDeAxAuto devices. e, Gas leakage rate for five different MiDeAxAuto devices. Data are mean±95% confidence intervals as calculated with linear regression and intercept set at 0, 0. Further details are provided in Supplementary Methods 10.
Extended Data Fig. 10
Extended Data Fig. 10. Passage, inflammation and gastric transit.
a, Endoscopic image of three MiDeAxAuto dummies in the stomach on day zero of the study. b-f, X-ray images of the right flank of the pig showing the progress of device passage from day 0 to day 25. Further details are provided in Supplementary Methods 12. g, Sections from the in vivo inflammation study employing gastric devices. No major reactions were observed (though one minor acute inflammatory focus was located in the submucosa of Set A, Slice 1). Further details are provided in Supplementary Methods 13. h-i, Jet penetration wounds from ex vivo studies (for comparison). j, Example X-ray images (dog 2) following co-administration of scaled-MiDeRadAuto devices (to a 00-el capsule size) and apple juice (pH 3.3) and a contrast agent in a Beagle dog model. Apple juice was used to ensure a human-like acidic pH environment in the stomach, and an enteric capsule was placed over the activation module of the device. X-ray imaging was performed at 15 min intervals to assess the device location and activation time. k, All six devices transited the stomach within 2 h and activated between 60 and 75 min. Four of six devices activated in the small intestine (as desired), and four of six devices were passed by the dog in 24 h. Further details are provided in Supplementary Methods 11.

References

    1. Smeets, F. G. M. et al. Endoscopic botulinum toxin for gastroparesis: results of a retrospective series. Gastrointest. Disord.1, 164–175 (2019).
    1. Santucci, N. R. et al. Outcomes of combined pyloric botulinum toxin injection and balloon dilation in dyspepsia with and without delayed gastric emptying. Saudi J. Gastroenterol.28, 268–275 (2022). - PMC - PubMed
    1. Nelson, D. B. et al. ASGE technology status evaluation report. Injection needles. February 1999. Gastrointest. Endosc.50, 928–931 (1999). - PubMed
    1. Abramson, A. et al. An ingestible self-orienting system for oral delivery of macromolecules. Science363, 611–615 (2019). - PMC - PubMed
    1. Abramson, A. et al. A luminal unfolding microneedle injector for oral delivery of macromolecules. Nat. Med.25, 1512–1518 (2019). - PMC - PubMed

LinkOut - more resources