. 2024 Dec;636(8041):143-150.
doi: 10.1038/s41586-024-08204-3. Epub 2024 Nov 20.

Exaptation of ancestral cell-identity networks enables C4 photosynthesis

Affiliations

Exaptation of ancestral cell-identity networks enables C4 photosynthesis

Joseph Swift et al. Nature. 2024 Dec.

Abstract

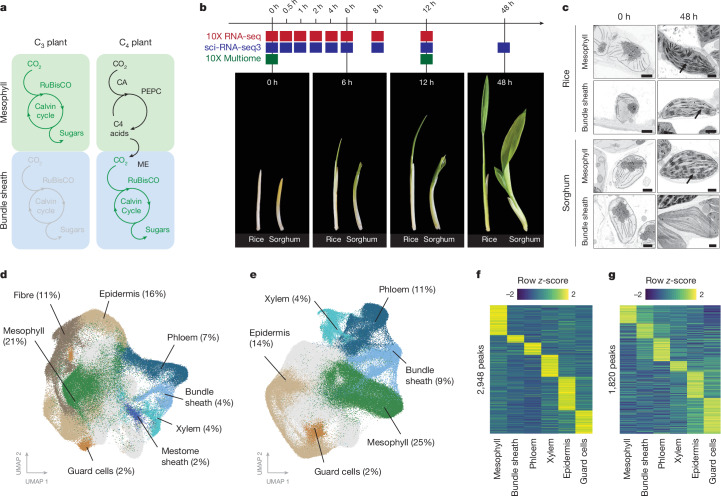
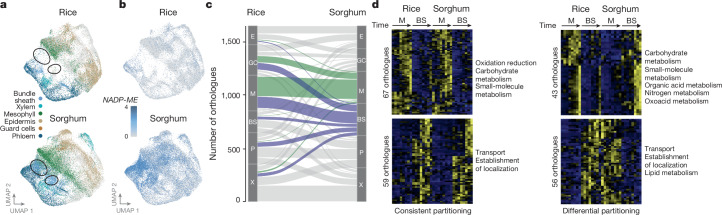
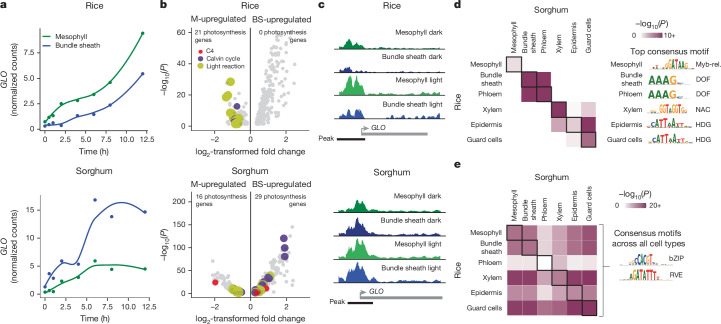
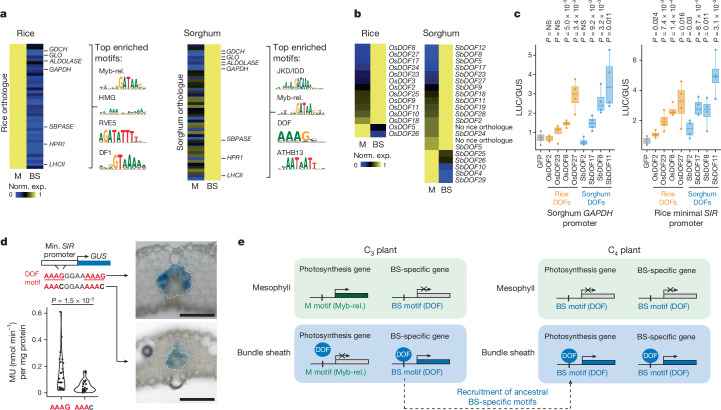
C4 photosynthesis is used by the most productive plants on the planet, and compared with the ancestral C3 pathway, it confers a 50% increase in efficiency1. In more than 60 C4 lineages, CO2 fixation is compartmentalized between tissues, and bundle-sheath cells become photosynthetically activated2. How the bundle sheath acquires this alternate identity that allows efficient photosynthesis is unclear. Here we show that changes to bundle-sheath gene expression in C4 leaves are associated with the gain of a pre-existing cis-code found in the C3 leaf. From single-nucleus gene-expression and chromatin-accessibility atlases, we uncover DNA binding with one finger (DOF) motifs that define bundle-sheath identity in the major crops C3 rice and C4 sorghum. Photosynthesis genes that are rewired to be strongly expressed in the bundle-sheath cells of C4 sorghum acquire cis-elements that are recognized by DOFs. Our findings are consistent with a simple model in which C4 photosynthesis is based on the recruitment of an ancestral cis-code associated with bundle-sheath identity. Gain of such elements harnessed a stable patterning of transcription factors between cell types that are found in both C3 and C4 leaves to activate photosynthesis in the bundle sheath. Our findings provide molecular insights into the evolution of the complex C4 pathway, and might also guide the rational engineering of C4 photosynthesis in C3 crops to improve crop productivity and resilience3,4.


Conflict of interest statement

Competing interests: The authors declare no competing interests.

Figures

Fig. 1
Fig. 1. Gene expression and chromatin accessibility of single nuclei from rice and sorghum undergoing de-etiolation.
a, Photosynthesis in mesophyll and bundle-sheath cells of C3 and C4 plants. CA, carbonic anhydrase; ME, malic enzyme; PEPC, phosphoenolpyruvate carboxylase. b, Schematic of de-etiolation time course. Plants were grown in the dark for 5 days (0-h time point) before exposure to light. c, Scanning electron micrographs (SEMs) of etioplasts and chloroplasts in the mesophyll and bundle-sheath cells of rice and sorghum. Thylakoid stacks (black arrows) were present in rice mesophyll and bundle-sheath chloroplasts as well as sorghum mesophyll chloroplasts (SEMs consistent across three biological replicates). Scale bars, 1 μm. d,e, UMAP of transcript profiles of rice (d) and sorghum (e) nuclei from all time points assayed. Distinct colours indicate different cell types. f,g, In total, 2,948 accessible chromatin peaks were cell-type specific in rice promoters (f), and 1,820 peaks were cell-type specific in sorghum promoters (g).
Fig. 2
Fig. 2. Rice and sorghum bundle-sheath cells show low conservation in transcript partitioning.
a, Pan-transcriptome of rice and sorghum nuclei based on orthologues. UMAPs indicate rice (top) and sorghum (bottom) nuclei. Areas indicated with black circles indicate nuclei from the sorghum bundle sheath that do not co-cluster with rice nuclei. b, Transcript abundance for sorghum NADP-ME and its rice orthologue displayed in UMAP format from a. c, Sankey plot of changes in the cell-type partitioning of marker genes. Markers for sorghum mesophyll and bundle-sheath cell types are highlighted in green and blue, respectively. BS, bundle sheath; E, epidermis; GC, guard cell; M, mesophyll; P, phloem; X, xylem. d, Differentially expressed orthologue pairs in rice and sorghum mesophyll and bundle-sheath cells. Genes fall into two categories: those consistently partitioned (more highly expressed in the same cell type in both rice and sorghum); and those differentially partitioned (swapping expression from one cell type to the other). GO terms associated with each category are shown on the right.
Fig. 3
Fig. 3. Light changes cell-type-specific transcript abundance and chromatin accessibility.
a, Sub-clustering of rice mesophyll nuclei undergoing de-etiolation. The transcript abundance of RBCS1A is shown on the right. b, Sub-clustering of sorghum bundle-sheath nuclei undergoing de-etiolation. The transcript abundance of NADP-ME is shown on the right. c,d, Heat map of photosynthesis gene expression in different cell types of rice (c) and sorghum (d) during the first 12 h of light. Genes encoding proteins involved in C4 photosynthesis, the Calvin–Benson–Bassham cycle and light reactions are shown in red, purple and yellow, respectively. e,f, Differences in the chromatin accessibility of photosynthesis genes in different cell types of rice (e) and sorghum (f) measured at 0 h (dark) and 12 h (light). Welch’s t-test indicated.
Fig. 4
Fig. 4. Both cell identity and light drive the partitioning of photosynthesis genes between mesophyll and bundle-sheath cells.
a, Transcript abundance of the photorespiration gene GLO during de-etiolation in the mesophyll and bundle-sheath cells of rice and sorghum. Points indicate mean expression, line fit using locally estimated scatter plot smoothing. b, Volcano plots of genes significantly partitioned to either mesophyll (M) or bundle sheath (BS) under etiolated conditions (0-h time point, adjusted P < 0.05, likelihood-ratio test). Genes encoding proteins involved in C4 photosynthesis, the Calvin–Benson–Bassham cycle and light reactions are shown in red, purple and yellow, respectively. c, Chromatin accessibility of GLO at 0 h (dark) and 12 h (light) in mesophyll and bundle-sheath nuclei. d, Overlap of cis-elements associated with accessible chromatin in each cell type of rice and sorghum (Fisher’s exact test adjusted P indicated). The consensus motif for the most over-represented cis-element within each overlap is shown on the right (additional over-represented motifs in Supplementary Table 10). e, Overlap of cis-elements associated with accessible chromatin in each cell type in response to light in rice and sorghum (Fisher’s exact test adjusted P indicated). The consensus motif for the most over-represented cis-element in all overlaps is shown on the right (additional over-represented motifs in Supplementary Table 12).
Fig. 5
Fig. 5. A cell-type-specific cistrome in C3 rice and C4 sorghum drives the partitioning of photosynthesis between mesophyll and bundle-sheath cells.
a, Gene-expression heat maps (left) of differentially partitioned orthologues in rice and sorghum, and the four most enriched cis-elements (right) in the accessible chromatin of corresponding genes. Additional over-represented motifs are shown in Supplementary Table 13. b, DOF transcription factor expression in mesophyll and bundle sheath in each species. Sorghum gene names based on orthology with rice genes. c, Transactivation of sorghum GAPDH promoter and rice minimal SIR promoter by DOF transcription factors from rice (orange) and sorghum (blue) (one-sided Welch’s t-test P indicated; n = 4 biological replicates; boxes indicate 25th, median and 75th quartiles; whiskers extend to the outermost value within 1.5× interquartile range; assay repeated three times independently with similar results). d, Activity of GUS reporter driven by minimal SIR promoter (containing two DOF motifs) in transgenic rice determined using the fluorometric 4-methylumbelliferyl-β-d-glucuronide assay (left). DOF motifs were mutated to replace G in AAAG with C (one-sided Welch’s t-test P indicated; n = 29 independent transformants for minimal SIR promoter; n = 23 independent transformants for mutated DOF motifs). Representative cross-sections of GUS-stained transgenic leaves are shown on the right. Bundle-sheath cells are outlined with a dotted line. Scale bars, 50 µm. e, By acquiring DOF cis-elements, C4 genes co-opt and amplify the ancestral bundle-sheath cell-identity network that is common between both species.
Extended Data Fig. 1
Extended Data Fig. 1. Single-nucleus sequencing of rice and sorghum shoots during de-etiolation.
a, Summary of 10X Genomics platform used for RNA and ATAC-sequencing of single nuclei extracted from a population of plants (adapted from Zheng et al.), and sci-RNA-seq3 used for sequencing single nuclei from individual plants to provide increased biological replication. b, Scanning electron micrographs (SEMs) of etioplasts and chloroplasts of rice and sorghum mesophyll and bundle-sheath cells after 0 h, 6 h, 12 h and 48 h of light exposure (SEMs consistent across 3 biological replicates). c, SEMs of rice and sorghum leaf cross-sections showing leaf maturation from 0 h to 48 h after light exposure. (SEMs consistent across 3 biological replicates). d, Total chlorophyll (chlorophyll a + chlorophyll b) measured at different time points during de-etiolation in rice and sorghum. Each data point represents the mean of 3 biological replicates, +/− standard deviation from the mean. The experiment was repeated 3 times independently with similar results.
Extended Data Fig. 2
Extended Data Fig. 2. Single-nucleus atlases for gene expression in rice and sorghum shoots during de-etiolation.
a,b, UMAP of transcript profiles from single nuclei across rice (a) and sorghum (b), across all time points tested. c,d, Each cluster in rice (c) and sorghum (d) contained nuclei sequenced either by 10X or by sci-RNA-seq3 methods. e,f, Similarly, each cluster in rice (e) and sorghum (f) contained nuclei sequenced from each time point assayed. g,h, Transcript abundance from marker genes in cell types of rice (g) and sorghum (h).
Extended Data Fig. 3
Extended Data Fig. 3. Bundle-sheath transgenic marker line identifies the bundle-sheath cluster in the rice transcriptional atlas.
a, Confocal laser scanning microscopy image of a rice bundle-sheath marker line expressing nuclear-localized mTurquoise2 driven by the bundle-sheath-specific ZjPCK promoter. Fluorescent signal from chlorophyll is indicated in magenta. The outline of bundle-sheath cells is indicated with a dotted line (scale = 20 µm). Similar expression patterns were observed for mTurquoise2 across 3 independent transgenic lines. b, Clustered single nuclei transcript profiles from the rice line expressing mTurquoise2 driven by the bundle-sheath-specific ZjPCK promoter. c, mTurquoise2 expression in the transgenic line. d, Cluster of the rice transcriptional atlas (de-etiolation data). e, Per cent overlap of top cluster markers shared between the bundle-sheath transgenic line (c) and the rice transcriptional atlas (d).
Extended Data Fig. 4
Extended Data Fig. 4. Identifying cell types in rice and sorghum 10X Multiome (RNA + ATAC) datasets.
a,b, UMAP clustering of 22,154 rice nuclei (a) and 20,169 sorghum nuclei (b) sequenced using the 10X Multiome workflow. c,d, Cell transcriptional identities assigned to each cluster in rice (c) and sorghum (d). e, Accessibility for the promoter of OsRBCS4 in each rice cell type. f, Accessibility of promoter region for NADP-ME in each sorghum cell type. g,h, Overlap of significant marker genes from cell-types identified within the 10X Multiome dataset with those identified within the transcriptome atlas’ dataset for rice (g) and sorghum (h).
Extended Data Fig. 5
Extended Data Fig. 5. Comparison of transcriptional cell identities in rice and sorghum shoots.
a,b, UMAP clustering visualizing the single nuclei pan-transcriptomes of rice (a) and sorghum (b) nuclei 48 h after light exposure. c, Fold enrichment of cluster membership found in sorghum relative to that of rice. d, Heat map of transcript abundance for bundle-sheath marker genes in rice and sorghum in each cell type 48 h after exposure to light. e, Overlap of cell type specific marker genes of rice and sorghum, significance of overlap indicated (log-normalized Fisher’s exact test adjusted P indicated). f, Differentially expressed orthologous gene pairs within mesophyll and bundle-sheath cells of rice and sorghum. Genes fall into two categories, those consistently partitioned (more highly expressed in the same cell type in both rice and sorghum), and those that are differentially partitioned (swap expression from one cell type to the other). Overall, 152 orthogroups were identified, for which the frequency of higher-order orthology relationships (>1:1 orthology) are indicated.
Extended Data Fig. 6
Extended Data Fig. 6. Quantifying instances of consistent and differential partitioning across all cell-type pairs.
a, Overlap of orthologous genes found partitioned between mesophyll and bundle-sheath cell types in rice and sorghum. b, Quantifying the overlap of orthologous genes partitioned between each possible cell type pair in rice and sorghum. c, Percentage of partitioned genes in b that are either differentially or consistently partitioned.
Extended Data Fig. 7
Extended Data Fig. 7. Light induces changes in cell-type-specific transcript abundance.
a,b, Activation of transcript abundance of light-responsive genes during the first 12 h of light exposure. Each panel shows z-score normalized gene-expression trends unique to each cell type for rice (a) and sorghum (b). c,d, Repression of transcript abundance from light-responsive genes in the first 12 h of exposure to light. Each cluster shows patterns of gene-expression induction unique to each cell type for rice (c) and sorghum (d). e,f, HY5, PIF, GLK1 (GOLDEN2-LIKE1), GLK2 and GNC (GATA NITRATE-INDUCOBLE CARBON-METABOLISM-INVOLVED) expression in rice (e) and sorghum (f) during the first 12 h of light exposure across six cell types.
Extended Data Fig. 8
Extended Data Fig. 8. Scanning electron micrographs of etioplasts and chloroplasts at 0 h and 12 h after exposure to light in different cell types of rice and sorghum shoots.
Etioplasts are indicated with a red arrowhead. ‘S’ indicates starch granules. Unlike rice, sorghum does not have a mestome sheath. SEMs were consistent across 3 biological replicates.
Extended Data Fig. 9
Extended Data Fig. 9. Both light exposure and transcriptional cell identity partition photosynthesis gene expression.
a, Transcript abundance of RBCS2 in rice and RBCS1A in sorghum during de-etiolation in mesophyll and bundle-sheath cells of rice and sorghum. b, Volcano plots of genes significantly partitioned to either mesophyll or bundle-sheath cell types under light conditions (12-h time point, adjusted p < 0.05, likelihood-ratio test). c, Differences in fold change gene expression in rice or sorghum genes in the etiolated state (t = 0) vs their expression after 12 h of light exposure between mesophyll and bundle sheath. d, Chromatin accessibility in the mesophyll and bundle-sheath promoters of RBCS2 in rice and RBCS1A in sorghum under etiolated and light conditions. e, Chromatin-accessibility differences adjacent (+−2,000 bp) to photosynthesis genes at 0 h (dark) and 12 h (light) after light exposure. Genes encoding proteins involved in C4 photosynthesis, the Calvin–Benson–Bassham cycle and the light reactions are shown in red, purple, and yellow, respectively.
Extended Data Fig. 10
Extended Data Fig. 10. Discovering conserved cell-type-specific cis-elements across species.
a,b, 10X Multiome UMAPs of rice (a) and sorghum (b). c,d, Dof3 motif prevalence within accessible chromatin is restricted to bundle-sheath and phloem clusters in rice (c) and sorghum (d). e, For each species, the top 25 most significantly enriched motifs within the bundle sheath were overlapped, and clustered using TOBIAS. A threshold of 0.4 was used to find consensus motifs (indicated on left). f, Number and log-normalized adjusted p-values of enriched cis-elements in rice (Oryza sativa) and sorghum (Sorghum bicolor) within genes that are consistently partitioned to the bundle-sheath cell type in both species (Rank sum test). In addition, enriched cis-elements in homologues of bundle-sheath-specific rice genes in the C3 grasses Chasmanthium laxum, Hordeum vulgare, and Brachypodium distachyon are indicated.
Extended Data Fig. 11
Extended Data Fig. 11. Discovering conserved light-responsive cis-elements across species.
a,b, 10X Multiome UMAPs of rice (a) and sorghum (b). cf, RVE5 motif prevalence within accessible chromatin under etiolated conditions in rice (c) and sorghum (d), and light conditions in rice (e) and sorghum (f). g, For each species, the top 25 most significantly enriched motifs were overlapped, and clustered using TOBIAS. A threshold of 0.4 was used to find consensus motifs.
Extended Data Fig. 12
Extended Data Fig. 12. Discovering cis-elements underlying differentially partitioned genes.
a, Gene-expression heat maps of differentially partitioned genes in rice and sorghum 10X Multiome data. b, Accessible chromatin associated with these expression patterns. c, Enriched motifs among accessible chromatin, clustered using TOBIAS to find consensus motifs (indicated on left). d, Number of DOF motifs within accessible chromatin of differentially partitioned orthologues, two-sided binomial p indicated. e, Number of DOF motifs within accessible chromatin of consistently bundle-sheath partitioned orthologues, two-sided binomial p indicated. f, Chromatin accessibility in mesophyll (green) and bundle sheath (blue) for GAPDH. Sequences within accessible chromatin were analysed for DOF motifs. g, Chromatin accessibility in mesophyll (green) and bundle sheath (blue) for NADP-ME. DOF motifs shown in red. h, Transactivation of sorghum NADP-ME promoter by DOF transcription factors from rice (orange) and sorghum (blue; one-sided Welch’s t-test p indicated, n = 4 biological replicates, boxes indicate 25th, median and 75th quartiles, whiskers extend to the outermost value within 1.5× of interquartile range, assay repeated 3 times independently with similar results).

References

    1. Ghannoum, O., Evans, J. R. & von Caemmerer, S. in C4 Photosynthesis and Related CO2Concentrating Mechanisms (eds Raghavendra, A. & Sage, R.) 129–146 (Springer, 2011).
    1. Sage, R. F., Christin, P. A. & Edwards, E. J. The C4 plant lineages of planet Earth. J. Exp. Bot.62, 3155–3169 (2011). - PubMed
    1. Ermakova, M., Danila, F. R., Furbank, R. T. & Von Caemmerer, S. On the road to C4 rice: advances and perspectives. Plant J.101, 940–950 (2020). - PMC - PubMed
    1. Hibberd, J. M., Sheehy, J. E. & Langdale, J. A. Using C4 photosynthesis to increase the yield of rice-rationale and feasibility. Curr. Opin. Plant Biol.11, 228–231 (2008). - PubMed
    1. Sage, R. F. The evolution of C4 photosynthesis. New Phytol.161, 341–370 (2004). - PubMed

MeSH terms

LinkOut - more resources