. 2024 Dec;636(8041):182-189.
doi: 10.1038/s41586-024-08220-3. Epub 2024 Nov 20.

Broadly inhibitory antibodies to severe malaria virulence proteins

Affiliations

Broadly inhibitory antibodies to severe malaria virulence proteins

Raphael A Reyes et al. Nature. 2024 Dec.

Abstract

Malaria pathology is driven by the accumulation of Plasmodium falciparum-infected erythrocytes in microvessels1. This process is mediated by the polymorphic erythrocyte membrane protein 1 (PfEMP1) adhesion proteins of the parasite. A subset of PfEMP1 variants that bind to human endothelial protein C receptor (EPCR) through their CIDRα1 domains is responsible for severe malaria pathogenesis2. A longstanding question is whether individual antibodies can recognize the large repertoire of circulating PfEMP1 variants. Here we describe two broadly reactive and inhibitory human monoclonal antibodies to CIDRα1. The antibodies isolated from two different individuals exhibited similar and consistent EPCR-binding inhibition of diverse CIDRα1 domains, representing five of the six subclasses of CIDRα1. Both antibodies inhibited EPCR binding of both recombinant full-length and native PfEMP1 proteins, as well as parasite sequestration in bioengineered 3D human brain microvessels under physiologically relevant flow conditions. Structural analyses of the two antibodies in complex with three different CIDRα1 antigen variants reveal similar binding mechanisms that depend on interactions with three highly conserved amino acid residues of the EPCR-binding site in CIDRα1. These broadly reactive antibodies are likely to represent a common mechanism of acquired immunity to severe malaria and offer novel insights for the design of a vaccine or treatment targeting severe malaria.


Conflict of interest statement

Competing interests: The authors declare no competing interests.

Figures

Extended Data Fig. 1 |
Extended Data Fig. 1 |. Flow cytometry gating and mAb sequence analysis.
a) Gating strategy used for sorting antigen-specific B cells. B cells were identified by CD19 expression. Cells were negatively selected for IgG expression by excluding IgM or IgA positive B cells. Cells bound to the decoy tetramer were considered nonspecific and excluded from further analysis. B cells bound to CIDRα1.1 or CIDRα1.4 tetramers were sorted for mAb cloning. b) Sequence characteristics of anti-CIDRα1 monoclonal antibodies. c) Gating strategy used to evaluate binding of mAbs C7 and C74 to native CIDRα1 expressed on P. falciparum-infected erythrocytes. Gating on single erythrocytes is shown left. On the right, flow cytometry data show antibody (AF488) staining of erythrocytes infected with HB3 and IT4 parasites expressing either CIDRα1.1 PfEMP1 (IT4VAR19), CIDRα1.4 PfEMP1 (HB3VAR03), or CIDRα1.6 PfEMP1 (IT4VAR18). Infected and uninfected erythrocytes were separated by staining of parasite DNA using Hoechst 33342. For positive controls, IgG from rats immunized with the full ectodomain of HB3VAR03, the CIDRα1.6 domain of IT4VAR18, or the three-domain protein of IT4VAR19 were used. IgG samples from rats immunized with a heterologous PfEMP1 variant were included as negative controls. The percentage of antibody-stained infected erythrocytes is shown on the right. Data from three, seven, and five independent experiments are shown for ITVAR19, HB3VAR03 and IT4VAR18, respectively. Statistical analysis: two-sided Friedman test followed by pairwise comparisons corrected for multiple comparisons using the two-stage linear step-up procedure of Benjamini, Krieger, and Yekutieli (for CIDRα1.1 and CIDRα1.6) or two-sided mixed-effect one-way ANOVA followed by Dunnett’s post-hoc test, corrected for multiple comparisons (for CIDRα1.4, due to missing values), to evaluate differences compared to the negative control. Center line, median; box limits, upper and lower quartiles; whiskers, min/max values; +, mean. VH, heavy chain V-gene; DH, heavy chain D-gene; CDR, complementarity determining region; JH, heavy chain J-gene; VL, light chain V-gene; JL, light chain J-gene; n.a., not available, because the sequence of this variable region was not fully resolved.
Extended Data Fig. 2 |
Extended Data Fig. 2 |. Sequences of CIDRα1 proteins used in this study.
a) Amino acid sequence alignment of the EPCR binding (EB) and EPCR binding supporting (EBS) helices of the recombinant CIDRα1 protein variants used in this study. The full sequences are available from ref. . Indicated with black boxes are the three key contact residues of C7 and C74 that are conserved among all CIDRα14 – 1.8 variants, but divergent in CIDRα1.1 b) Sequence logo of the CIDRα1 variants shown in (a), generated using the online sequence logo generator WebLogo version 3.7.12. The three key contact residues of C7 and C74 that are conserved among all CIDRα14 – 1.8 variants are indicated with asterisks.
Extended Data Fig. 3 |
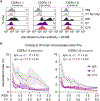
Extended Data Fig. 3 |. Characterization of monoclonal antibodies that inhibit EPCR binding to CIDRα1 variants.
a) Competition between C7 Fab and other monoclonal antibodies (mAbs) for binding to a panel of 24 EPCR-binding CIDRα1 variants. Recombinant IgG was used for all mAbs, except B59, for which we were not able to obtain a full light chain variable region sequence and used B cell supernatant instead. b) Percentage inhibition of CIDRα1 variants binding to EPCR in the precence of mAb C7 and C74, at different concentrations. The averages of four independent experiments are shown. The average concentrations (± standard deviation [SD]) of mAbs C7 and C74 that resulted in 50% inhibition (IC50) are presented below. Data for variants indicated with a star are shown in Figure 1d. c) Overview of the affinity purification of plasma IgG using a CIDRα1.4 (HB3VAR03) 63-amino acid-long peptide spanning the EPCR-binding site (left). The reactivity and inhibitory activity of the affinity-purified IgG against a panel of CIDRα1 variants are shown on the right. n.d., not determined
Extended Data Fig. 4 |
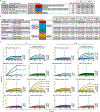
Extended Data Fig. 4 |. Reactivity of mAbs C7 and C74 to PfEMP1 and inhibition of CIDRα1 binding to EPCR.
a) Reactivity of mAbs C7 and C74 to various recombinant PfEMP1 proteins and inhibition of PfEMP1-EPCR binding as determined by ELISA. Positive antibody reactivity: OD > 1.5; negative: OD < 0.1. Inhibition was defined as the percentage reduction in ELISA OD of PfEMP1 protein binding to EPCR following antibody pre-incubation with C7/C74, as compared to a no-antibody control. b) Antibody binding kinetics to PfEMP1 proteins determined using biolayer interferometry. The HB3VAR03 three-domain protein showed binding to both C7 and C74 Fab but no well-fitting model could be applied. c) Representative biolayer interferometry curves used to determine binding affinity to CIDRα1 domains. The raw data are colored and the 1:1 binding model fitted data are shown by black lines. The vertical, dashed lines indicate the change from association to dissociation. Concentration of the analyte is shown next to the curves. For HB3VAR03 three-domain binding, no accurate 1:1 model could be fit as association curves remained linear even out to 1,200 s (not shown). N, N-terminal segment; kon, association rate constant; koff, dissociation rate constant; kD, equilibrium dissociation constant
Extended Data Fig. 5 |
Extended Data Fig. 5 |. C7 and C74 inhibition of P. falciparum-infected erythrocytes binding to EPCR.
a) Binding of P. falciparum-infected erythrocytes expressing CIDRα1.4 PfEMP1 (HB3VAR03) and CIDRα1.6 (IT4VAR18) to recombinant EPCR under static conditions in culture medium, or with C7 or C74 (50 μg/mL / 0.33 μM). Negative control: mAb PAM1.4 targeting the VAR2CSA PfEMP1 (50 μg/mL / 0.33 μM). Positive control: recombinant soluble EPCR (50 μg/mL / 2.1 μM). Data from seven and five independent experiments are shown for HB3VAR03 and IT4VAR18, respectively. Data are normalized to the medium-only condition indexed to 100. Statistical analysis: repeated-measures one-way ANOVA followed by Dunnett’s post-hoc test, corrected for multiple comparisons, to evaluate differences compared to the negative control. Center line, median; box limits, upper and lower quartiles; whiskers, min/max values; +, mean. b) Volumetric reconstruction of a microvessel cross section (120 μm diameter) after immunofluorescence labelling with an anti-human vascular endothelial (VE)-cadherin antibody (magenta) and nuclear staining by DAPI (blue). Parasite nuclei can be identified as smaller, brighter blue foci attached to the endothelial surface. c) Top: estimated wall shear stress simulations in the 13-by-13 grid geometry at 37°C, prior to remodeling pf the collagen matrix by primary human brain microvascular endothelial cells. Bottom: Representative image of a Z-projection of the bottom edge of a 3D microvessel after perfusion with PKH26-labeled HB3VAR03 parasites (green), fixation, and staining with DAPI (blue). d) Percentage of endothelial area occupied by sequestered infected erythrocytes at regions exposed to different wall shear stress rates (WSS, reported in dyn/cm2) and flow velocities (FV, reported in mm/s). Dots indicate the mean values, and the shaded regions show the standard error of the mean from a total of 6 – 12 independent biological replicates for medium only, isotype control IgG1, mAb C7, mAb C74 (all antibodies at 0.25 mg/mL / 1.7 μM), and recombinant soluble EPCR (60 μg/mL / 2.6 μM).
Extended Data Fig. 6 |
Extended Data Fig. 6 |. Structural analysis of CIDRα1.4 PfEMP1 HB3VAR03 three-domain protein.
a) Structure of the HB3VAR03 three-domain protein (PDB: 8C3Y), shown in colored ribbons, fitted into the ~6 Å cryo-EM map of the HB3VAR03 three-domain protein complexed with C7 Fab, shown in white. This analysis showed that C7 Fab binds the EB and EBS helices of the CIDRα1.4 domain. The absence of cryo-EM density for the DBLα domain suggests an induced flexibility in the domain’s position following C7 binding. b) Surface exposure of C7 and C74 contact residues mapped onto the unbound three-domain protein of the CIDRα1.4 PfEMP1 HB3VAR03 (PDB: 8C3Y).
Extended Data Fig. 7 |
Extended Data Fig. 7 |. Single-particle cryo-EM reconstructions and mAb-buried surface area measurements.
a) Cryo-EM reconstructions of C7 Fab: CIDRα1.7 IT4VAR22 three-domain protein (left), C74: CIDRα1.7 IT4VAR22 three domain protein (middle), and C74 Fab: CIDRα1.6 PFD1235w N-terminal domain complex (right). Representative micrographs, representative 2D class averages, final resolved map colored based on local resolution estimation, model fit into the cryo-EM density at the mAb binding interface, and Fourier Shell Correlation (FSC) plot with resolution estimation based on Gold Standard FSC (GSFSC) at 0.143 are shown. b) Comparison of C7 and C74 mAb somatic hypermutations and buried surface area. The buried surface area (BSA) calculated using the online tool PDBePISA is shown against the C7 and C74 heavy and light variable chain sequences (up to and including the end of the CDR3) aligned with their respective germline sequences. CDRs were defined using the Kabat numbering system.
Extended Data Fig. 8 |
Extended Data Fig. 8 |. Molecular analysis of C7 and C74 binding to CIDRα1.
a) Conformation of the EPCR binding (EB) and EPCR binding supporting (EBS) helices of CIDRα1 in the unbound state (white) and upon EPCR (left) and C7 Fab (right) binding, which induces a twist-turn conformational change (in brown and red, respectively). b) Depiction of the angle of approach by C7 and C74 to the axis of the EB and EBS helices of IT4VAR22 CIDRα1.7. c) Biolayer interferometry analysis and comparison of matured C7, C7 with inferred germline heavy chain (iGLH C7) and C7 with inferred germline heavy and light chain (iGLHL) binding to the IT4VAR22 three-domain protein. d) Free energy landscape of the H-CDR3 loop based on molecular dynamics simulations on the antigen-free matured C7 and iGLHL C7 in solution. e) Contacts of C7 H-CDR1 and H-CDR2 with H-CDR3 that contribute to the conformational stability of the C7 H-CDR3 loop. TIC, time independent component
Figure 1:
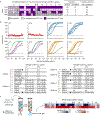
Figure 1:. Isolation of monoclonal antibodies against the PfEMP1 CIDRα1 domain.
a) Schematic representation of CIDRα1-containing multi-domain PfEMP1 proteins with the N-terminal domain complex comprised of the N-terminal segment (NTS), DBLα, and CIDRα1 domain indicated. The EPCR binding site is also shown. b) Overview of the experimental strategy to isolate monoclonal antibodies (mAbs) against CIDRα1 domains. c) Heatmap showing mAb reactivity and inhibition of EPCR binding to a panel of CIDRα1 variants (Luminex assay, single measurement). Controls include bovine serum albumin (BSA) and CD36-binding CIDRα2, CIDRα5, and CIDRα6 variants. d) Titration of mAb C7 and C74 reactivity (left; single measurement) and inhibition (right; average of four biological replicates) of EPCR binding to CIDRα1 variants representative of each of the six CIDRα1 subclasses. e) Average reduction in plasma IgG reactivity to 19 CIDRα1.4 – 1.8 protein variants due to competition with C7 Fab plotted against age for each of 93 individuals (left, with Lowess smoothing curve + 95% confidence interval), and shown as overall averages split by CIDRα1 subclass and age group (right, ± standard deviation), with purple shading indicating 25% intervals. Also shown are results for a CIDRα1.4 affinity purified pool of plasma IgG with broad reactivity (bottom row). The average estimated C7-equivalent (C7-eq) plasma concentrations derived from reactivity differentials within each age group are shown on the right. f) Binding curves of C7 and C74 to single CIDRα1 variants (left) and antibody binding affinity (KD, right) determined by biolayer interferometry. Source data are provided in Supplementary Table 1. MFI, median fluorescence intensity; n.d., not determined
Figure 2:
Figure 2:. C7 and C74 reactivity to and inhibition of P. falciparum-infected erythrocytes.
a) Flow cytometry staining of P. falciparum-infected erythrocytes expressing PfEMP1 variants containing CIDRα1.1 (IT4VAR19), CIDRα1.4 (HB3VAR03), and CIDRα1.6 (IT4VAR18). IgG/plasma from rats immunized with the respective or heterologous PfEMP1 variants were used as positive and negative controls, respectively. Dashed lines indicate the cutoff for positive cells, determined using non-infected erythrocytes in the same sample. Results of one representative experiment out of three, seven, and five experiments for IT4VAR19, HB3VAR03, and IT4VAR18, respectively, are shown. The percentage of positively stained infected erythrocytes is indicated. b) Percentage of endothelial area occupied by sequestered infected erythrocytes at regions exposed to different wall shear stress rates (WSS, reported in dyn/cm2) and flow velocities (FV, reported in mm/s). Dots indicate the mean values and the shaded regions show the standard error of the mean of 6 – 9 independent biological replicates for C7, C74, and the isotype control IgG1 (all at 0.25 mg/mL). Statistical analyses were performed for the area under the curve using a one-way ANOVA, followed by comparisons between IgG1 and C7 or C74 corrected for multiple comparisons using the two-stage linear step-up procedure of Benjamini, Krieger, and Yekutieli. Source data are provided in Supplementary Table 2.
Figure 3:
Figure 3:. Structural analysis of C7 Fab in complex with recombinant PfEMP1.
a) Schematic of the single CIDRα1.4 domain (HB3VAR03). EPCR-binding (EB) and supporting (EBS) helices of the CIDRα1.4 domain are shown in yellow. b) X-ray crystallography structure of the single CIDRα1.4 domain (HB3VAR03) in complex with C7 Fab shown in cartoon representation. c) Overlay of X-ray structure from panel b with the CIDRα1.4 (HB3VAR03):EPCR structure (PDB: 4V3D). EPCR is shown in grey surface representation. d) Schematic of the CIDRα1.7 IT4VAR22 three-domain protein. The domain architecture is shown at the top, with EB and EBS helices of CIDRα1.7 highlighted in red. e) Cryo-EM map of the IT4VAR22 three-domain protein in complex with C7 Fab. f) Superimposition of CIDRα1.4 (HB3VAR03) and CIDRα1.7 (IT4VAR22) domains in complex with C7 Fab. The root mean square deviation (RMSD) for alpha-carbon atoms (Cα) in both structures is shown. g) Molecular interaction of C7 Fab with EB and EBS helices of CIDRα1.7 (IT4VAR22). π-stacking interactions can be seen between CIDRα1.7 residues F661 and F662 and heavy chain residues Y100E, Y100I, and F100J (Kabat numbering scheme). S100G is not indicated but visible in the center right side of the panel.
Figure 4:
Figure 4:. Cryo-EM structure of C74 Fab complexed with recombinant CIDRα1 PfEMP1 variants.
a) Schematic of the IT4VAR22 three-domain protein and PFD1235w N-terminal domain complex. b) Cryo-EM maps of C74 Fab complexed with the multi-domain proteins derived from IT4VAR22 (b) and PFD1235w (c). EPCR binding (EB) and supporting (EBS) helices of CIDRα1.7 and CIDRα1.6 are colored in red and orange, respectively. d) Molecular interaction of C74 Fab with the CIDRα1.7 EB and EBS helices. e) Superimposition of CIDRα1.7 (IT4VAR22) and CIDRα1.6 (PFD1235w) domains in complex with C74 Fab (salmon and light yellow, respectively). The root mean square deviation (RMSD) for alpha-carbon atoms (Cα) in both structures is shown. f) Superimposition of aromatic π-stacking interaction of C7 and C74 with the CIDRα1.7 FF motif (left panel) and superimposition of the Y-S residues of C7 and C74 targeting E671 of IT4VAR22 CIDRα1.7 (right panel). g) Key antigen-contacting aromatic residues of C7 and C74 are shown in their respective H-CDR conformation.
Figure 5:
Figure 5:. Conservation and surface exposure of C7 and C74 epitope residues.
a) CIDRα1 residues contacting C7 and C74 mapped onto the IT4VAR22 CIDRα1.7 domain (circled amino acid residues are mAb specific). b) Sequence logo plot of 885 sequences representing global CIDRα1 sequence variation (from ref. 16), showing amino acid conservation (colored by chemistry) of the EB and EBS helices in CIDRα1.4 – 1.8 and CIDRα1.1 (numbered relative to the IT4VAR22 sequence). c) ELISA reactivity of recombinant EPCR, C7, C74, and CIDRα1.4-affinity-purified plasma IgG to mutated CIDRα1.4, CIDRα1.5, CIDRα1.8, and CIDRα1.1 domains. For CIDRα1.4, 1.5, and 1.8: all data indexed to wildtype (WT) = 1. For CIDRα1.1, EPCR binding indexed to WT = 1, C7/C74 binding indexed to FF/EA mutant = 1. For CIDRα1.4-affinity-purified IgG, data represent raw OD values. Results are the average of at least two independent experiments. Source data are provided in Supplementary Table 3.
Figure 6:
Figure 6:. Analysis of C7 germline mAbs.
a) Depiction of inferred germline antibody designs, showing mAb C7 (top), C7 containing an inferred germline heavy chain variable region (iGLH, middle), and C7 containing inferred heavy and light chain variable regions (iGLHL, bottom). b) Reactivity of C7, iGLH C7 and iGLHL C7 across a panel of recombinant CIDRα1 protein domains and negative controls (CD36-binding CIDRα2 and 5 domains). c) All-atom molecular dynamics simulation of the antigen-bound structure of C7, iGLH C7 and iGLHL C7 with the number of distinct structural clusters indicated. d) Reactivity of C7 with germline-reverted H-CDR1 or H-CDR2 as well as iGLH C7 with matured H-CDR1 or H-CDR2 to select representative CIDRα1 protein domains and a negative control. Results are representative of at least two independent experiments. Source data are provided in Supplementary Table 4.

Update of

References

    1. Miller LH, Baruch DI, Marsh K & Doumbo OK The pathogenic basis of malaria. Nature 415, 673–679 (2002). 10.1038/415673a [doi];415673a [pii] - DOI - PubMed
    1. Lennartz F, Lavstsen T & Higgins MK Towards an anti-disease malaria vaccine. Emerg Top Life Sci 1, 539–545 (2017). 10.1042/ETLS20170091 - DOI - PMC - PubMed
    1. WHO. World malaria report 2023. World Health Organization (2023).
    1. Baruch DI et al. Cloning the P. falciparum gene encoding PfEMP1, a malarial variant antigen and adherence receptor on the surface of parasitized human erythrocytes. Cell 82, 77–87 (1995). https://doi.org/0092-8674(95)90054-3 [pii] - PubMed
    1. Smith JD et al. Switches in expression of Plasmodium falciparum var genes correlate with changes in antigenic and cytoadherent phenotypes of infected erythrocytes. Cell 82, 101–110 (1995). https://doi.org/0092-8674(95)90056-X [pii] - PMC - PubMed

MeSH terms

Substances

LinkOut - more resources