. 2024 Dec;636(8043):663-670.
doi: 10.1038/s41586-024-08129-x. Epub 2024 Nov 20.

Normal breast tissues harbour rare populations of aneuploid epithelial cells

Affiliations

Normal breast tissues harbour rare populations of aneuploid epithelial cells

Yiyun Lin et al. Nature. 2024 Dec.

Abstract

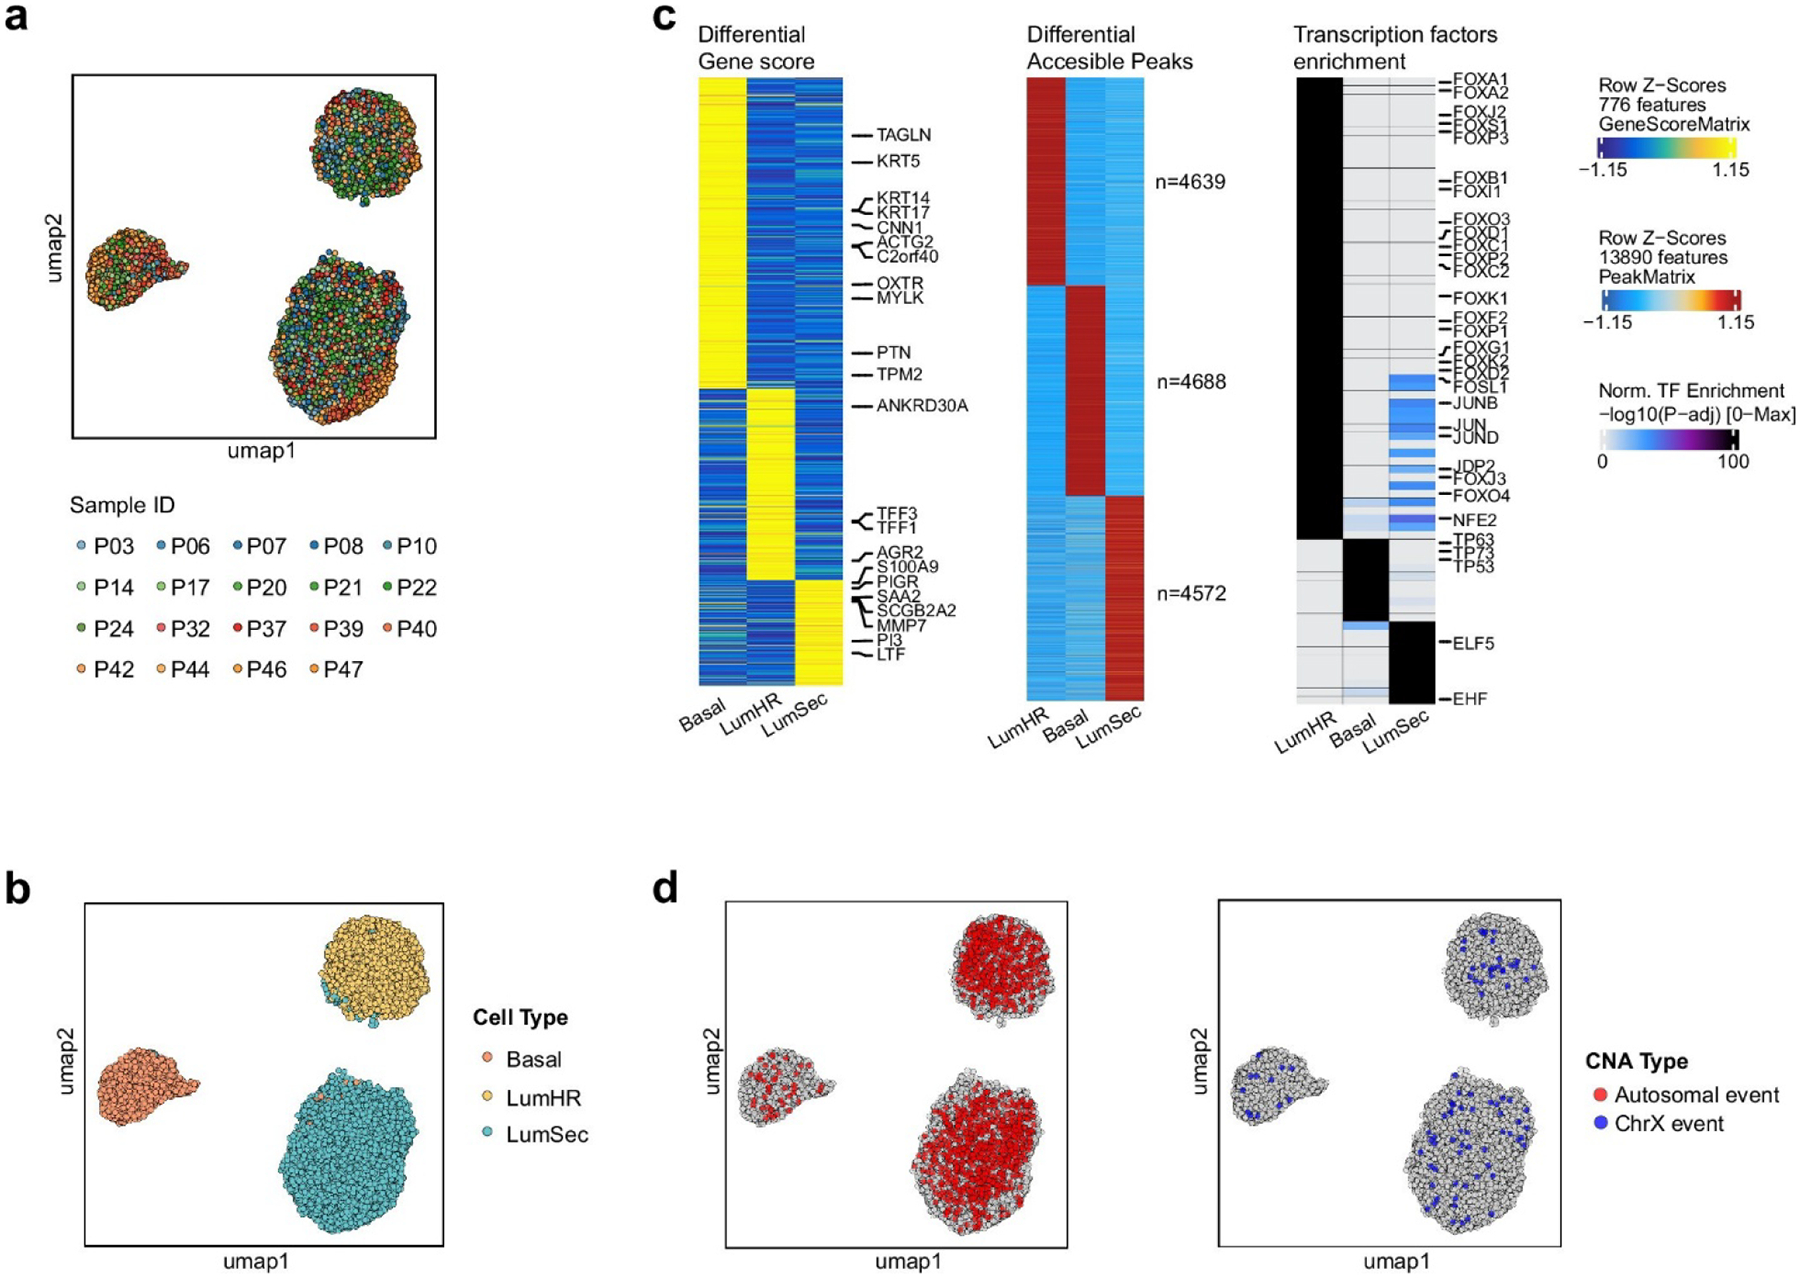
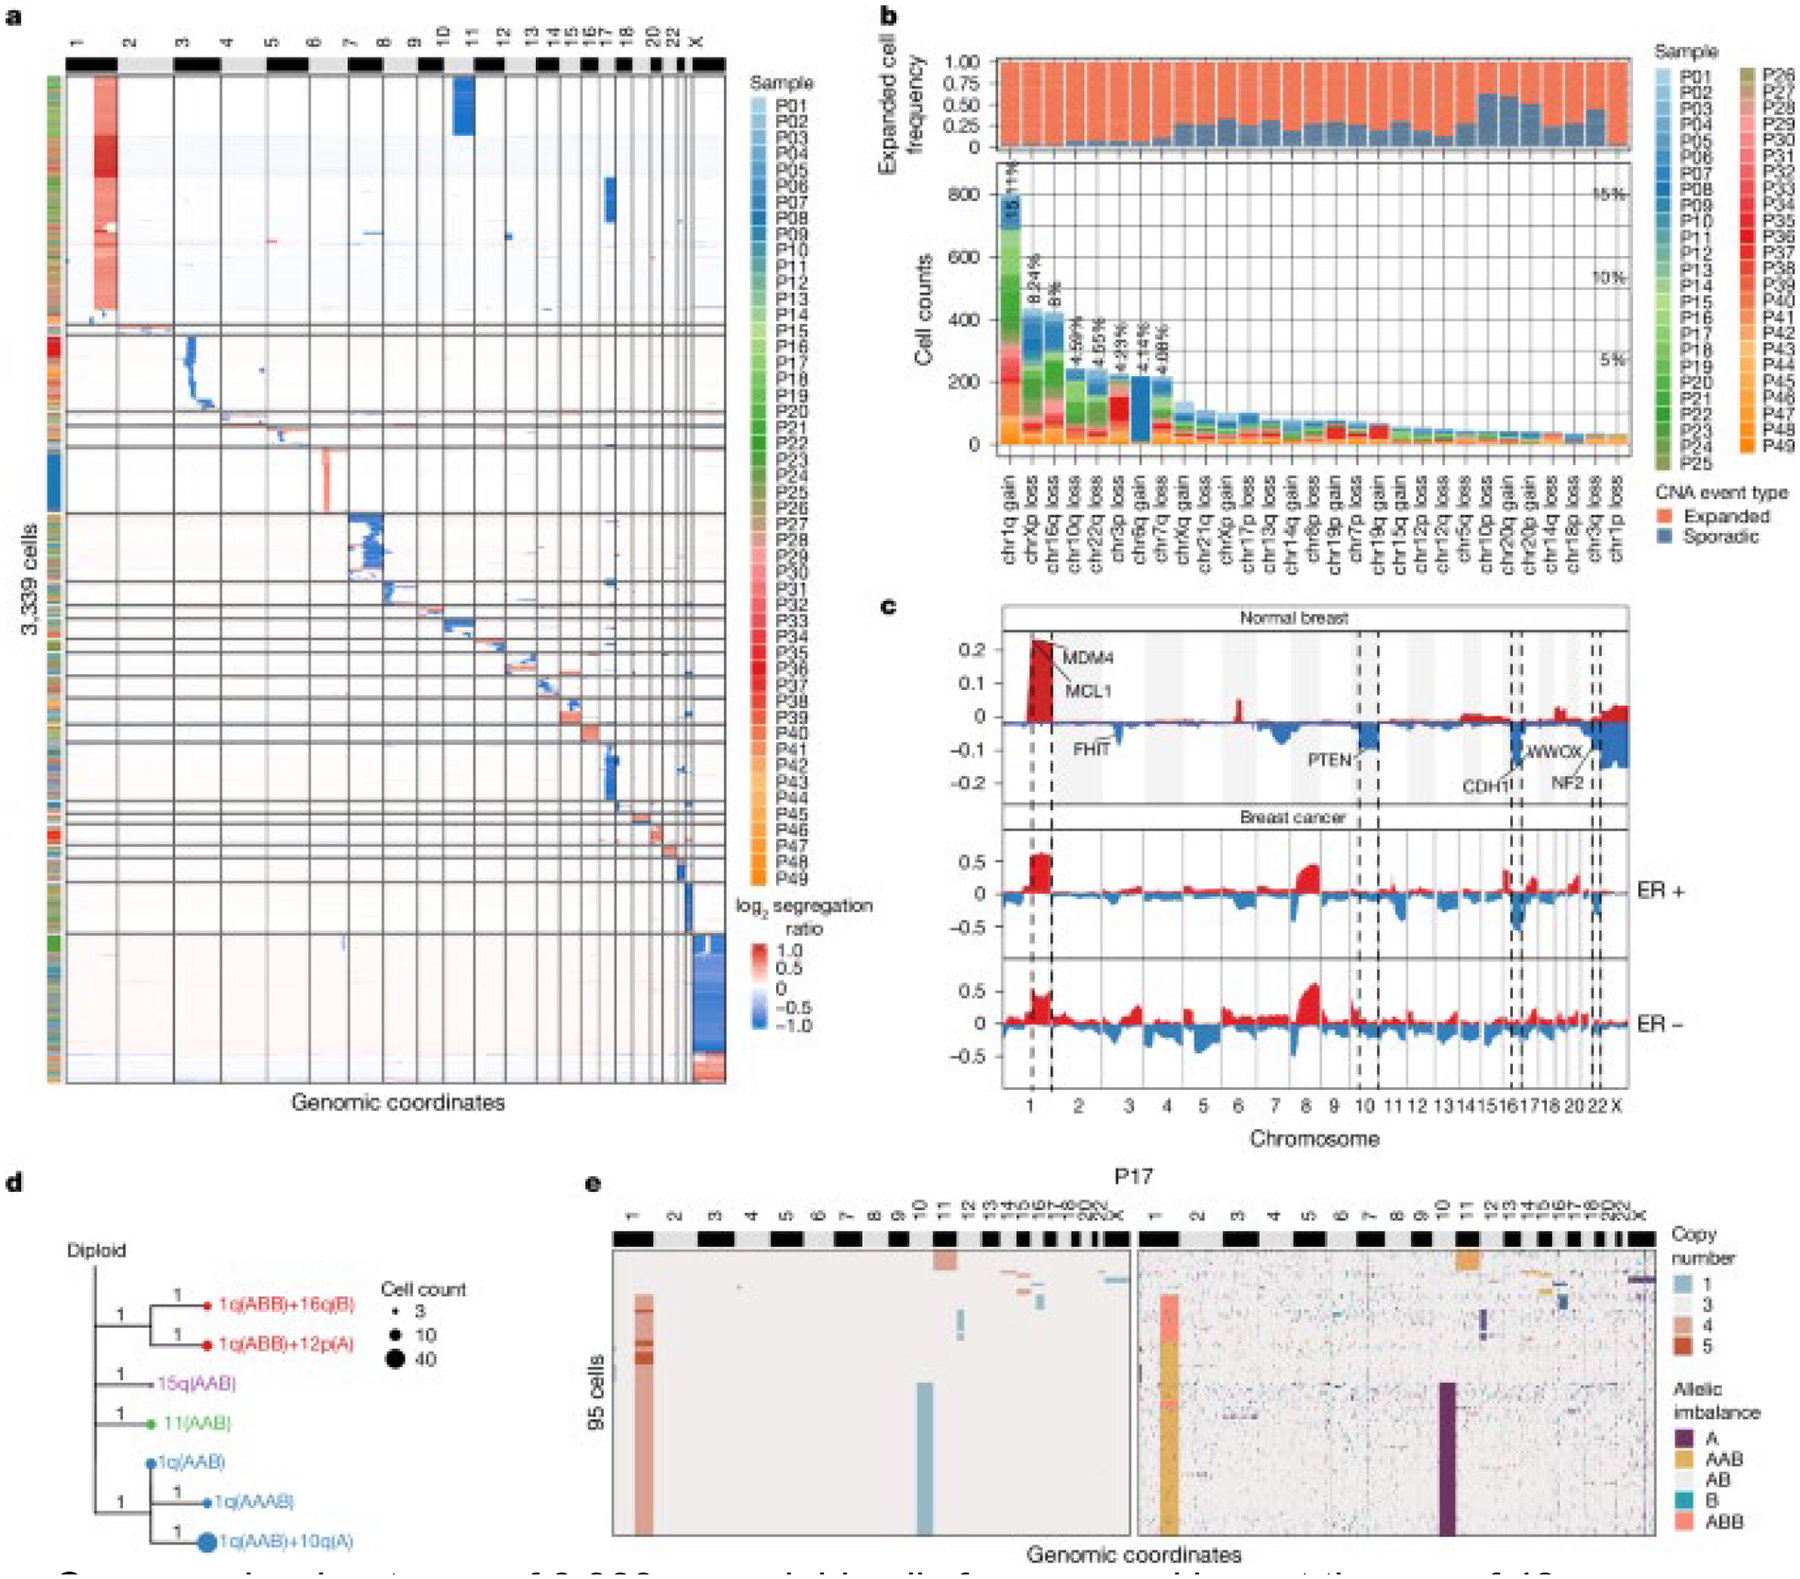
Aneuploid epithelial cells are common in breast cancer1,2; however, their presence in normal breast tissues is not well understood. To address this question, we applied single-cell DNA sequencing to profile copy number alterations in 83,206 epithelial cells from the breast tissues of 49 healthy women, and we applied single-cell DNA and assay for transposase-accessible chromatin sequencing co-assays to the samples of 19 women. Our data show that all women harboured rare aneuploid epithelial cells (median 3.19%) that increased with age. Many aneuploid epithelial cells (median 82.22%) in normal breast tissues underwent clonal expansions and harboured copy number alterations reminiscent of invasive breast cancers (gains of 1q; losses of 10q, 16q and 22q). Co-assay profiling showed that the aneuploid cells were mainly associated with the two luminal epithelial lineages, and spatial mapping showed that they localized in ductal and lobular structures with normal histopathology. Collectively, these data show that even healthy women have clonal expansions of rare aneuploid epithelial cells in their breast tissues.


Conflict of interest statement

Competing interests: The authors declare no competing interests.

Figures

Extended Data Figure 1.
Extended Data Figure 1.. Example of a woman with rare aneuploid cells in the normal breast tissue
a.b, Representative hematoxylin and eosin (H&E) stained photomicrographs (left panel), single cell DNA copy number heatmap (middle panel) and segmented copy number ratio plots (right panel) of selected aneuploid cells from patient P18(a), P20(b). Normal breast tissue morphologies of P18 and P20 were confirmed by examining two H&E slides per sample.
Extended Data Figure 2.
Extended Data Figure 2.. Copy number heatmap across patients and CNA events detected in individual patients
a. Single cell DNA copy number heatmap of N=3339 aneuploid cells from normal breast tissues across 49 disease-free women organized by patient. b. Examples of clustered copy number heatmaps of aneuploid cells from three women (P21, P17, P18) with lower panels showing chromosome arm-level CNA event counting for chromosomal gains and losses across all cells from each patient. c. The two panels show the linear correlation plots (Spearman Rank Correlation) of number of cells with sporadic events versus number of total cells sampled (left panel) or number of aneuploid cells detected (right panel). d. The two panels show the linear correlation plots (Spearman Rank Correlation) of the number of sporadic CNA events versus the number of total cells sampled (left panel) or number of aneuploid cells detected (right panel). The error bands in c and d represent the 95% confidence interval of the linear regression line. The correlations in c and d were tested by two-sided Spearman’s rank tests.
Extended Data Figure 3.
Extended Data Figure 3.. Correlation of aneuploid cells from normal breast tissue with clinical metadata
a. Boxplots showing the comparison of CNA event number counts in aneuploid epithelial cells with metadata for hyperplasia, metaplasia, parity status, menopause and ethnicity, significance tested using two-sided Wilcoxon rank sum test with adjusted p value reported. N.O.: not observed; AA: African American. b. Correlation plot between BMI and number of CNA events in aneuploid cells tested for significance using Spearman’s rank correlation. The error band represents the 95% confidence interval of the linear regression line. c. Multivariate linear regression analysis showing the correlation between clinical metadata and number of CNA events in the aneuploid epithelial cells with. All p-values were calculated based on two-sided Wald test. d. Boxplots showing the comparison of the proportion of aneuploid cells with metadata for hyperplasia, metaplasia, parity status, menopause and ethnicity, tested by two-sided Wilcoxon rank sum test. e. Correlation plot between BMI and proportion of aneuploid cells tested by Spearman’s rank correlation. f. Multivariate linear regression analysis showing the correlation between clinical characters and proportion of aneuploid cells. The bars represent the 95% confidence intervals of the effect sizes. All p-values were calculated based on two-sided t-test. g. Correlation plots of age compared to the number of autosomal events (left panel) or the number of chromosome X events (right panel) (Spearman’s rank). The boxplots show the median with interquartile ranges (25–75%), while the whiskers extend to the 1.5× the interquartile range from the box (a, d). The error bands in b, e, g represent the 95% confidence interval of the linear regression line. The correlations in b, e, g were tested by two-sided Spearman’s rank tests.
Extended Data Figure 4.
Extended Data Figure 4.. Focal CNA mapping and allele-specific copy number lineages
a. GISTIC2 G-scores for the copy number events detected in aneuploid cells on chromosomes 3, 7, 8 and 13. Peaks are annotated by cytogenetic location and selected cancer-related genes are mapped to the peaks. b. Co-occurrence between specific copy number events in the aneuploid cells from all 49 women, where dot size indicates the prevalence of the co-occurred events pair and * indicated the two-sided Fisher Exact test, FDR <0.05, event count >20 and event occurred in at least 10% patients. c. Minimum evolution tree rooted by a diploid node of the allele specific copy number of the clonal subpopulations (left panel), copy number heatmap (middle panel) and allele state heatmap (right panel) of aneuploid cells from P21, P08, P23, P20. A: loss of allele B; AAB: gain of allele A; AB: balanced alleles; B: loss of allele A; ABB: gain of allele B.
Extended Data Figure 5.
Extended Data Figure 5.. Epithelial cell lineages of aneuploid cells in additional patients identified by DNA&ATAC co-assays
a. UMAP of single cell ATAC-seq profiles from DNA&ATAC co-assay experiments for 19 normal breast samples colored by sample. b. UMAP annotated with cell types from single cell ATAC-seq profiles (N=31,176 cells) generated from DNA-ATAC co-assay experiments for 19 normal breast samples that underwent epithelial enrichment. c. Left panel shows the heatmap of z-scores from differential gene score analysis of the 3 epithelial cell types with canonical gene markers; middle panel shows the heatmap of z-scores from DAP analysis of the 3 epithelial cell types; right panel shows the heatmap of adjusted p-values from TF enrichment analysis of the 3 epithelial cell types with lineage-specific TF markers labeled. The differential analyses were tested by Wilcoxon rank sum test, with P values adjusted using Benjamin & Hochberg method (FDR). d. UMAPs from single cell ATAC-seq profiles (N=31,176 cells) generated from DNA-ATAC co-assay experiments for 19 normal breast samples that underwent epithelial enrichment showing cells with autosomal CNA events (left panel) or chromosome X events (right panel).
Extended Data Figure 6.
Extended Data Figure 6.. Chromatin accessibility differences in epithelial lineages identified by DNA&ATAC co-assays
a. Left panels are UMAPs of single cell ATAC-seq profiles for six patients (P14, P03, P39, P46, P37, P08) colored by either autosomal or X chromosome CNA events detected. Right panels are clustered heatmaps of single cell copy number profiles, with cell types indicated in the left annotation bars from the ATAC data. b. The copy number frequency plot of single cell co-assay data from the aneuploid epithelial cells with Basal-myoepithelial ATAC profiles. c. Differential gene score analysis of aneuploid cells relative to their diploid epithelial cell type references (LumSec, LumHR) for specific chromosomal events. d. Normalized ATAC signals in LumHR mapped to selected breast cancer gene regions with differential gene scores between diploid cells and cells with chr1q gain, chr16q loss, respectively. e. Normalized ATAC signals in LumSec mapped to breast cancer gene regions with differential gene scores between diploid cells and cells with chr1q gain and chr10q loss, respectively.
Extended Data Figure 7.
Extended Data Figure 7.. Spatial transcriptomic analysis of aneuploid cells in normal breast tissues in additional patients
a,c,e Copy number heatmaps inferred from Spatial Transcriptomics spot data using CopyKAT of P20(a), P03(c), P16(e). b,d,f Predicted aneuploid spot annotations overlayed on H&E images (left panel). Spatial H&E image and representative photomicrographs (right panel) of P20(b), P03(d), P16(f). Normal breast tissue morphologies were confirmed by examining the H&E imaging of all of the predicted aneuploid areas in the tissue sections.
Extended Data Figure 8.
Extended Data Figure 8.. Spatial transcriptomic analysis of additional patients and cytogenetic validation
a,b Copy number inferred from Spatial Transcriptomics spot data using CopyKAT of P14(a), P40(b). Inferred copy number heatmap (left panel). Predicted aneuploid spot annotations overlayed on H&E images (middle panel). Spatial H&E image and representative photomicrographs (right panel). c. Representative DNA-FISH images of chr1q gain and diploid cells of P14, P20 and P40. Probes colored in green targeted chr1q (MDM4), while control probes colored in red targeted chr1p. scale bar, 5 μm. FISH results were obtained from 16–25 imaging areas at 60x magnification.
Figure 1.
Figure 1.. Study overview and data from an individual woman
a. Overview of the study design, in which epithelial cells were enriched from viable cell suspensions from normal breast tissues to perform scDNA-seq (n = 49) and scDNA&ATAC-seq co-assays (n = 19). Tissue sections were also prepared and used to perform H&E pathological analysis (n = 49), spatial transcriptomics (n = 6) and DNA FISH cytogenetic experiments (n = 4). b, Representative H&E stained photomicrograph (left), single-cell DNA copy number heat map (middle) and copy number ratio plots (right) of selected aneuploid cells from patient P21. Normal breast tissue morphology was confirmed by examining two H&E slides from P21. Scale bar, 100 μm.
Figure 2.
Figure 2.. Aneuploid cells in breast tissue from 49 disease-free women and metadata correlations
a, Top, the frequency of expanded and sporadic CNA events detected in the aneuploid cells from the normal breast tissue from each patient sorted by age. Middle, the frequency of autosomal and chromosome X events sorted by age. Bottom, the proportion of aneuploid cells across the 49 women, sorted by age, showing the frequency of specific CNA events. b, Top, metadata features. Bottom, specific CNA events in women, sorted by age. c, Correlation plots of age compared with the number of CNA events detected per expanded subclones (left) or the proportion of aneuploid cells (right). d, Correlation plots of age compared to the number of expanded events (left) or the number of sporadic events (right). The error bands in c and d represent the 95% confidence interval of the linear regression line. The correlations in c and d were tested by two-sided Spearman’s rank tests.
Figure 3.
Figure 3.. Copy number events in normal tissues associated with breast cancer
a, Copy number heat map of 3,339 aneuploid cells from normal breast tissues of 49 women clustered by CNA events. b, Top, the frequency of expanded CNA events, compared with sporadic CNA events. Bottom, corresponding bar chart, which shows specific chromosomal events summarized for all 49 women. c, Frequency plot of copy number events in aneuploid cells from normal breast tissues of 49 women, compared with the ER-positive (763 patients) and ER-negative (217 patients) invasive breast cancers from TCGA. d, Minimum evolution tree rooted by a diploid node, constructed from allele-specific copy number profiles of the clonal subpopulations from P17. e, Copy number heat map (left) and allele state heat map (right) of 95 aneuploid cells from P17. A, loss of allele B; AAB, gain of allele A; AB, balanced alleles; B, loss of allele A; ABB, gain of allele B.
Figure 4.
Figure 4.. Epithelial cell lineages of aneuploid cells in normal breast tissues.
a, Left, scDNA&ATAC-seq co-assay data from three patients (P17, P21 and P24) showing uniform manifold approximation and projections (UMAPs) of ATAC-seq profiles of cell types with aneuploid cells coloured by autosomal events or chromosome X events. Right, copy number heat maps of aneuploid cells, with the left annotation bar showing the cell type from the ATAC-seq profiles. Significant genes in aneuploid cells relative to their diploid epithelial cell type reference are shown below (P < 0.05, Wilcoxon rank-sum test). b, Bar plot showing the composition of the epithelial lineages of the aneuploid cells across the 19 samples. c, Top, the copy number frequency plot of single-cell co-assay copy number data from the aneuploid epithelial cells with LumHR ATAC-seq profiles. Bottom, a frequency plot from the patients with ER-positive invasive breast cancer (763 patients) from TCGA. d, Top, the copy number frequency plot of single-cell co-assay data from the aneuploid epithelial cells with LumSec ATAC-seq profiles. Bottom, the frequency plot of patients with ER-negative invasive breast cancer (217 patients) from TCGA. seg., segment.
Figure 5.
Figure 5.. Spatial organization of aneuploid cells in normal breast tissues
a, Copy number heat maps inferred from spatial transcriptomics spot data using CopyKAT for patient P32. b, Predicted cell types overlayed on the H&E stained image. c, Predicted aneuploid spot annotations overlayed on the H&E stained image of the tissue section. d, Spatial H&E stained image and representative photomicrographs of normal breast tissue morphology were confirmed by examining the aneuploid regions of the H&E tissue section. e, Representative DNA cytogenetic FISH images of chr1q gain, chr10q loss and diploid cells. FISH results were obtained from imaging 25 areas at ×60 magnification. Probes coloured in green targeted chr1q (MDM4) and chr10q (PTEN). Control probes, coloured in red, targeted chr1p and chr10p. Scale bars, 1 mm (b–d), 0.2 mm (d, insets), 5 μm (e).

References

    1. Curtis C et al. The genomic and transcriptomic architecture of 2,000 breast tumours reveals novel subgroups. Nature (2012). https://doi.org:nature10983 [pii] 10.1038/nature10983 - DOI - PMC - PubMed
    1. Cancer Genome Atlas, N. Comprehensive molecular portraits of human breast tumours. Nature 490, 61–70 (2012). 10.1038/nature11412 - DOI - PMC - PubMed
    1. Hassiotou F & Geddes D Anatomy of the human mammary gland: Current status of knowledge. Clin Anat 26, 29–48 (2013). 10.1002/ca.22165 - DOI - PubMed
    1. Kumar T et al. A spatially resolved single-cell genomic atlas of the adult human breast. Nature (2023). 10.1038/s41586-023-06252-9 - DOI - PMC - PubMed
    1. Wang Y & Navin NE Advances and Applications of Single-Cell Sequencing Technologies. Molecular cell 58, 598–609 (2015). 10.1016/j.molcel.2015.05.005 - DOI - PMC - PubMed

MeSH terms

LinkOut - more resources