. 2024 Dec;636(8041):100-107.
doi: 10.1038/s41586-024-08208-z. Epub 2024 Nov 20.

Mineralized collagen plywood contributes to bone autograft performance

Affiliations

Mineralized collagen plywood contributes to bone autograft performance

Marc Robin et al. Nature. 2024 Dec.

Abstract

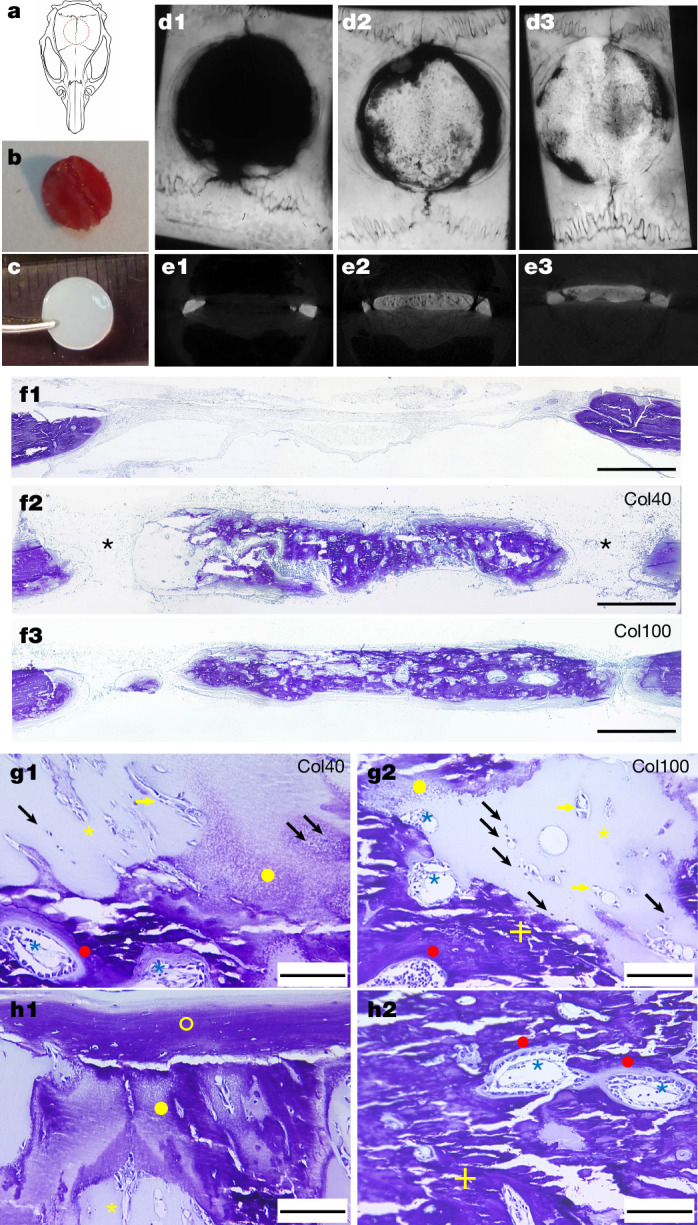
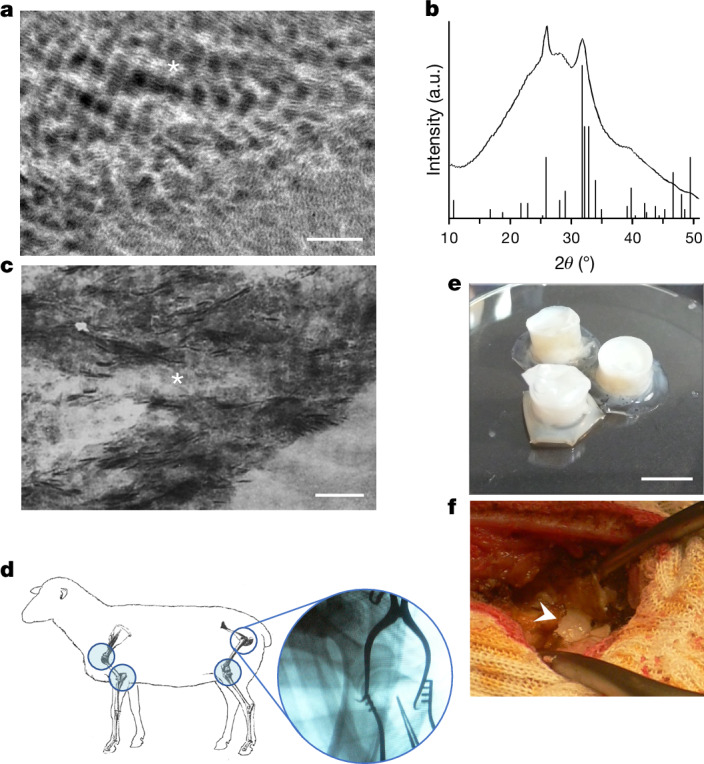
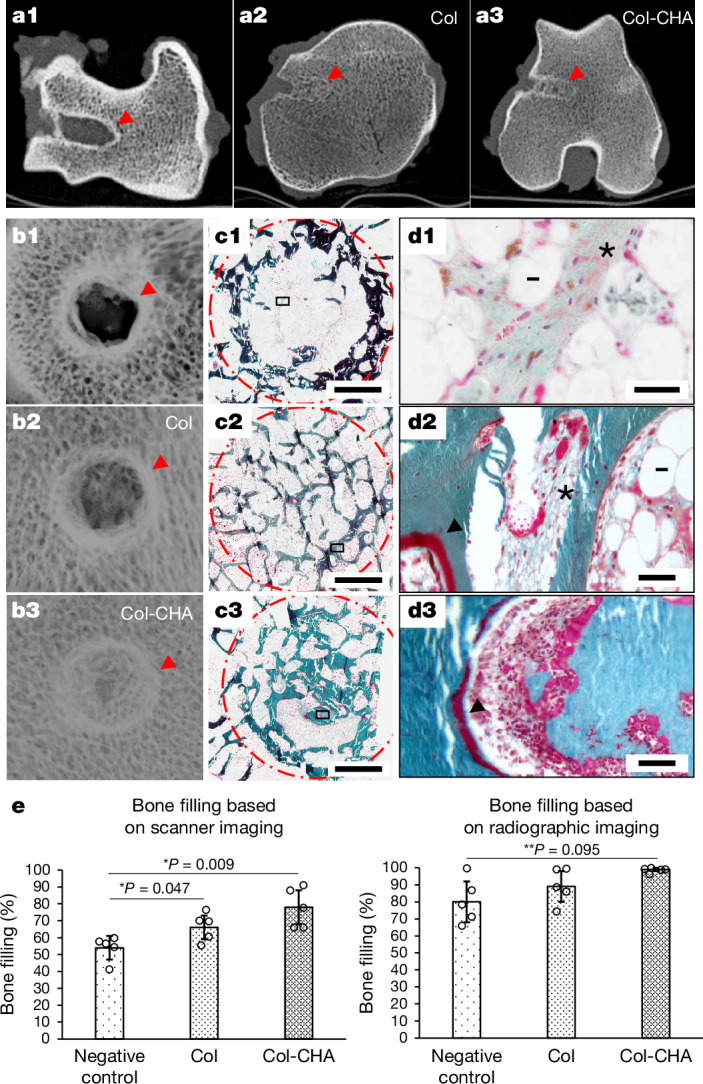
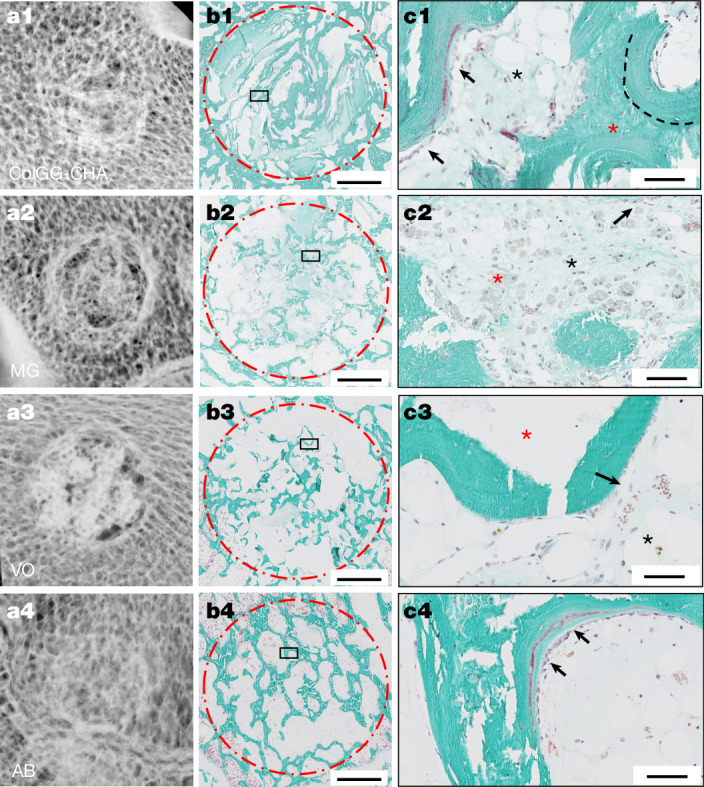
Autologous bone (AB) is the gold standard for bone-replacement surgeries1, despite its limited availability and the need for an extra surgical site. Traditionally, competitive biomaterials for bone repair have focused on mimicking the mineral aspect of bone, as evidenced by the widespread clinical use of bioactive ceramics2. However, AB also exhibits hierarchical organic structures that might substantially affect bone regeneration. Here, using a range of cell-free biomimetic-collagen-based materials in murine and ovine bone-defect models, we demonstrate that a hierarchical hybrid microstructure-specifically, the twisted plywood pattern of collagen and its association with poorly crystallized bioapatite-favourably influences bone regeneration. Our study shows that the most structurally biomimetic material has the potential to stimulate bone growth, highlighting the pivotal role of physicochemical properties in supporting bone formation and offering promising prospects as a competitive bone-graft material.


Conflict of interest statement

Competing interests: The authors declare no competing interests.

Figures

Fig. 1
Fig. 1. Characterization of collagen suprafibrillar organization in bone and synthetic collagen-based materials.
a,b, SEM micrographs of decalcified human compact bone (n = 1 sample) at low and high magnification, respectively. Scale bars, 50 μm (a), 5 μm (b). c, SEM micrograph of synthetic collagen-based materials characterized by a 3D dense and organized biomimetic structure (Col100; n = 3 samples). Scale bar, 5 μm. The plywood organization is depicted in the associated schematic representation below b. d, SEM micrograph of a non-organized collagen fibrillar network with large (micrometric) interfibrillar spaces (Col40; n = 3 samples). Scale bar, 2 μm.
Fig. 2
Fig. 2. Effect of collagen-based matrices in calvaria bone-defect model.
a, Schematic representation of rat calvaria showing the characteristics of the defect (localization, size and shape; dashed red circle). Pictures of the 8-mm-diameter removed cranial bone piece (b) and collagen matrix implant (Col40) (c). Representative microradiographies of the empty-site control (d1; n = 6 defects) and defect filled with Col40 (d2; n = 10 defects) and Col100 (d3; n = 9 defects). µCT scans of a representative control (e1) and defect filled with Col40 (e2) and Col100 (e3). Representative overview by toluidine-blue-stained histological sections of defect left empty (f1; n = 6 defects) or implanted with Col40 (f2; n = 10 defects) or Col100 (f3; n = 9 defects). Col40 is partly replaced by mineralized tissue surrounded by areas of unbound bone edges (stars). Conversely, bone formation in Col100 is more homogeneous and the bounding of bone edges is more frequent. Scale bars, 1 mm (f1, f2, f3). At higher magnification, both Col40 (g1) and Col100 (g2) matrices show a similar integration mechanism. Remnant matrix (yellow star) is observed infiltrated by vascular cells (isolated or structured in blood vessels, black and yellow arrows, respectively). Concomitantly, the remnant matrix is undergoing an in situ mineralization without structural changes (granular aspect and more intense staining, yellow dot). The remnant matrix areas are surrounded by more mature bone regions with areas of active osseous formation, including remodelling sites around medullar spaces (blue stars) and osteoid tissue deposition (red dots). For Col100, larger medullar structures are observed, leading to mature bone formation (yellow cross). h1, A newly formed lamellar bone containing osteocytes (yellow circle) that surrounds a less mature fraction of Col40 (yellow dot for mineralized areas and yellow star for remnant material). h2, For Col100, a more mature lamellar bone morphology (yellow cross) is observed, with noticeable marrow spaces (blue stars), containing vessels surrounded by osteoblasts forming osteoid matrix (red dots). Remnants of the collagen matrix are more sparsely distributed. Scale bars, 50 μm (g1, g2, h1, h2).
Fig. 3
Fig. 3. Characterization and implantation of bone-like material in ewe model.
a, TEM micrograph of Col-CHA (n = 3 samples), in which the collagen–apatite co-alignment is observed (star). Scale bar, 500 nm. b, 1D radial average of the WAXD pattern of Col-CHA and the X-ray diffraction pattern of synthetic HA from the database PDF-5+ (JCPDS #00-009-0432). c, TEM micrograph of partially decalcified human compact bone (as shown in a; the typical co-alignment is highlighted by a star) (n = 1 sample). Scale bar, 500 nm. d, Schematic representation of the ewe surgical procedure and metaphyseal implantation sites (spherical inset). Pictures of Col-CHA (about 8 mm in diameter) before (e) and during (f) implantation, its size and shape fitting the bone defect (arrowhead). Scale bar, 1 cm. a.u., arbitrary units.
Fig. 4
Fig. 4. Comparison of bone materials in ewe model after 2 months of implantation using non-mineralized or mineralized twisted plywood scaffolds.
Scanner imaging sections of the control in which the defect was left empty (a1; n = 5 defects), ewe implanted with Col (a2; n = 5 defects) and Col-CHA (a3; n = 5 defects) matrices. Red arrowheads show the original defect identified by strong peripheral ossification as a result of the surgical procedure. Faxitron radiographic imaging of the empty-site control (b1; n = 5 defects), ewe implanted with Col (b2; n = 5 defects) and Col-CHA (b3; n = 5 defects) matrices. The strong peripheral ossification is also evidenced here (red arrowheads). Histological GT-stained thin sections of implantation sites for the empty-site control (c1,d1; n = 5 defects), Col (c2,d2; n = 5 defects) and Col-CHA (c3,d3; n = 5 defects) matrices. Dashed-dotted red circles represent the approximate initial defects. Higher-magnification observations allow the visualization of tissular components and organization: fat adipose tissue (bars), collagenic scar tissue (stars) and bone trabeculae with remodelling (black arrowheads). Sections are perpendicular to the long axis of the defect. Scale bars, 2 mm (c1,c2,c3), 50 μm (d1,d2,d3). e, The percentage of bone filling for each defect was blindly measured on radiographies and scanner imaging. Data were analysed from the total number of defects in each group, as indicated in the bars (n = 5), expressed as mean ± s.d. and compared using nonparametric Kruskal–Wallis with Mann–Whitney multiple comparison test (scanner imaging) or independent unpaired two-sided Mann–Whitney tests (radiographic imaging). *Significant difference with P < 0.05. **A difference/trend with P < 0.10.
Fig. 5
Fig. 5. Comparison of bone formation in ewe model between bone-like material, ceramic biomaterials and AB after 2 months of implantation.
Faxitron radiographic imaging of ewe bone defects implanted with ColCG-CHA matrices (a1; n = 12 defects), MG ceramic (a2), VO ceramic (a3) and AB graft (a4) (n = 5 for MG, VO and AB). Histological GT-stained thin sections of ewe bone defects implanted with ColCG-CHA matrices (b1; n = 12 defects), MG ceramic (b2), VO ceramic (b3) and AB graft (b4) (n = 5 for MG, VO and AB). Dashed-dotted red circles represent the approximate initial defect. Scale bars, 2 mm. Higher-magnification observations (c1c4, ColCG-CHA, VO, MG and AB, respectively) allow the visualization of tissular components and organization, such as residual materials (red stars in c1 and c2), active (black arrows in c1 and c4) or quiescent osteoblast layers (black arrows in c2 and c3), active osteoid deposition (c1 and c4 only, red staining) indicative of active bone formation and fibrous scar tissue often associated with medullary spaces (black stars). The dashed curve in c1 shows the limit between the residual cell-free collagenic material (red star in c1) and mature bone formation including entrapped osteocytes. Residual material for the ceramics implant exists as ceramic particles (red star in c2) or voids reflecting the presence of ceramic particles probably released during the cutting step of thin-section preparation (red star in c3). Scale bars, 50 μm.
Fig. 6
Fig. 6. In-depth histopathological analysis of bone-like material implantation in ewe after 2 months.
a, GT-stained histological thin section of implantation site with ColCG-CHA (n = 12 defects) showing the presence of active osteoclasts (blue arrows). Scale bar, 100 μm. bd, HE histological thin sections of various areas in defects implanted with ColCG-CHA (n = 12 defects). The remnant material (yellow stars in b and c) is being infiltrated by vascular cells (isolated or grouped, black and yellows arrows, respectively, in b and c), whereas other regions take a granular aspect reminiscent of the in situ mineralization observed in the rat study (yellow dots in c). The higher-magnification inset in b shows a grouped vascular cells infiltration from another section. Blue star in b points to a more structured vascular formation. The dashed oval in c indicates an area of the mineralized remnant material reflecting a maturation towards a woven bone aspect that can then be further remodelled into mature bone. Such intermediate area is abundant in d. Remodelling is observed, including active osteoclasts (blue arrow and d1), small resorption lacunae and larger vascularized medullary spaces (blue stars and d2). The medullary spaces are surrounded by mature lamellar bone (yellow cross) with osteocytes and quiescent or active osteoblasts rows (d3). Scale bars, 100 μm (b,c,d), 50 μm (b inset,d1d3) e, Histological GT-stained section and schematic representation of the main processes induced by bone-like biomaterials: (1) implant (yellow star) infiltration by vascular cells (black and yellow arrows) concomitantly with (2) in situ collagen mineralization (yellow dot); (3) evolution towards an intermediate bone-like aspect reminiscent of the structure of woven bone (dashed oval); (4) resorption by osteoclasts (blue arrows); (5) osteoblasts layer formation (mononuclear cuboid cells in pink) producing collagen fibrils (newly formed osteoid tissue in light blue and red), that is, active remodelling and bone formation (red dot) around large vascularized medullary spaces (blue stars); (6) mature bone formation (yellow cross) with osteoblasts migration/embedment, which may differentiate into osteocytes. Scale bar, 100 μm.
Extended Data Fig. 1
Extended Data Fig. 1. Picture of bone powder.
Mineral extracted from porcine bone with NaClO aqueous solution.
Extended Data Fig. 2
Extended Data Fig. 2. Microstructure of collagen fibrils in bone extracted from rat calvaria and related rat calvaria critical-size defect surgical procedure.
a, TEM image of bone ultrathin section extracted from the rat calvaria (Fig. 2c, n = 1 sample) showing dense fibrillar layers of different orientations. Yellow dots and bars represent fibrils that are perpendicular and parallel to the observation plan, respectively. Picture of circular-shaped collagen matrix fitting the calvaria defect in rat (b), the matrix adhering to the surrounding bone after several minutes (c) and the skin sutured (d).
Extended Data Fig. 3
Extended Data Fig. 3. Bone filling for rat experiment.
Bone filling on the basis of microradiographies (a) and von Kossa-stained thin sections (b). The percentage of bone filling for each defect was blindly measured on individual images. Microradiograph data were analysed from the total number of animals included in each group, as indicated in the bars (n = 6, 10 and 9 for negative control, Col40 and Col100, respectively). von Kossa data were analysed from representative animals in each group, as indicated in the bars (n = 3, 5 and 6 for negative control, Col40 and Col100, respectively). Data were expressed as mean ± s.d. and compared using nonparametric Kruskal–Wallis with two-sided Mann–Whitney multiple comparison test. *Significant difference with P < 0.05. **A difference/trend with P < 0.10.
Extended Data Fig. 4
Extended Data Fig. 4. Characterization of the in situ mineralization in the collagen materials implanted in rat calvaria model.
SEM observations of a histological section from a defect implanted with Col100 (n = 1 sample) at low (a) and higher (b) magnifications. The interface in which in situ mineralization occurs (yellow dot, granular aspect) is clearly observed, the fibrillar aspect of the matrix (yellow star) disappearing in favour of mineral aggregates (refs. ,). c, This difference of texture is also seen at the TEM scale (n = 1 sample), in which some domains seem more mineralized with a higher contrast (yellow dot versus star), as the section is not stained. d, SEM coupled with energy-dispersive X-ray spectroscopy microanalysis (n = 1 sample). The elemental mapping of the area shows the presence of carbon (C in red), calcium (Ca in purple) and phosphorus (P in turquoise) and confirms that the Ca and P are more pronounced in the granular (yellow dot) part of the matrix than in the fibrillar part (yellow star).
Extended Data Fig. 5
Extended Data Fig. 5. Toluidine blue, ALP and TRAP stains for rat experiments.
a, Col100 histological thin sections stained with toluidine blue (n = 9 defects) show the formation of lamellar bone on the external surface of the matrix (yellow circle). b, ALP detection sections (n = 10 and 9 for Col40 and Col00, respectively). A thin layer of ALP-positive cells (osteoblasts) lines at the exocranial surface and numerous cells are observed in the mineralized formations for both Col40 (b1) and Col100 (b2). c, TRAP detection sections (n = 10 and 9 for Col40 and Col00, respectively). Few TRAP-positive cells (osteoclasts) are found in Col40 (c1; around 4 osteoclasts mm−1), whereas many osteoclasts (around 7 osteoclasts mm−1) are homogeneously distributed within the newly formed bone tissue in Col100 (c2).
Extended Data Fig. 6
Extended Data Fig. 6. Mechanical characterization of the Col40, Col100 and Col-CHA matrices.
Distributions of the local Young’s modulus E inferred from typically 200 independent indentation tests performed on the Col40 matrix (left, n = 265 independent microindentations), the Col100 matrix (centre, n = 230 independent microindentations) and the Col-CHA matrix (right, n = 183 independent microindentations). The minimum and maximum of the whiskers respectively correspond to cumulative probabilities of 0.02 and 0.98, whereas the bounds of the box indicate the first and third quartiles and the centre of the box shows the median. The probability density shown with a shaded area is that of the logarithm of the effective Young’s modulus. See also Supplementary Table 1.
Extended Data Fig. 7
Extended Data Fig. 7. Comparison between rat tail collagen and clinical-grade collagen.
a, SDS-PAGE of type I collagen extracted from rat tails tendons (1, n = 1 sample) and bovine dermis (commercialized by Symatese as clinical grade) (2, n = 1 sample), which confirms the higher purity of the commercial solution. The white double-headed arrow shows the band corresponding to the α chain of type I collagen (125.103 KDa). b, Differential scanning calorimetry of a collagen solution extracted from rat tail tendons (dashed line, 7 mg ml−1) and from bovine dermis (clinical grade) (solid line, 5 mg ml−1). The endothermic peak is seen at temperature around 40 °C and is typical of collagen denaturation into gelatine that occurs through the irreversible unfolding of the triple helix (ref. ). The purest collagen solution is the most stable, which may be because of a higher number of interactions between molecules. c, TEM observations of an ultrathin section of clinical-grade collagen fibrils showing the typical cross-striated pattern (n = 3 samples). d,d′, Polarized light microscopy of clinical-grade collagen solution (concentration approximately 80 mg ml−1) observed between crossed polars (at 0° (d) and at 45° (d′)) and showing the typical birefringence of cholesteric order (alternating bright and dark bands). e, Picture of a ColCG-CHA matrix. f, SEM micrograph of a ColCG-CHA matrix (n = 1 sample) showing a periodic stratification typical of the twisted plywood organization. g, TEM micrograph of a ColCG-CHA matrix (n = 1 sample) showing the co-alignment between apatite platelets and the main axis of collagen fibrils.
Extended Data Fig. 8
Extended Data Fig. 8. Pictures of implanted materials and macroscopic evaluation of the bone explants (ewe study no. 2).
a,b, Commercial ceramics biomaterials MG granules (a) and VO block (b). Granules are directly implanted into the defect, whereas ceramic blocks are first cut and then implanted to fit the defect. c, Bone fragments extracted from the iliac crest used as bone filler, that is, AB graft. d, ColCG-CHA biomimetic material, MG, VO and AB explants. The remaining white ceramic material is seen on the VO and MG ceramics-implanted explants.
Extended Data Fig. 9
Extended Data Fig. 9. Histopathological scoring for the four implanted materials (ewe study no. 2).
ColCG-CHA, MG, VO and AB. Blinded histopathological scoring data were analysed from the total number of animals included in each group, as indicated in the bars (n = 12 for ColCG-CHA and n = 5 MG, VO and AB, respectively, except for von Kossa, in which n = 5 defects for all groups, and for osteoid production score, in which n = 4 for VO and AB). Data were expressed as mean ± s.d. and compared using nonparametric Kruskal–Wallis with two-sided Mann–Whitney multiple comparison test. *Significant difference with P < 0.05.
Extended Data Fig. 10
Extended Data Fig. 10. Histological evaluation for no. 2 ewe experiment.
ad, Histological thin sections stained with von Kossa for ewe bone defect implanted with ColCG-CHA (a), MG (b), VO (c) and AB (d) (n = 5 defects for all groups). The dashed yellow circle represents the approximate initial defect (8 mm diameter). e, Histological thin section stained with GT of MG (n = 5 defects) implantation site showing black precipitates residues of the ceramic biomaterial (stars), either free or phagocytized by macrophages. f, The von Kossa staining highlights the in situ mineralization of ColCG-CHA (highlighted within the dashed yellow line).

References

    1. Pape, H. C., Evans, A. & Kobbe, P. Autologous bone graft: properties and techniques. J. Orthop. Trauma24, S36–S40 (2010). - PubMed
    1. Giannoudis, P. V., Dinopoulos, H. & Tsiridis, E. Bone substitutes: an update. Injury36, S20–S27 (2005). - PubMed
    1. Bauer, T. W. & Muschler, G. F. Bone graft materials. An overview of the basic science. Clin. Orthop. Relat. Res.371, 10–27 (2000). - PubMed
    1. Discher, D. E., Mooney, D. J. & Zandstra, P. W. Growth factors, matrices, and forces combine and control stem cells. Science324, 1673–1677 (2009). - PMC - PubMed
    1. Engler, A. J., Sen, S., Sweeney, H. L. & Discher, D. E. Matrix elasticity directs stem cell lineage specification. Cell126, 677–689 (2006). - PubMed

MeSH terms

LinkOut - more resources