. 2025 Jan;637(8046):646-653.
doi: 10.1038/s41586-024-08255-6. Epub 2024 Nov 20.

Social state alters vision using three circuit mechanisms in Drosophila

Affiliations

Social state alters vision using three circuit mechanisms in Drosophila

Catherine E Schretter et al. Nature. 2025 Jan.

Abstract

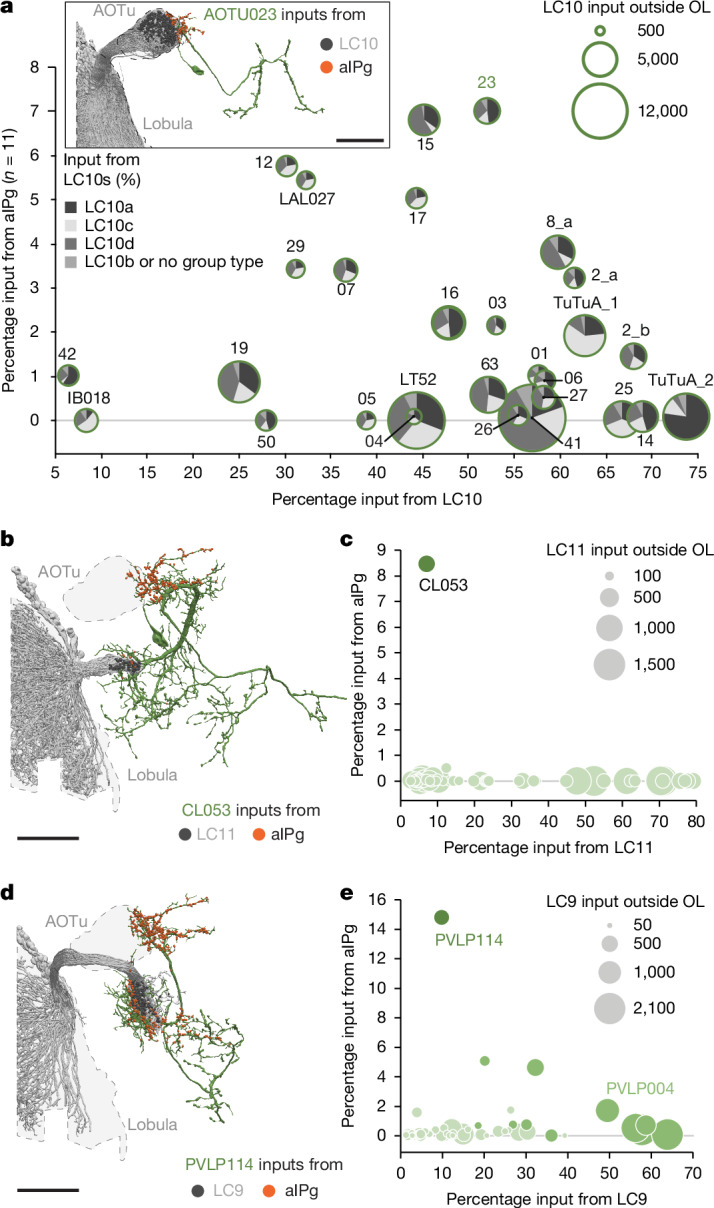
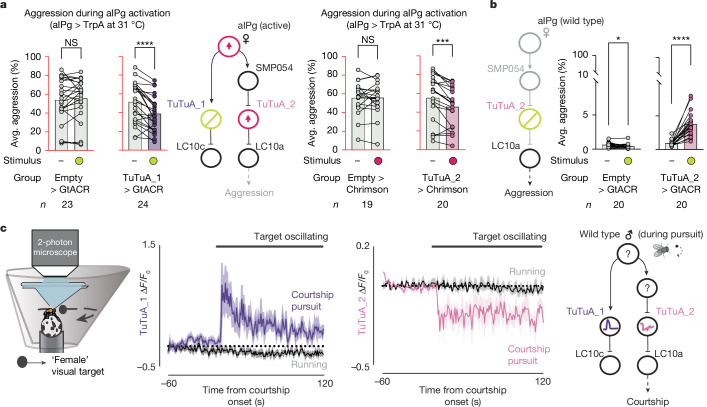
Animals are often bombarded with visual information and must prioritize specific visual features based on their current needs. The neuronal circuits that detect and relay visual features have been well studied1-8. Much less is known about how an animal adjusts its visual attention as its goals or environmental conditions change. During social behaviours, flies need to focus on nearby flies9-11. Here we study how the flow of visual information is altered when female Drosophila enter an aggressive state. From the connectome, we identify three state-dependent circuit motifs poised to modify the response of an aggressive female to fly-sized visual objects: convergence of excitatory inputs from neurons conveying select visual features and internal state; dendritic disinhibition of select visual feature detectors; and a switch that toggles between two visual feature detectors. Using cell-type-specific genetic tools, together with behavioural and neurophysiological analyses, we show that each of these circuit motifs is used during female aggression. We reveal that features of this same switch operate in male Drosophila during courtship pursuit, suggesting that disparate social behaviours may share circuit mechanisms. Our study provides a compelling example of using the connectome to infer circuit mechanisms that underlie dynamic processing of sensory signals.


Conflict of interest statement

Competing interests: The authors declare no competing interests.

Figures

Fig. 1
Fig. 1. The female aggressive state modifies the flow of visual information through three distinct mechanisms.
a, Summary of the circuit mechanisms that we propose aIPg uses to modulate transmission of visual information by VPNs, specifically LC9, LC10s and LC11. These mechanisms include providing additional excitatory input to a select subset of the direct targets of LC9, LC10s and LC11 (convergence of excitatory inputs), relieving inhibition that acts on the dendritic arbours of LC10s in the lobula (dendritic disinhibition) and simultaneously flipping a pair of switches that act on the axonal terminals of the LC10a and LC10c cell types to influence which of these two LC10s is active in signalling to downstream targets (toggle switch). Other than the LC9, LC10-group and LC11 targets discussed above, only three other neurons get both 1.5% or more of their input from aIPg and 5% or more of their input from an LC type. The arrows indicate putative excitatory connections (cholinergic) and the bar endings indicate putative inhibitory connections (GABAergic or glutamatergic). b, Overview of the circuit components for each mechanism in a. Activation of aIPg (1) provides additional excitatory input to downstream targets of LC10s, represented here by AOTU015 and AOTU023; (2) leads to disinhibition of inputs to the dendrites of LC10s through IB112; and (3) governs whether LC10a or LC10c is able to signal to their downstream targets by a toggle switch. This switch is operated by the TuTuA_1 and TuTuA_2 neurons, which provide inhibition to LC10c and LC10a, respectively. The line widths represent synaptic connections and are scaled according to the key. For cell types with more than one cell per brain hemisphere, the number of cells is indicated below the cell type. Additional details are provided in Extended Data Fig. 10.
Fig. 2
Fig. 2. Shared downstream targets of both aIPg and LC10s.
a, Shared downstream targets of aIPg and LC10-group cell types. Each target cell type is represented by a circle of which the diameter represents the total number of synapses that it receives from LC10-group cell types. AOTu cell types are indicated as numbers without the AOTU0 prefix. The proportion of those inputs coming from each LC10-group cell type is indicated in the pie chart. Postsynaptic sites from aIPg (orange) and LC10s (dark grey) on the outline of AOTU023 (dark green) are shown in the inset. b, CL053’s morphology (dark green) is shown with the position of input synapses from aIPg (orange) and LC11 (dark grey). c, Shared downstream targets of both aIPg and LC11 neurons outside of the optic lobe (OL). Each target cell is represented by a light green circle of which the diameter indicates the total number of LC11 synapses that the cell receives and of which the position on the y axis represents the percentage of its inputs coming from aIPg and its position on the x axis represents the percentage coming from LC11. This graph shows LC11’s top 51 targets outside the optic lobe, representing 74% of its synapses to other cell types outside the optic lobe. d, PVLP114’s morphology (dark green) is shown with the position of input synapses from aIPg (orange) and LC9 (dark grey). e, Shared downstream targets of aIPg and LC9 neurons outside of the optic lobe. Each target cell is represented by a light green circle. The diameter of each circle indicates the total number of LC9 synapses that the cell receives, the position on the y axis represents the percentage of its inputs coming from aIPg and the position on the x axis represents the percentage coming from LC9. This graph shows LC9’s top 54 targets outside the optic lobe representing 83% of its synapses to other cell types outside the optic lobe. For a, b and d, scale bars, 50 μm.
Fig. 3
Fig. 3. LC10a is tuned to medium-sized moving objects and has a key role in female aggression.
a, Schematic of the experimental setup (top left) for presentation of moving dark rectangles of parameterized spatial dimensions (bottom left). Heat map representations and average traces (right) for individual LC9 and LC10a axons are shown across multiple animals. LC9: n = 4 female flies, n = 4 neurons; LC10a: n = 5 male flies, n = 7 neurons. b,c, The dendritic inputs input provided to LC10a (b) and LC10c (c) in the female and male by their top 10 input neurons as ranked in the male optic lobe. These inputs account for 31% and 40% of LC10a’s inputs in the female and male, respectively, and 56% and 61% of LC10c’s inputs in the female and male. d, Conspecific angular sizes experienced during male courtship and aIPg-induced female aggression. e, Schematic of the data analysis protocol, representing one of the experiments in f. f, The average time spent performing aggressive behaviours before and during stimulus periods in which a 30 s continuous green (9 mW cm−2) light stimulus was delivered (green circles). The average over three stimulus periods is shown for display purposes. The time course and non-activating temperature controls are shown in Extended Data Fig. 3a–c. The average for the pre-stimulus period was calculated using the 15 s before the first stimulus period. All datapoints are shown to indicate the range, and the top edge of the bar represents the mean. Data were pooled from six independent biological replicates, which included separate parental crosses and were collected on different days. Statistical analysis was performed using nonparametric Wilcoxon matched-pairs signed-rank tests; asterisks indicate significance compared with 0; ****P < 0.0001. Source Data
Fig. 4
Fig. 4. Polysynaptic connections from aIPg to the lobula shape aggressive behaviours.
a, Postsynaptic sites from aIPg (orange) and presynaptic sites of IB112 going to its downstream targets (yellow) in the lobula are shown on the neuronal outline of IB112 (dark blue). Scale bar, 50 μm. b, Overview of the strong connections between aIPg, IB112, Li22, LC10a and LC10c neurons. IB112 is aIPg’s second strongest downstream target and receives 4.3% of its input from aIPg. Note that IB112 is named LoVC1 in the male optic lobe and cL14 in FlyWire, datasets. The lobula interneuron Li22 (named Li01in the FlyWire dataset) is IB112’s top downstream target, receiving over 40% of its output synapses (53% in males and 42% in females) in the optic lobe. Li22 cells receive 5.7% of their input from IB112 in the male optic lobe and 7.1% in the female optic lobe. Li22 provides 3.5% of LC10a, 1.1% of LC10b, 5.1% of LC10c and 5.9% of LC10d dendritic inputs in the male, and 3.5%, 0.8%, 4.9% and 5.3% in the female. c, The average time spent performing aggressive behaviours before and during stimulus periods in which a 30 s continuous green (9 mW cm−2) light stimulus was delivered. All datapoints are shown to indicate the range, and the top edge of the bar represents the mean. The time course and non-activating temperature controls are shown in Extended Data Fig. 5c–e. In the diagram in b, cell types inactivated with GtACR are circled in yellow and those activated with TrpA are circled in red. IB112 and the relevant lobula interneurons are glutamatergic and are presumed inhibitory (Extended Data Fig. 4h). Data were pooled from five biological replicates, which included separate parental crosses and were collected on different days. Statistical analysis was performed using nonparametric Wilcoxon matched-pairs signed-rank tests; asterisks indicate significance compared with 0; ***P < 0.001. Source Data
Fig. 5
Fig. 5. aIPg selectively amplifies LC10a, while dampening LC10c transmission through TuTuA neurons.
a, The connectivity between aIPg, TuTuAs, LC10a and LC10c in one brain hemisphere. Synapse numbers are indicated on the arrows. TuTuAs connect to specific LC10s: 98% of TuTuA_1’s synapses onto LC10s go to LC10c and 98% of TuTuA_2’s synapses go to LC10a. TuTuA_1 and TuTuA_2 make <1% of their synapses onto LC10b, LC10d, LC10e or LC10f. The arrows indicate putative excitatory connections (cholinergic) and the bar endings indicate putative inhibitory connections (SMP054, GABAergic; TuTuA_1 and TuTuA_2, glutamatergic). b, Predicted outcomes for circuit dynamics based on aIPg activity. Cells and connections with higher predicted activity are displayed in bold font and dark colours. c,d, Synapses between TuTuA_1, TuTuA_2, LC10a and LC10c on representative skeletons for LC10c (c) and LC10a (d). Note how inhibitory synapses from the TuTuA neurons are interspersed with LC10s’ output synapses. e, Excitatory responses recorded from TuTuA_1 (n = 16 cells) in female brain explants in response to a 2 ms stimulation of aIPg neurons (72C11-LexA > Chrimson). The excitation was largely abolished by mecamylamine, an n-AchR blocker. No evoked response was recorded when stimulating Chrimson in the absence of a LexA driver (n = 5; bottom right). Individual trials are shown in purple (n = 8 trials from 1 cell) and the mean is shown in black. f, Inhibitory responses recorded from TuTuA_2 (n = 16 cells) to a 2 ms stimulation of aIPg neurons. The inhibition was completely removed by mecamylamine. No evoked response was recorded when stimulating Chrimson in the absence of a LexA driver (n = 5; bottom right). Individual trials are shown in pink (n = 8 trials from 1 cell) and the mean is shown in black. In the diagrams above the traces, cell types activated with LexAop-Chrimson are circled in red and those recorded from are shown in in purple or pink depending on the TuTuA cell type. For c and d, scale bars, 50 μm, and 5 μm in the inset images.
Fig. 6
Fig. 6. Selective modulation of TuTuA_1 and TuTuA_2 shapes female aggression and male courtship.
a,b, The average time spent performing aggressive behaviours before and during periods in which a 30 s continuous green (9 mW cm−2) or red (3 mW cm−2) light stimulus was delivered. The time course and non-activating temperature controls are shown in Extended Data Fig. 8a–f. The 10 s (a (left)) or 30 s (a (right) and b) before each stimulus period was compared to average aggression during the same time intervals across all three stimulus periods. The empty > GtACR control in b displayed a small change in aggression after stimulation, but in the opposing direction to the experimental group. Experiments were performed as shown in Fig. 3e. All datapoints are shown to indicate the range and the top edge of the bar represents the mean. Cell types inactivated with GtACR are circled in yellow and those activated with either TrpA or Chrimson are circled in red. Data were pooled from six (a (left)) and three (a (right) and b) biological replicates. c, Schematics of the visual virtual reality preparation for male courtship (left, adapted from ref. ) and circuit activity during male courtship pursuit (right) are shown. The identity of cell types indicated by question marks are not known. Responses of TuTuAs (centre, average ∆F/F0) to a visual target during periods of courtship pursuit (purple or pink) or during general locomotion (black). The mean is represented as a solid line, and the shaded bars represent standard error between experiments (TuTuA_1-SS1: n = 4 (courting), n = 9 (running); TuTuA_2-SS1: n = 5 (courting), n = 6 (running) flies). The black line above indicates when the visual target was oscillating. Statistical analysis was performed using nonparametric Wilcoxon matched-pairs signed-rank tests; asterisks indicate significance compared with 0; *P < 0.05. Source Data
Extended Data Fig. 1
Extended Data Fig. 1. Pathways carrying visual information are important for female aggressive behaviours and related behavioural features.
(a) Percentage of flies engaging in aggressive behaviours, touching, and changes in parameters related to distance to another fly and the maximum angle of the field of view occluded by the closest fly (angle occluded by nearest fly) are plotted over the course of a trial during which a three 30 s 3 mW/cm2 continuous red-light stimulus (red bars) were delivered. Low intensity stimuli (1 mW/cm2; not shown) produced lower levels of aggression in the aIPg-SS > Chrimson group and no significant changes in the no visual cues (NorpA−/−) groups. The mean is represented as a solid line and shaded bars represent standard error between experiments. (b) Average time spent performing aggressive behaviours before and during stimulus periods. All data points are shown to indicating the range and top edge of bar represents the mean. Each dot represents one experiment containing approximately seven flies. Data supporting the plots shown in panels a–b were as follows: aIPg-SS > Chrimson, n = 6 experiments; NorpA−/− EmptySS > Chrimson, n = 6 experiments; NorpA−/− aIPg-SS > Chrimson, n = 7 experiments. Data are representative of two biological replicates, which included separate parental crosses and were collected on different days. A non-parametric Wilcoxon Matched-pairs Signed Rank test was used for statistical analysis. Asterisk indicates significance from 0: *p < 0.05. Source Data
Extended Data Fig. 2
Extended Data Fig. 2. LC visual feature detection.
Panels a–d show the receptive fields for LC9 and LC10a. Panels e – f show the visual experience during male courtship and female aggression. (a–b) Single receptive-field mapping for individual LC axons in representative flies. LC9 and LC10a axonal regions of interest are coloured in magenta and blue, respectively and overlaid on averaged calcium image (left; scale bar: 10 μm). Individual calcium responses, arranged as in Fig. 3a, are shown on right. (c) Single-cell (colour) and population average (black) calcium traces for neurons responding to looming stimuli centred on the receptive field, same as performed in. LC9: n = 4 female flies, n = 4 neurons. LC10a: n = 5 male flies, n = 7 neurons (25°/s constant edge speed looming was only recorded for 2 neurons from 1 fly). (d) Size tuning, as measured and plotted in Fig. 3a, for objects of varying sizes moving at a slower speed of 50°/s. (e–f) (e) Histogram shows conspecific angular position in the visual field as experienced by the male during courtship pursuit. All possible angular heights and widths for a female with a minor axis of 1 mm and major axis of 3 mm are plotted. (f) Histograms of angular position and velocity during aIPg-mediated female aggression (left) and naturalistic male courtship pursuit (right).
Extended Data Fig. 3
Extended Data Fig. 3. LC involvement in female aggressive behaviours.
(a) Legend for panels b–g. (b–c, e–f) Percentage of flies engaging in behaviours (aggression, touch) or behavioural features (distance to other, angle occluded by nearest fly, number of flies close) over the course of a trial during which three 30 s continuous light stimuli (yellow bars) were delivered. To control for additional cell types in the LexA line used for aIPg, we simultaneously inhibited aIPg during thermogenetic activation through using an aIPg-specific split-GAL4 line and the green light gated anion channel, GtACR. The dramatic reduction in female aggressive behaviour during optogenetic inhibition confirmed that aIPg was primarily responsible for the aggression observed when stimulating the LexA > TrpA line. (d) The mean number of flies close (pink region in the diagram shown in inset image, 1 body length = ~3 mm) was calculated during the aggression bouts performed in the stimulus periods shown in c. (g) Average time spent performing aggressive behaviours before and during stimulus periods in which a 30 s continuous green (9 mW/cm2) light stimulus was delivered (stimulus on, green dot). All data points are shown to indicate the range and the top edge of bar represents the mean. Data were pooled from eight biological replicates, which included separate parental crosses and were collected on different days. Data supporting the plots shown in panels b – e were as follows: b: aIPg-LexA > TrpA emptySS > GtACR, n = 16 experiments; aIPg-LexA > TrpA aIPg-SS > GtACR, n = 11 experiments; aIPg-LexA > TrpA LC10a-SS > GtACR, n = 16 experiments; aIPg-LexA > TrpA LC10bc-SS > GtACR, n = 10. c – d: aIPg-LexA > TrpA emptySS > GtACR, n = 26 experiments; aIPg-LexA > TrpA aIPg-SS > GtACR, n = 26 experiments; aIPg-LexA > TrpA LC10a-SS > GtACR, n = 23 experiments; aIPg-LexA > TrpA LC10bc-SS > GtACR, n = 23. e: aIPg-LexA > TrpA emptySS > GtACR, n = 19 experiments; aIPg-LexA > TrpA aIPg-SS > GtACR, n = 15 experiments; aIPg-LexA > TrpA LC9-SS > GtACR, n = 6 experiments; aIPg-LexA > TrpA LC11-SS > GtACR, n = 12; aIPg-LexA > TrpA LC15-SS > GtACR, n = 5. experiments. Experiments were performed at a temperature that activates TrpA (31 °C) in c – d, f – g for aIPg > TrpA stimulation; and non-activating temperature controls (22 °C) are shown in b and e. The mean is represented as a solid line and shaded bars represent standard error between experiments. The timeseries shows the percentage of flies performing aggression displayed as the mean of 0.35 s (60-frame) bins. Box-and-whisker plots show median and IQR; whiskers show range. A Kruskal-Wallis and Dunn’s post hoc test (d) or non-parametric Wilcoxon Matched-pairs Signed Rank test (g) were used for statistical analysis. Asterisk indicates significance from 0: *p < 0.05, **p < 0.01, ****p < 0.0001. Source Data
Extended Data Fig. 4
Extended Data Fig. 4. Anatomy of GAL4 driver lines for IB112.
(a, b) Expression patterns in a female and male brain, respectively, of GAL4 line SS81529 (IB112-SS1). (c, d) Expression patterns in a female and male brain, respectively, of GAL4 line SS81571 (IB112-SS2). (e) IB112 body ID 703106626 skeleton from hemibrain v1.2.1 shown together with a neuron from SS81529 obtained by stochastic labelling and then segmented using VVD viewer (see Supplementary Table 1). (f, g) Images of the expression patterns in the brain and VNC of GAL4 driver lines SS81529 and SS81571, as indicated. (h) Images of fluorescent in situ hybridization assays to determine the neurotransmitter used by IB112. Probes used in each panel are indicated. GFP shows the IB112 cell body and Glu and GABA represent probes for vGlut and GAD, respectively (see Methods for details). Scale bar is shown in the left panel.
Extended Data Fig. 5
Extended Data Fig. 5. IB112 shapes aIPg-mediated female aggressive behaviours.
(a) Excitatory responses recorded by patch clamp electrophysiology in female brain explants from IB112 (n = 6 cells) before, during, and following a 15 ms activation of aIPg. Individual trials in blue (n = 8 trials from one cell), mean shown in black. No evoked response was recorded when stimulating Chrimson in the presence of mecamylamine or in the absence of a LexA driver (n = 5, bottom right). (b) Changes in fluorescence intensity as measured by GCaMP6f in the cell body of IB112 to two 14 s optogenetic stimuli (2 s interval) at 10 Hz (n = 6). No changes in fluorescence intensity were recorded when stimulating with Chrimson alone (n = 3). Individual trials are shown in blue and the mean is in black. (c–e) Percentage of flies engaging in aggression, touch, or changes in related parameters, including the maximum angle of the field of view occluded by the closest fly (angle occluded by nearest fly) or distance to another fly. Legend for figures d–e is shown in c. Percentages are plotted over the course of a trial during which three 30 s 9 mW/cm2 continuous light stimuli (yellow bars) were delivered. The mean is represented as a solid line and shaded bars represent standard error between experiments. The timeseries shows the percentage of flies performing aggression displayed as the mean of 0.35 s (60-frame) bins. Data supporting the plots shown in panels d–e were as follows: d: aIPg-LexA > TrpA emptySS > GtACR, n = 17 experiments; aIPg-LexA > TrpA aIPg-SS > GtACR, n = 10 experiments; aIPg-LexA > TrpA IB112-SS1 > GtACR, n = 4 experiments; aIPg-LexA > TrpA IB112-SS2 > GtACR, n = 5 experiments. e: aIPg-LexA > TrpA emptySS > GtACR, n = 22 experiments; aIPg-LexA > TrpA aIPg-SS > GtACR, n = 22 experiments; aIPg-LexA > TrpA IB112-SS1 > GtACR, n = 17 experiments; aIPg-LexA > TrpA IB112-SS2 > GtACR, n = 20 experiments. Experiments performed at a temperature that activates TrpA (31 °C) e for aIPg > TrpA stimulation, and non-activating temperature controls (22 °C), are shown in d. Data were pooled from four biological replicates, which included separate parental crosses and were collected on different days. Source Data
Extended Data Fig. 6
Extended Data Fig. 6. Anatomy of TuTuA cell types.
(a–e) Neuronal skeletons of the termini of the contralateral axons of TuTuAs from the hemibrain v1.2.1 connectome. (a) TuTuA_1 and TuTuA_2 are shown together (body IDs 676836779 and 5813013691, respectively). (b) TuTuA_1 (body ID 676836779) shown alone. (c) Same as panel a, but rotated 90 degrees along the medial-lateral axis. (d) TuTuA_2 (body ID 5813013691) shown alone. (e) Same as panel c, repeated to facilitate comparison. These anatomical differences were used to determine the correspondence between GAL4 driver lines and TuTuA subtypes. (f) Terminus of a contralateral axon of a neuron from GAL4 driver line SS77402 obtained by stochastic labelling and then segmented using VVD viewer (see Supplementary Table 1). (g) The comparison between the GAL4 driver line in f to TuTuA_1 skeleton shown in b. (h) Same as panel g, but rotated 90 degrees along the medial-lateral axis. (i) The comparison between the GAL4 driver line in f to TuTuA_2 skeleton shown in d. (j) Same as panel i but rotated 90 degrees along the medial-lateral axis. (k) Terminus of a contralateral axon of a neuron from GAL4 driver line SS77462 obtained by stochastic labelling and then segmented using VVD viewer. (l) The comparison between the GAL4 driver line in k to TuTuA_1 skeleton shown in b. (m) Same as panel g, but rotated 90 degrees along the medial-lateral axis. (n) The comparison between the GAL4 driver line in k to TuTuA_2 skeleton shown in d. (o) Same as panel n, but rotated 90 degrees along the medial-lateral axis. (p, r) Images of GAL4 driver line SS77402 in females and males, respectively, shown with the standard neuropil reference, JFRC2018U. Note the presence of a single TuTuA cell body in each brain hemisphere. (q, s) Images of GAL4 driver line SS77462 in females and males, respectively. Note the presence of a single TuTuA cell body in each brain hemisphere. (t–v) Images of the expression patterns in the brain and VNC of GAL4 driver lines SS77402, SS77462 and SS10166, as indicated. (w) Images of fluorescent in situ hybridization assays to determine the neurotransmitter used by TuTuA_1. Probes used in each panel are indicated. GFP shows the TuTuA_1 cell and Glu and GABA represent probes for vGlut and GAD, respectively (see Methods for details). Scale bar is shown in the left panel.
Extended Data Fig. 7
Extended Data Fig. 7. Responses of TuTuA subtypes to the activation of female aggression or LC10a cell types.
(a–e) Changes in fluorescence intensity as measured by GCaMP6f in the cell body of TuTuA_1 (a, c) or TuTuA_2 (b, d) in response to two 14 s optogenetic stimuli (2 s interval) at 10Hz (n = 3 – 4). (e) No changes in fluorescence intensity were recorded when stimulating with Chrimson alone (n = 4). Individual trials for a – e are shown in purple (TuTuA_1) or pink (TuTuA_2), mean is in black. (f) Connectivity diagram from Fig. 5a with the connections from pC1d and pC1e. Synapse numbers are indicated on the arrows, which are also scaled according to synapse counts. Arrows indicate putative excitatory connections (cholinergic) and bar endings indicate putative inhibitory connections (SMP054, GABAergic; TuTuA_1 and TuTuA_2, glutamatergic). (g–j) Electrophysiology recordings with the cell types activated with Chrimson are circled in red, and those recorded are in black. Individual trials are in pink (n = 8 trials from 1 cell), mean is in black. (g) Small excitation or negligible response in TuTuA_2 (n = 5 cells) to 15 ms pC1d activation, which was abolished by mecamylamine. (h) Large inhibitory response in TuTuA_2 to 15 ms pC1e activation, which was abolished by mecamylamine (n = 6 cells). (i) Large inhibitory response in TuTuA_2 to 15 ms pC1d/e activation, which was abolished by mecamylamine (n = 8 cells). (j) No evoked response was recorded when stimulating Chrimson in the absence of a LexA driver (n = 6). (k) Latency after stimulus onset (ms). Box-and-whisker plots show median and IQR; whiskers show range. A Kruskal-Wallis and Dunn’s post hoc test was used for statistical analysis. Asterisk indicates significance from 0: ***p < 0.001. Source Data
Extended Data Fig. 8
Extended Data Fig. 8. The TuTuA switch shapes female aggressive behaviours.
(a–c, e–f) Percentage of flies engaging in behaviours (aggression, touch) or behavioural features (distance to other, angle occluded by nearest fly) over the course of a trial during which three 30 s continuous light stimuli (yellow or red bars) were delivered. Experiments were performed at a temperature that activates TrpA (31 °C, a–c) for aIPg > TrpA stimulation; and non-activating temperature controls (22 °C) are shown in e. (d) Percentage of flies engaging in aggression over the course of a trial during which three 30 s continuous 3 mW/cm2 red light (red bars) were delivered. Data were pooled from three biological replicates, which included separate parental crosses and were collected on different days. Data supporting the plots shown in panels a–f were as follows: a: aIPg-LexA > TrpA emptySS > GtACR, n = 23 experiments; aIPg-LexA > TrpA aIPg-SS > GtACR, n = 22 experiments; aIPg-LexA > TrpA TuTuA_1-SS > GtACR, n = 24 experiments. b: aIPg-LexA > TrpA emptySS > Chrimson, n = 19 experiments; aIPg-LexA > TrpA TuTuA_2-SS1 > Chrimson, n = 20 experiments. c, d: aIPg-LexA > TrpA emptySS > Chrimson, n = 12 experiments; aIPg-LexA > TrpA TuTuA_2-SS2 > Chrimson, n = 13 experiments. e (top panel): aIPg-LexA > TrpA emptySS > GtACR, n = 14 experiments; aIPg-LexA > TrpA aIPg-SS > GtACR, n = 5 experiments; aIPg-LexA > TrpA TuTuA_1-SS, n = 14 experiments. e (bottom panel): aIPg-LexA > TrpA emptySS > Chrimson, n = 8 experiments; aIPg-LexA > TrpA TuTuA_2-SS1 > Chrimson, n = 11 experiments. f: emptySS > GtACR, n = 20 experiments; TuTuA_2-SS1 > GtACR, n = 20 experiments. The mean for a–c and d–f is represented as a solid line and shaded bars represent standard error between experiments. The timeseries shows the percentage of flies performing aggression displayed as the mean of 0.35 s (60-frame) bins. Averages were calculated over all flies in an experiment, with each dot representing one experiment containing approximately seven flies. All data points are shown to indicating the range and top edge of bar represents the mean. A non-parametric Wilcoxon Matched-pairs Signed Rank test (d) was used for statistical analysis. Asterisk indicates significance from 0: **p < 0.01. Source Data
Extended Data Fig. 9
Extended Data Fig. 9. Recordings from TuTuA_1 and TuTuA_2 in males and females.
(a) Each trace is one-minute recording from one cell. TuTuA_1 displayed the larger action potential amplitude compared to TuTuA_2. Inset recording from a TuTuA_2 neuron is from the highlighted region of the last male recording. (b) Analysis of the firing frequency and peak amplitude of TuTuA_1 and TuTuA_2 recordings in males and females. The instantaneous action potential frequency was calculated for about one minute in each cell (TuTuA_1: Female, n = 1536, Male, n = 1965; TuTuA_2: Female, n = 1198, Male, n = 1185). The action potential amplitude was averaged from 20–30 individual events in each cell (each dot represents 1 cell) and measured as the difference between the threshold and peak (TuTuA_1: Female, n = 9, Male, n = 4; TuTuA_2: Female, n = 8, Male, n = 4). The firing frequency was more variable in the TuTuA_1 recordings than in the TuTuA_2 recordings in both males and females. Additionally, the amplitude from TuTuA_1 was larger compared to TuTuA_2 in both males and females. However, the action potential is dramatically slower in male TuTuA_2 neurons. Box-and-whisker and violin plots show median and IQR; whiskers or ends of the violin show range. Source Data
Extended Data Fig. 10
Extended Data Fig. 10. Circuit diagram of aIPg modulation of visual processing.
A detailed circuit map of the mechanisms detailed in Fig. 1b. This diagram shows additional downstream targets of aIPg including those involved in regulating information flow from LC9 and LC11. The diagram also illustrates that CL053, PVLP114, AOTU015 and AOTU023 are each upstream of descending interneurons (DNs) that traverse the neck into the ventral nerve cord where they likely regulate motor action. Each of these neurons connect to largely non-overlapping sets of DNs,,, implying that these parallel pathways control different motor actions. Cell numbers are listed under cell type name and the number of synapses between cell types are listed on the arrows. Numbers within arrows indicate synapses numbers. The top six downstream targets of aIPg are represented in this diagram: (1) PVLP114; (2) IB112; (3) SMP054; (4) SIP017; (5) CL053; and (6) AOTU015. In the male OL, Li22 devotes about 40% of its output synapses to LC10-group cell types and provides input to all LC10-group cell types. On average, the number of Li22 inputs to individual cells in each of the LC10-group cell types are as follows: LC10a, 23; LC10b, 12; LC10c, 27; LC10d, 32; LC10e, 4; and LoVP76/LC10f, 0 in males and LC10a, 8; LC10b, 6; LC10c, 14; LC10d, 15; LC10e, 1.4 and LC10f 1.5 in females. Synapse counts shown are from hemibrain data except IB112 to Li22 and Li22 to LC10s, which were from FlyWire.

Update of

References

    1. Currier, T. A., Pang, M. M. & Clandinin, T. R. Visual processing in the fly, from photoreceptors to behavior. Genetics224, iyad064 (2023). - PMC - PubMed
    1. Longden, K. D., Rogers, E. M., Nern, A., Dionne, H. & Reiser, M. B. Different spectral sensitivities of ON- and OFF-motion pathways enhance the detection of approaching color objects in Drosophila. Nat. Commun.14, 7693 (2023). - PMC - PubMed
    1. Goodale, M. A. & Milner, A. D. Separate visual pathways for perception and action. Trends Neurosci.15, 20–25 (1992). - PubMed
    1. Shinomiya, K., Nern, A., Meinertzhagen, I. A., Plaza, S. M. & Reiser, M. B. Neuronal circuits integrating visual motion information in Drosophila melanogaster. Curr. Biol.32, 3529–3544 (2022). - PubMed
    1. Perge, J. A., Borghuis, B. G., Bours, R. J. E., Lankheet, M. J. M. & van Wezel, R. J. A. Temporal dynamics of direction tuning in motion-sensitive macaque area MT. J. Neurophysiol.93, 2104–2116 (2005). - PubMed

LinkOut - more resources