. 2025 Jan;637(8048):1198-1206.
doi: 10.1038/s41586-024-08247-6. Epub 2024 Nov 20.

Liver X receptor unlinks intestinal regeneration and tumorigenesis

Affiliations

Liver X receptor unlinks intestinal regeneration and tumorigenesis

Srustidhar Das et al. Nature. 2025 Jan.

Abstract

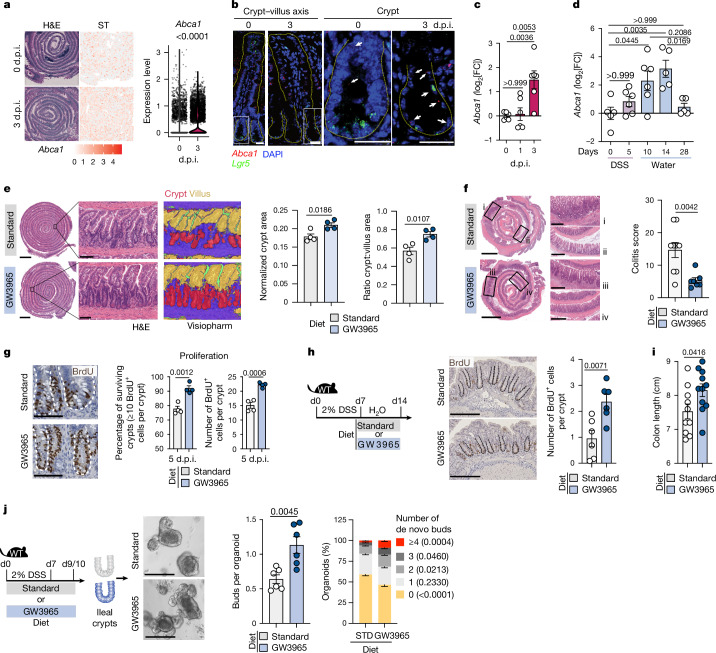
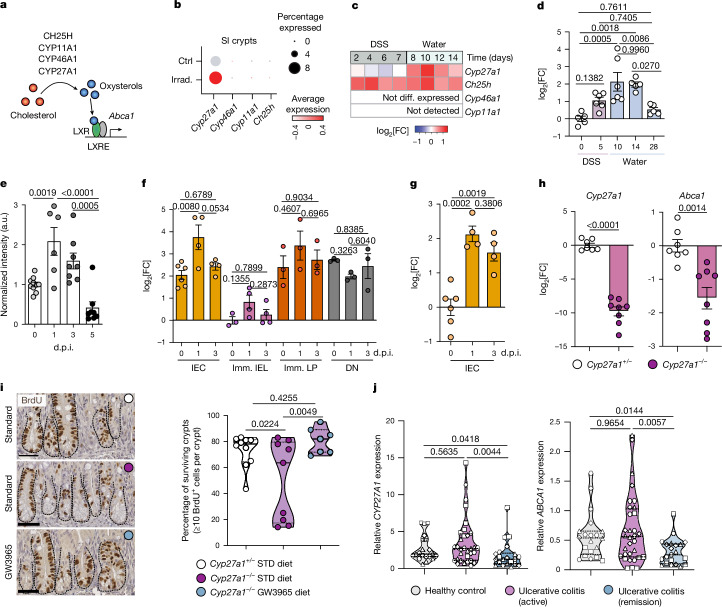
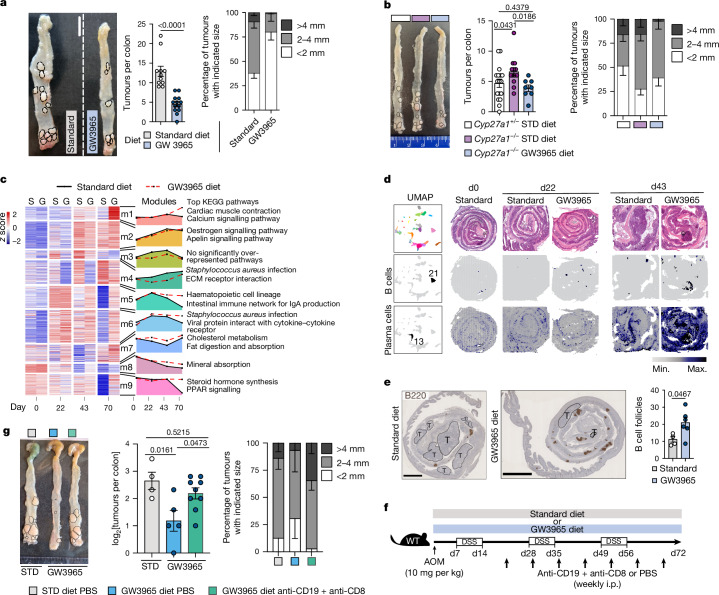
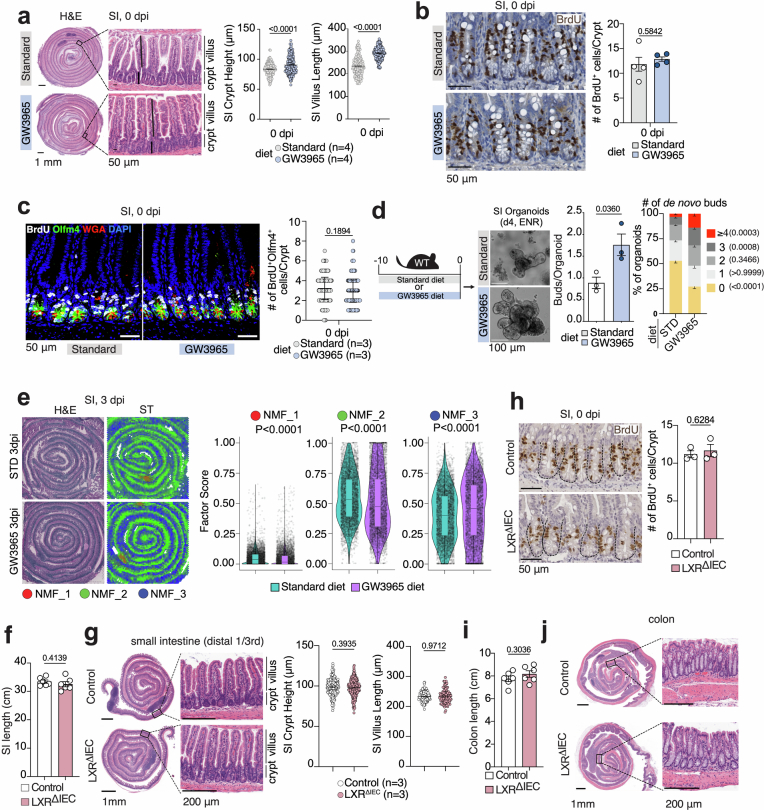
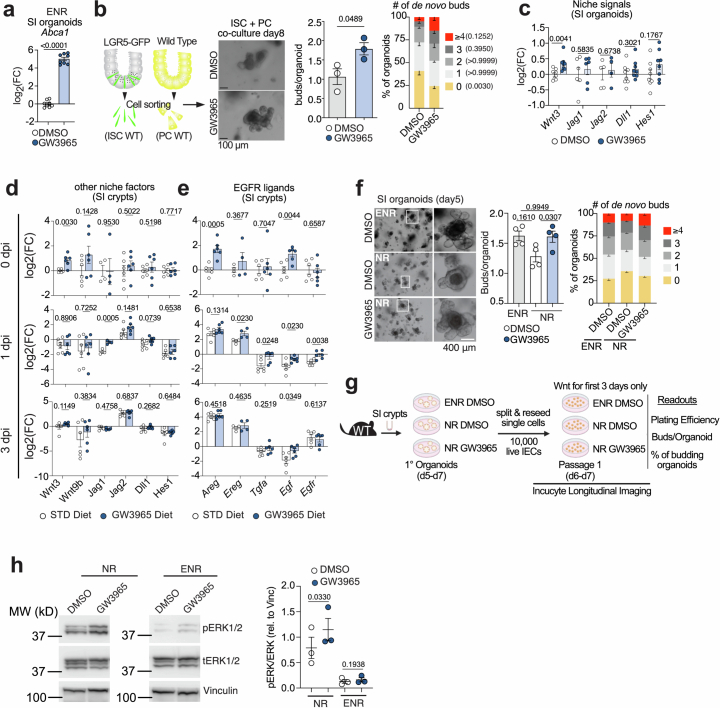
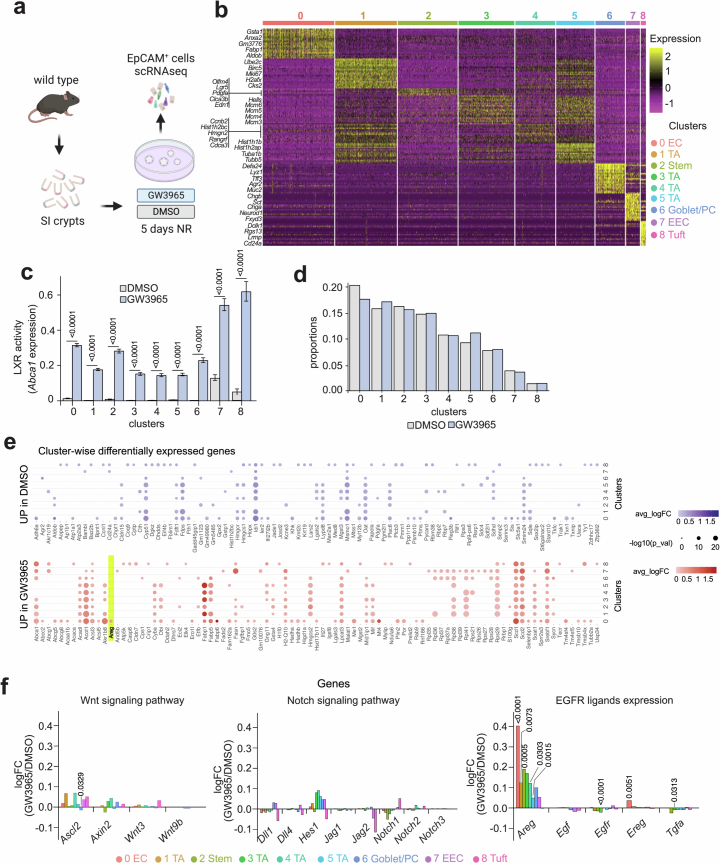
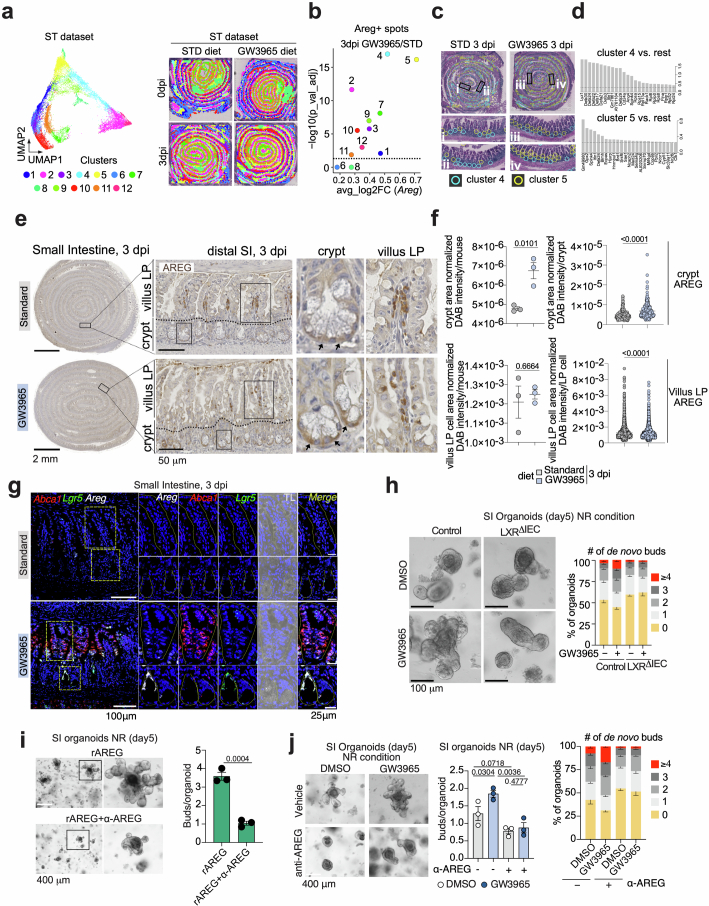
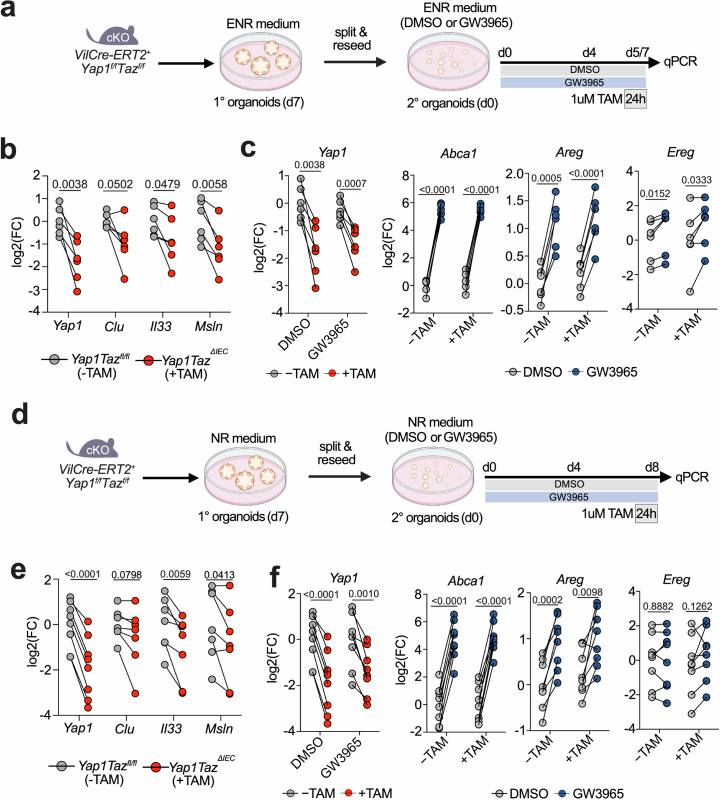
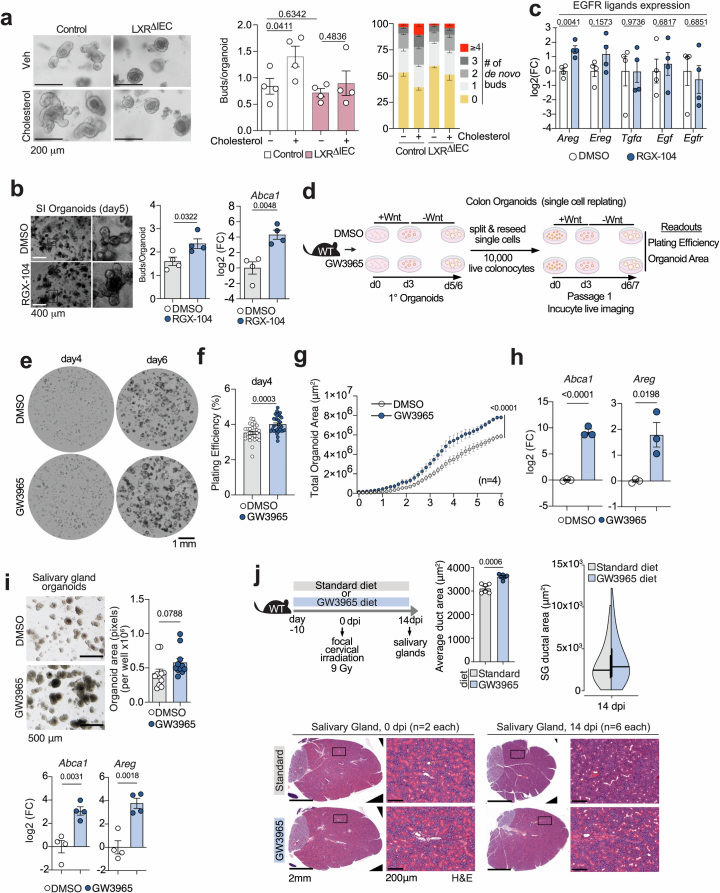
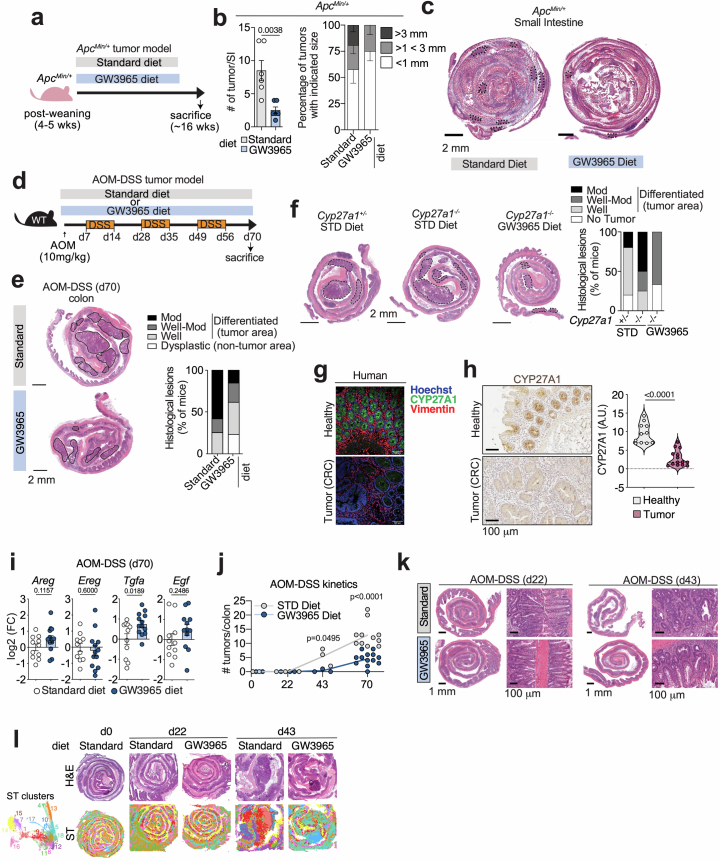
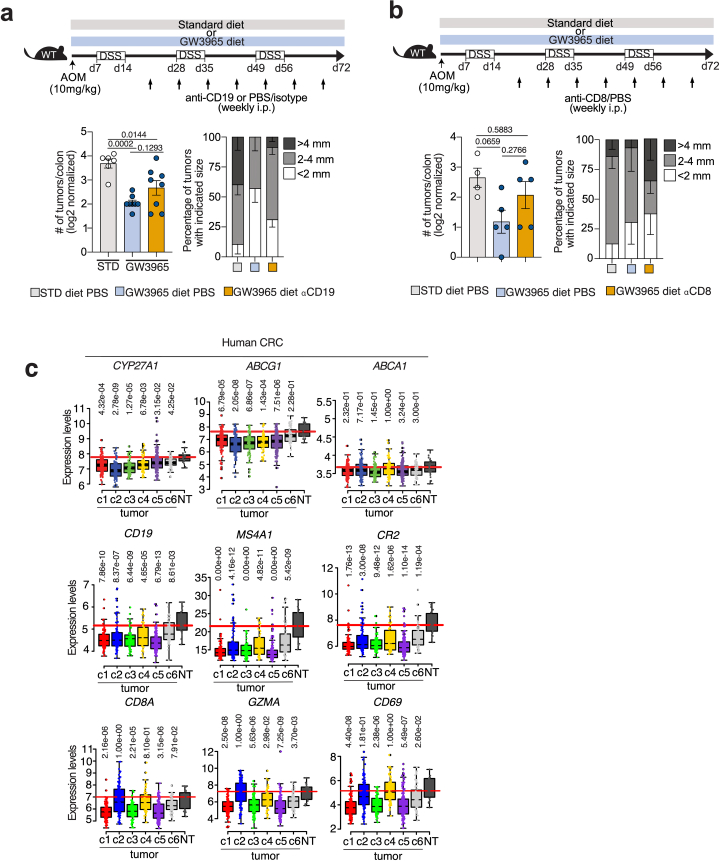
Uncontrolled regeneration leads to neoplastic transformation1-3. The intestinal epithelium requires precise regulation during continuous homeostatic and damage-induced tissue renewal to prevent neoplastic transformation, suggesting that pathways unlinking tumour growth from regenerative processes must exist. Here, by mining RNA-sequencing datasets from two intestinal damage models4,5 and using pharmacological, transcriptomics and genetic tools, we identified liver X receptor (LXR) pathway activation as a tissue adaptation to damage that reciprocally regulates intestinal regeneration and tumorigenesis. Using single-cell RNA sequencing, intestinal organoids, and gain- and loss-of-function experiments, we demonstrate that LXR activation in intestinal epithelial cells induces amphiregulin (Areg), enhancing regenerative responses. This response is coordinated by the LXR-ligand-producing enzyme CYP27A1, which was upregulated in damaged intestinal crypt niches. Deletion of Cyp27a1 impaired intestinal regeneration, which was rescued by exogenous LXR agonists. Notably, in tumour models, Cyp27a1 deficiency led to increased tumour growth, whereas LXR activation elicited anti-tumour responses dependent on adaptive immunity. Consistently, human colorectal cancer specimens exhibited reduced levels of CYP27A1, LXR target genes, and B and CD8 T cell gene signatures. We therefore identify an epithelial adaptation mechanism to damage, whereby LXR functions as a rheostat, promoting tissue repair while limiting tumorigenesis.


Conflict of interest statement

Competing interests: E.J.V. has received research grants from F. Hoffmann-La Roche and is a founder of PaperVids. S.D. works as a consultant for Cellphi Biotechnology. The other authors declare no competing interests.

Figures

Fig. 1
Fig. 1. LXR activation in vivo promotes intestinal regeneration in response to damage.
a, Haematoxylin and eosin (H&E) staining and Abca1 transcript levels in 0 and 3 d.p.i. SI Swiss rolls. The Abca1 levels in the tissue (left) and quantification per spot (right) are shown. ST, spatial transcriptomics. b, RNA scope analysis of Abca1 and Lgr5 transcripts at 0 and 3 d.p.i. in the SI. The white arrows in magnified crypts indicate Abca1 transcripts. Scale bars, 25 μm. c,d, Abca1 expression in SI crypts at 0, 1 and 3 d.p.i. (c) and ileal crypts of DSS-treated WT mice (d). e, H&E images and Visiopharm artificial intelligence deconvolution showing crypt (red) and villi (yellow) (left). Quantification of the normalized crypt area and crypt:villus area (right) of distal SI from standard (STD)-diet-fed and GW3965-fed WT mice at 5 d.p.i. is shown. Scale bars, 2 mm (left) and 100 μm (right). f, H&E images of colon Swiss rolls and histopathological assessment after recovery (day 14 (d14)) from DSS treatment in WT mice fed with standard or GW3965 diet. Scale bars, 2 mm (left) and 500 μm (right). g, BrdU-stained images and quantification of the percentage of surviving crypts and BrdU+ cells per crypt in the distal SI at 5 d.p.i. Scale bars, 100 μm. h,i, Experimental schematic (left) and staining and quantification of BrdU+ cells per colonic crypt (right) (h) and colon length (i) at day 14 after DSS treatment. Scale bars, 200 μm (h). j, Schematic of the experiment (left). Representative ileal organoid (day 5) images with quantification of average buds per organoid and the percentage of organoids with the indicated number of buds. Scale bars, 200 μm. Data are representative of one (a,b), two (dh) or three (c,i,j) independent experiments with 4–10 mice per condition (each dot is a biological replicate). For cj, data are mean and s.e.m. P values were calculated using Wilcoxon tests (a), one-way analysis of variance (ANOVA) with Bonferroni’s test (c,d), unpaired two-tailed t-tests (ej) and two-way ANOVA with Bonferroni’s test (de novo buds in j). The dashed lines denote crypts and villi in the same plane. The diagrams in h and j were adapted from ref. , CC-BY 4.0. Source Data
Fig. 2
Fig. 2. LXR promotes intestinal regeneration by inducing epithelial amphiregulin.
a, Representative images and quantification of the surviving crypts in LXRΔIEC mice and littermate controls at 3 d.p.i. Scale bars, 100 μm. The diagram was adapted from ref. CC-BY 4.0. b, Representative images and quantification of buds per organoid and organoids with the indicated number of buds. Scale bar, 400 μm. c, EGFR ligand expression in SI organoids cultured in ENR medium as indicated. df, Representative images (d) and quantification of the plating efficiency at day 4 (e) and the number of buds per organoid and the percentage of budding organoids at day 6 (f) in secondary organoids cultured as indicated. Scale bar, 1 mm (d). gi, scRNA-seq analysis of organoids (n = 2 mice pooled per treatment) that were treated or not with GW3965 in NR medium. Uniform manifold approximation and projection (UMAP) cluster visualization (g), cluster-wise expression heatmap of the indicated genes (h) and cluster-wise relative fold change in Areg expression in GW3965 (G) over DMSO (D) (i). j, qPCR analysis of Abca1 and Areg in LXRΔIEC and control organoids cultured in ENR (circle symbols) or NR (square symbols) medium. k, The number of buds per organoid from LXRΔIEC and littermate controls with or without GW3965. l, Representative images, the number of buds per organoid and the frequencies of de novo buds of organoids from Areg−/− and littermate controls cultured in NR medium. Scale bars, 100 μm. Data are from one (gi), two (a), three (df,l), four (b,c,k) or nine (j) independent experiments with 3–9 mice per condition (each dot represents a biological replicate or well in e and f). For ac,e,f,jl, data are mean ± s.e.m. Significance was assessed using unpaired (a,c) or paired (buds per organoid in b,j) two-tailed t-tests; one-way ANOVA with Tukey’s test (e,f) or Fisher’s least significant difference (LSD) post hoc test (k and buds per organoid in l); two-way ANOVA with Bonferroni’s post hoc test (de novo buds in b) or Fisher’s LSD post hoc test (de novo buds in l). For i, significance was assessed by differential expression analysis using Wilcoxon rank-sum tests and subsampling of 150 cells per group. The dashed lines denote crypts in the same plane. E, EGF; N, Noggin; R, R-spondin; EC, enterocytes; GC, goblet cell; TA, transit amplifying cells; PC, Paneth cells; EEC, enteroendocrine cells. Source Data
Fig. 3
Fig. 3. CYP27A1 is upregulated during intestinal injury and promotes intestinal regeneration.
a, Schematic of cholesterol metabolism to oxysterols by the cytochrome P450 monooxygenase family of enzymes (CYPs) and its downstream action on LXR. b, The average expression (colour coded) and the percentage of cells (circle size) expressing oxysterol-producing enzymes in SI crypts at 0 (Ctrl) or 3 d.p.i. (irrad.). c, Heatmap of oxysterol-producing enzyme expression in whole-colonic tissue during DSS kinetics (log2-transformed fold change compared with day 0). Diff., differentially. d, qPCR analysis of Cyp27a1 in ileal crypts from DSS-treated WT mice. e, Immunohistochemical quantification of CYP27A1 in the SI of WT mice at the indicated d.p.i. f, qPCR analysis of Cyp27a1 in FACS-sorted EPCAM+ epithelial (IEC), CD45+ immune (imm. IEL and imm. LP) and EPCAMCD45 DN cells from WT mouse SI collected at the indicated  d.p.i. g, qPCR analysis of Abca1 in FACS-sorted IECs from WT mouse SI collected at the indicated d.p.i. IEL, intraepithelial lymphocyte; LP, lamina propria. h, qPCR analysis of Cyp27a1 and Abca1 in FACS-sorted IECs from Cyp27a1−/− mice and littermate control SI at 3 d.p.i. i, Representative images and quantification of BrdU+ surviving crypts from the SI at 3 d.p.i. Crypts in the same plane are marked by a dashed line. Scale bars, 50 μm. j, qPCR analysis of CYP27A1 and ABCA1 in human intestinal biopsies (collected from terminal ileum (square symbols), ascending colon (triangle symbols), transverse colon (diamond symbols) and sigmoid rectum (hexagon symbols)) from healthy control individuals (n = 28), and patients with active ulcerative colitis (UC) (n = 39) and ulcerative colitis in remission (n = 27). Data are representative of two (d,fh) or three (e,i) independent experiments with 3–10 mice per condition (each dot represents one biological replicate). Data are mean ± s.e.m. (dh) and median ± quartiles (i,j). Significance was assessed using unpaired two-tailed t-tests (h), one-way ANOVA with Tukey’s post hoc test (dg), Fisher’s LSD post hoc test (i) and nonparametric Kruskal–Wallis test with uncorrected Dunnett’s post hoc test (j). Source Data
Fig. 4
Fig. 4. LXR activation in vivo suppresses intestinal tumorigenesis.
a, Representative images and quantification of tumour numbers and size at day 70 of AOM–DSS-induced tumorigenesis in WT mice that were fed a standard or GW3965 diet. Scale bar, 1 cm. b, Representative images and quantification of tumour numbers and size at day 70 of AOM–DSS-induced tumorigenesis in Cyp27a1−/− and littermate controls fed as indicated. c, Longitudinal bulk RNA-seq analysis of mouse colon from AOM–DSS WT mice fed with standard (S) or GW3965 diet. Clustered heatmap of DEGs for the diet or diet:time interactions (likelihood ratio test, false-discovery rate (FDR) < 0.05), divided into modules of similar gene behaviour (left). Mean-scaled log-fold-change (compared with day 0) of each gene module (m1–m9) for each timepoint/diet group and the top KEGG pathways significantly enriched (adjusted P < 0.05) (right). d, The scores of selected B cell and plasma cell clusters from quantitative deconvolution of scRNA-seq data onto colon Swiss roll spatial transcriptomics from day 0 (standard diet), day 22 and day 43 (standard and GW3965 diet) AOM–DSS-treated mice. e, Representative images and quantification of B220 immunohistochemical staining of colons from AOM–DSS treated WT mice that were fed with standard or GW3965 diet at day 70. Scale bars, 2.5 mm. f,g, Schematic (f) and representative images and quantification of tumour numbers (log2 normalized) and sizes (g) from AOM–DSS-treated WT mice fed on a standard or GW3965 diet and treated with repeated intraperitoneal injections of anti-CD19 and anti-CD8 antibodies or PBS as shown in the schematic. Data are representative of 2–4 (a,b,e,g) independent experiments with 4–13 mice per condition (each dot represents one biological replicate); one experiment with 3–4 mice per timepoint for bulk RNA-seq (c); one mouse per timepoint from one experiment for spatial transcriptomics (d). For a,b,e,g, data are mean ± s.e.m. Significance was assessed using two-tailed unpaired t-tests (a,e) or one-way ANOVA with fisher’s LSD (b) and Tukey’s (g) post hoc test. The dashed lines denote tumours. The diagram in f was adapted from ref. , CC-BY 4.0. Source Data
Extended Data Fig. 1
Extended Data Fig. 1. LXR activation promotes intestinal regeneration without affecting tissue damage.
(a) Venn diagram showing differentially expressed genes (DEG) overlap between regenerative and steady state colonic tissue and small intestine (SI) crypts following DSS-induced colitis and irradiation, respectively. Kyoto Encyclopedia of Genes and Genomes (KEGG) pathway analysis from shared differentially expressed genes (DEGs) between colon and SI. d&a: digestion and absorption. (b) Scheme of the experimental procedures shown in Extended Data Figs. 1–3 and Fig. 1. Briefly, WT mice were fed with standard (STD) or GW3965-containing diet for 10 days and then subjected to 10 Gy total body irradiation (TBI, i.e., damage) and allowed to heal (for 1, 3 or 5 days) while still on modified diet. Alternatively, mice were fed STD or GW3965 diet and simultaneously administered DSS in drinking water for 7 days (i.e., damage) followed by 2–7 days of regular water (i.e., healing). As a readout for mucosal healing the intestinal tissue was harvested for histology, blind clinical scoring, spatial transcriptomics and/or organoid culture. (c) Abca1 and Abcg1 expression by qPCR from SI crypts of mice at 3 days post irradiation (3dpi) or from colonic tissue of mice at day 14 of DSS-induced colitis. Datasets for irradiation are normalized to crypts from 0dpi. (d-e) Cumulative (d) and stratified (e) histological score of colonic tissue at day14 after DSS treatment of mice fed STD or GW3965 diet. (f) Representative images (1dpi) and quantification of cleaved caspase 3+ (cCASP3+) cells/crypt in the distal SI at 0, 1 and 3 dpi. (g) Olfm4 expression by qPCR in SI crypt at 0, 1 and 3 dpi from STD or GW3965 diet fed mice. In panels c, e-g each dot represents one mouse, and the data are representative of two (d-f) or three (c and g) independent experiments. Data are shown as bar plots with mean ± s.e.m. in (c-g). Significance was assessed by unpaired two-sided t test between diet groups (c, e-g). Part of the schematic in panel b was drawn using BioRender.com. Source Data
Extended Data Fig. 2
Extended Data Fig. 2. Immune, epithelial, and stromal cell profiling upon 10 days of standard or GW3965-diet.
(a-b) Flow cytometry dot plots showing the gating strategy (a) and quantification (b) of the number of major immune cell subsets in the SI tissue of mice exposed to 10 days of standard or GW3965 diet. Cell numbers are not significantly different between diet groups in any immune cell subsets analysed. Each dot represents one mouse and data are representative of one experiment. Data are shown as bar plots with mean ± s.e.m. Unpaired two-sided t test between diet groups. The diagram was adapted from ref. , CC-BY 4.0. (c) Gating strategy and sorting scheme for epithelial (EpCAM+CD45), immune (EpCAM-CD45+) and stromal (i.e., DN, double negative, EpCAMCD45) cells processed for single cell RNA sequencing (scRNAseq). (d) UMAP distribution of scRNAseq datasets obtained from epithelial, immune and DN cells from SI of mice fed for 10 days with STD or GW3965 diet. (e-f) Left: unsupervised clustering and annotation of epithelial cells (e) and immune and stromal cells (f) in UMAP. Right: cells in the clusters shown to the left are colour-coded based on the diet treatment (e) and the combined cell compartment and diet (f). (g) Left: SI Swiss rolls shown in hematoxylin and eosin (H&E) staining and colour coded spatial transcriptomic (ST) map based on non-negative matrix factorization (NMF). Right: heatmap showing top 20 genes defining each NMF and respective annotations (i.e., NMF1: immune and intestinal epithelial cells (IEC), NMF2: muscle and NMF3: IEC). (h) Volcano plots showing the log2FC and adjusted p-values from differential expression analysis between SI scRNAseq samples from GW3965 diet- vs. STD-diet fed mice in immune, DN and epithelial cells. Genes known to be regulated by LXR are marked blue. (i) UMAP and violin plot showing expression of module scores based on genes belonging to the GO term “Inflammatory response” (GO:0006954) and their expression score in scRNAseq datasets of immune cells from STD and GW3965 samples. For scRNAseq experiment, epithelial, immune and DN cells were sorted from a pool of 3 mice. DEG were identified with Wilcoxon rank-sum test, subsampling 500 cells per group. For ST, one mouse per diet treatment was processed. MΦ, Macrophages; DC, Dendritic Cells; IEL, intra epithelial leucocytes; ILC, innate lymphoid cells; Mono, Monocytes; NΦ, Neutrophils. Source Data
Extended Data Fig. 3
Extended Data Fig. 3. LXR activation in steady state primes the tissue for improved regeneration upon challenge.
(a) Left: representative Hematoxylin & Eosin (H&E) stained Swiss rolls and zoomed inset of distal small intestine (SI) tissue from mice fed with STD or GW3965 diet for 10 days. Right: quantification of SI crypt height and villus length. Each dot represents an individual crypt or villus (n = 4 mice). (b) Representative pictures and quantification of the number BrdU+ cells/crypt after 2 h pulse in the distal SI of mice fed for 10 days with STD or GW3965 diet. Each dot represents one mouse. (c) Left: representative pictures of immunofluorescence staining of SI tissue from STD or GW3965-diet fed mice after a 2 h BrdU pulse. Right: quantification of proliferating intestinal stem cells/crypt. Proliferating intestinal stem cells (ISCs) were defined as BrdU+Olfm4+ cells located underneath the uppermost wheat germ agglutinin (WGA)+ Paneth cells. Each dot represents one crypt and data are representative of n = 3 mice/diet group. (d) WT mice were fed with STD or GW3965-diet for 10 days and SI crypts were extracted and plated for organoid culture in ENR media in absence of additional stimuli in vitro. Representative pictures of organoids at day4 and quantification of average number of buds/organoid and % of organoids with the indicated number of buds are shown on the right. Each dot represents one mouse. The diagram was adapted from ref. , CC-BY 4.0. (e) Left: SI Swiss rolls shown in H&E staining and colour coded spatial transcriptomic (ST) map based on non-negative matrix factorization (NMF). Right: Quantification showing relative factor score of each of the NMF obtained from the ST map. Samples are from WT mice fed with STD or GW3965-diet for 10 days and harvested at 3dpi after 10 Gy total body irradiation (TBI). (f) Quantification of SI length from Villin-Cre:LXRαf/fβf/f (LXRΔIEC) mice and their littermate LXRαβflox/flox controls. Each dot represents one mouse. (g) Representative H&E pictures and quantification of distal SI crypt and villus length from LXRΔIEC and littermate controls. Each dot represents one crypt or villus from n = 3 mice/group. (h) Representative pictures and quantification of the number BrdU+ cells/crypt after 2 h pulse from the distal SI of LXRΔIEC and littermate controls. Each dot represents one mouse. (i-j) Representative H&E picture and quantification of colon length from LXRΔIEC and littermate controls. Each dot represents one mouse. Data are representative of one (c, e, g, h and j), two (a, b, f and i) or three (d) independent experiments. Data are shown as bar plots with mean ± s.e.m. in (a-d, f-i). Significance was assessed by unpaired two-sided t test in a-c, d (buds/organoid) and f-i, two-way ANOVA with Bonferroni test in d (de novo buds) and Mann-Whitney test in e. Source Data
Extended Data Fig. 4
Extended Data Fig. 4. LXR activation upregulates EGFR ligands in IECs.
(a) qPCR analysis of Abca1 expression in organoids treated with either DMSO or GW3965 for 5 days in ENR culture medium. (b) Left: Scheme showing sorting of GFP+ intestinal stem cells (ISCs) from Lgr5-eGFP-creERT2 mice and Paneth cells (PCs) from WT (non-Lgr5) mice for organoid co-culture. Right: representative pictures and quantification of average number of buds/organoid and % of organoids with the indicated number of buds from ISC-PC organoid co-culture treated with either DMSO or GW3965. The diagram was adapted from ref. . (c) qPCR analysis of niche signals in SI organoids from WT mice treated with either DMSO or GW3965 in ENR culture medium. (d-e) qPCR analysis of niche factors (d) or EGFR ligands (e) in SI crypts isolated on day0, day1 and day3 post-irradiation from WT mice fed with either STD or GW3965 diet. Datasets for 1 and 3dpi are normalized to their corresponding 0dpi. (f) Representative pictures and quantification of average number of buds/organoid and percentage of organoids with the indicated number of buds in SI organoids cultured in ENR or NR (Noggin and R-spondin only) medium and treated with DMSO or GW3965. (g) Scheme of the experiment shown in Main Fig. 2d-f. Briefly, SI crypts were isolated from WT mice and cultured in ENR or NR media +/− GW3965 for 5–7 days (primary organoids). Organoids were then digested to single cell suspension and 10,000 live cells were re-seeded for secondary organoid culture. Secondary organoids were cultured in ENR or NR medium and stimulated with DMSO or GW3965 according to their treatment protocol in primary cultures. Secondary cultures were imaged longitudinally using Incucyte live imaging and plating efficiency, average number of buds/organoid and % of budding organoids was assessed at day 4–7 of culture. (h) Representative immunoblot of pERK1/2, tERK1/2 and vinculin from organoids cultured in ENR or NR and treated with either DMSO or GW3965. Western blot quantification of the ratio between phospho-ERK (pERK) and ERK (normalized to Vinculin) from organoids cultured for 5 days with DMSO or GW3965 in ENR or NR media. Vinculin was used as a loading control in the same gel as phospho- and total- ERK1/2 and was cut out to probe with anti-vinculin antibody due to molecular weight difference with tERK1/2 or pERK1/2. For gel source data, see Supplementary Fig. 3. Data are representative of three (b, d, e and h), four (a, c) independent experiments with 3–8 mice/group (each dot represents one mouse). Data are shown as mean ± s.e.m. (a-f, h). Significance was assessed by unpaired two-sided t test in a, b (buds/organoid) and c-e), paired two-sided t test (h), two-way ANOVA with Bonferroni test (b, de novo buds) and one-way ANOVA with Tukey’s post hoc test (f). Part of the schematic in panel g was drawn using BioRender.com. Source Data
Extended Data Fig. 5
Extended Data Fig. 5. scRNA sequencing of SI organoids treated with DMSO or GW3965.
(a) Schematic of experimental strategy for scRNAseq. (b) Heatmap showing expression of top 25 differentially expressed marker genes for each cluster, with 5 DEG symbols noted per cluster. (c) Log-transformed expression of LXR target gene Abca1 in each cluster comparing DMSO and GW3965 treated organoids. (d) Cluster-wise cellular proportions comparing DMSO and GW3965 treated organoids. (e) Dot plot showing cluster-wise differentially expressed genes between organoids treated with either DMSO or GW3965. The colour intensity indicates the average logFC induction (top: genes upregulated in DMSO treated organoids; bottom: genes upregulated in GW3965-treated organoids) and the size of the dot indicates the p-value. Differences were considered significant at logFC>0.2, p < 0.01 and difference in proportion of expressing cells>0.2. (f) Relative fold-change of genes in Wnt, Notch and EGFR signalling modules in GW3965 treated organoids over DMSO in each cluster of the scRNAseq dataset. Data are produced from one experiment (a-f). Data are presented as mean ± s.e.m. (c). Significance was assessed by expression analysis with Wilcoxon rank-sum test (c, e, f). The schematic in panel a was drawn using BioRender.com.
Extended Data Fig. 6
Extended Data Fig. 6. LXR activation induces Areg expression in the SI crypts in response to damage.
(a) Unsupervised clustering of the SI spatial transcriptomics (ST) datasets (UMAP on the left and spatial distribution on the right) from mice treated with STD or GW3965 diet at day0 or day3 post irradiation (dpi). (b) Differential expression (log2FC and -log10(p-value) shown) of Areg in Areg+ spots, calculated for each cluster, in GW3965-treated mice vs STD fed mice at 3dpi. Dashed line indicates P = 0.05. (c) Spatial distribution of top two Areg+ clusters (i.e., clusters 4 and 5) superimposed onto the H&E SI Swiss rolls from 3dpi STD and GW3965-diet fed mice. Marked with i-iv are insets magnified at the bottom. (d) Top 25 genes upregulated in ST clusters 4 and 5 compared to all other clusters. (e) Representative images of AREG immunohistochemistry of 3 dpi mouse SI highlighting AREG expression in the crypt epithelial cells (black arrows) and villus lamina propria (LP) cells. (f) Quantification of average DAB intensity (AREG expression) in the crypt (normalized to the respective crypt area) and in the Villus-LP (normalized to each DAB+ cell). In the plots on the left, each dot represents one mouse. In the plots on the right, each dot represents one crypt or villus LP cell. (g) RNA scope analysis of Abca1 (red), Lgr5 (green) and Areg (white) in the SI of WT mice fed with STD or GW3965-diet at 3 dpi. Crypt-villus view of the merged staining is shown on the left. Zoomed-in insets in the crypt and villus region with single or merged staining are shown on the right. (h) Representative pictures and quantification of % of organoids with indicated number of buds in SI organoids treated with DMSO or GW3965 from Villin-Cre:LXRαf/fβf/f (LXRΔIEC) mice and their littermate LXRαβflox/flox controls. (i) WT SI organoids were cultured for 5 days in NR medium with either recombinant AREG (rAREG) or rAREG together with anti-AREG antibody (α-AREG). Representative pictures and quantification of average number of buds/organoid. The boxed organoid is zoomed in on the right. (j) Representative pictures and quantification of average number of buds/organoid and % of organoids with the indicated number of buds from SI organoids treated with DMSO or GW3965 ± α-AREG in NR media for 5 days. Data are representative of one (a-d, g), two (e-f), three (i-j) or four (h) independent experiments and each dot represents one mouse (except for plots on the right in panel f). Data are shown as mean ± s.e.m. (f-j). Significance was assessed by unpaired two-sided t test (f, i) and by one-way ANOVA with Fisher’s LSD post hoc test (j, buds/organoid). Source Data
Extended Data Fig. 7
Extended Data Fig. 7. Yap-Taz is not necessary for LXR-dependent upregulation of Areg.
(a, d) Schematic representation of the experiment. Briefly, SI crypts from Villin-CreERT2 Yapflox/flox Tazflox/flox were cultured in ENR (a-c) or NR (d-f) media for 7 days and then split and re-plated for secondary organoid cultures. Secondary organoids were stimulated with DMSO or GW3965 and treated with tamoxifen (TAM) for the last 24 h of culture. (b, e) qPCR analysis of Yap1 and YAP-target genes in organoids treated or not with tamoxifen. (c, f) qPCR analysis of Yap1, Abca1, Areg and Ereg in organoids treated with DMSO or GW3965 ± tamoxifen. Data are representative of 4–6 independent experiments with 5–8 mice per group (each dot represents one mouse). Significance was assessed by paired two-sided t test. Part of the schematics in panel a and d was drawn using BioRender.com. Source Data
Extended Data Fig. 8
Extended Data Fig. 8. Effect of cholesterol and LXR signalling in organoids from multiple tissue types.
(a) Representative pictures, quantification of average number of buds/organoid and quantification of % of organoids with indicated number of buds in SI organoids treated with vehicle or cholesterol from Villin-Cre:LXRαf/fβf/f (LXRΔIEC) mice and their littermate LXRαβflox/flox controls. (b) WT SI organoids were cultured for 5 days in NR medium with either DMSO or RGX-104. Left: Representative pictures and quantification of average number of buds/organoid. Right: qPCR analysis of Abca1 expression. (c) qPCR analysis of the expression of EGFR ligands in organoids treated with either DMSO or RGX-104. (d) Scheme of the experiment shown in (e-g): WT colon primary organoids were cultured for 5-6 days with either DMSO or GW3965 (+exogenous Wnt for the first three days). Organoids were then split and 10,000 live colonocytes were re-seeded for secondary organoids, treated with DMSO or GW3965 (as in the primary cultures) for 6-7 days. Organoids were imaged longitudinally with Incucyte live imaging and plating efficiency, and organoid area was measured at the end of the experiment. (e-g) Representative pictures (e), quantification of plating efficiency (f) and total organoid area over time (g) of WT organoids as described in d. For organoid area analyses over time, same wells were imaged every 4 h for a peiod of 6-7 days. (h) qPCR analysis expression of Abca1 and Areg in colonic organoids treated with DMSO or GW3965. (i) WT salivary gland organoids were cultured for 4-6 days with either DMSO or GW3965. Representative pictures, quantification of the organoids area/well and qPCR analysis of Abca1 and Areg. (j) Scheme showing WT mice fed with either standard (STD) or GW3965 diet for 10 days followed by focal irradiation of the neck region targeting salivary glands. Representative H&E and zoomed inset of salivary glands from mice fed with STD or GW3965 diet at 0 dpi (left, 10 days after the diet) and at 14 dpi (right, 14 days after the irradiation). Measurement of salivary gland duct area was used as a proxy for salivary gland regeneration. Data are representative of 2–4 independent experiments and each dot represents one mouse, except for f where each dot represents one well. Data are shown as mean ± s.e.m. (a-i). In j, data are shown as mean ± s.e.m. for the bar plot and median ± quartile for the violin plot. Significance was assessed by unpaired two-sided t test (b, c, f, h and i), unpaired two-sided t-test between the slopes for DMSO and GW3965 treated organoids obtained by linear regression analysis (g), and one-way ANOVA with fisher’s LSD post hoc test (a). Part of the schematic in panel d was drawn using BioRender.com and part of the schematic in panel j was adapted from ref. , CC-BY 4.0. Source Data
Extended Data Fig. 9
Extended Data Fig. 9. Characterization of Cyp27a1 expression and function in intestinal regeneration.
(a) Validation of CYP27A1 antibody to check expression of CYP27A1 in the mouse small intestine. Small intestinal tissue from Cyp27a1−/− mice was used to demonstrate the specificity of the antibody. (b) Representative images showing CYP27A1 expression in mouse SI during different days post-irradiation. On the right are the zoom-in of the boxed images in the villus and crypt region. (c, d) Quantification of number of CYP27A1+ intestinal epithelial cells (IECs) (c) and small intestinal lamina propria (SI-LP) (d) cells/crypt area (quantified using immunohistochemical staining). (e) Scheme showing the experiment for sorting different cell types following irradiation (dpi) to determine the cellular source of Cyp27a1. (f) Representative dot plot showing gating strategy for sorting EpCAM+ epithelial cells (IEC) and CD45+ immune cells from the intraepithelial compartment (Imm IEL); CD45+ immune cells from the lamina propria compartment (Imm LP) and EpcamCD45 double negative (DN) cells from the LP compartment of mouse small intestine. (g) Representative dot plots showing Epi, Imm IEL, Imm LP and DN cells from 0-1-3 dpi mouse SI. (h-i) Cyp27a1−/− mice and control littermates (Cyp27a1+/− or Cyp27a+/+) were treated with 2% DSS for 7 days followed by 7 days of recovery. Cyp27a1−/− and controls were housed separately at the start of the experiment. (h) Graph shows the colon length in control and Cyp27a1−/− mice at the end of the DSS colitis experiment. (i) Representative H&E images of colon Swiss rolls and histological score from Cyp27a1−/− and littermate control at the end of the DSS colitis experiment. Data are representative of one (a-d), two (e-g) or three (h-i) independent experiments. Each dot represents one mouse except in (c-d), where each dot represents one crypt area. Data are shown as mean ± s.e.m. in (c-d, g-i). Significance was assessed by one-way ANOVA with Tukey’s post hoc test in (c, d), unpaired two-sided t test in (h, i). Part of the schematic in panel e was adapted from ref. , CC-BY 4.0. Source Data
Extended Data Fig. 10
Extended Data Fig. 10. LXR activation suppresses intestinal tumorigenesis.
(a) Scheme of the experiment showing ApcMin/+ mice fed with either standard or GW3965 diet post-weaning until approximately 16 weeks of age when mice were sacrificed and evaluated for tumour development. (b) Quantification of tumour numbers and size in the SI of ApcMin/+ mice fed with standard or GW3965 diet. (c) Representative H&E stained SI Swiss rolls of ApcMin/+ mice fed with either the standard or GW3965 diet. Areas of tumour are outlined by black dotted lines. (d) Scheme of the experiment showing WT mice fed with standard or GW3965 diet and injected with AOM followed by 3 cycles of DSS. Mice were sacrificed at day 70. (e) Representative H&E stained colon Swiss rolls and quantification of histological lesions of mice undergoing AOM-DSS tumorigenesis and fed with either the standard or GW3965 diet. Areas of tumour are outlined by black dotted lines. (f) Representative H&E stained colon Swiss rolls and quantification of histological lesions of Cyp27a1−/− and littermate control mice undergoing AOM-DSS tumorigenesis and fed with either the standard or GW3965 diet. Areas of tumour are outlined by black dotted lines. (g) Representative images of immunofluorescence staining of CYP27A1 (green), vimentin (red) and nuclei (Hoechst) in human colonic tissue. (h) Representative pictures and quantification of CYP27A1 immunohistochemical staining in human tissue microarray with healthy and CRC tumour samples. (i) qPCR analysis of expression of EGFR ligands in the colonic tumour biopsies at the end (day 70) of AOM-DSS experiment. (j-k) WT mice fed with standard or GW3965 diet were injected with AOM followed by 3 cycles of DSS and samples were collected after each DSS cycle at indicated time points. Quantification of grossly visible tumours during the course of tumour development (j). Mice fed with either the standard or GW3965 diet (for 22, 43 or 70 days), but not challenged with AOM-DSS were used as day0 samples. (k) Representative H&E images of mice colon fed with standard or GW3965 diet and undergoing AOM-DSS tumorigenesis at day 22 and day 43 post-AOM injection. (l) H&E stained colonic Swiss rolls and spatial transcriptomics (ST) representation of unsupervised clustering of colonic tissue from WT mice fed with STD or GW3965-diet at day 0, day 22 or day 43 of AOM-DSS. Data are representative of one (l) or 2–4 (a-f, and i) independent experiments with 6–13 mice per condition (each dot represents one mouse). For d0, 22 and 43 of AOM-DSS tumour kinetics (j-k), one experiment with 3-4 mice/time point were used, and for d70 two experiments with 11–13 mice were used (as shown in Fig. 4a). In (h) each dot represents one spot in the CRC tumour tissue microarray. Data are shown as mean ± s.e.m. (b, i), median and quartiles (h) or staggered replicates with lines connecting the mean (j). Significance was assessed by unpaired two-sided t test in (b, h, i, j). Part of the schematics in panels a and d were adapted from ref. , CC-BY 4.0. Source Data
Extended Data Fig. 11
Extended Data Fig. 11. Mechanism of LXR mediated anti-tumour effects.
(a, b) WT mice were fed with either standard or GW3965 diet and exposed to AOM-DSS tumour model. Starting from d22 after AOM injection, mice were treated with repeated (weekly) intraperitoneal injections of either 300 µg anti-CD19 (αCD19) (a) or anti-CD8 (αCD8) (b) antibody. Control mice were injected with PBS. Mice were sacrificed at day 70 and macroscopic tumour numbers were counted. Quantification of tumour numbers (log2 normalized) and sizes are shown. (c) Expression levels of CYP27A1, ABCG1, ABCA1, CD19, MS4A1, CR2, CD8A, GZMA, and CD69 in a human CRC whole genome transcriptome array dataset stratified in six tumour subtypes (c1 to c6) and non-tumour control (NT). Data are representative of two independent experiments (a,b) with 4–8 mice per condition (each dot represents one mouse). Data are shown as mean ± s.e.m. (a,b) and quartiles (c). Significance was assessed by One-way ANOVA with Tukey’s post-hoc test in (a,b) or two-way ANOVA with Dunnett’s post hoc test in (c). Part of the schematics in panels a and b were adapted from ref. , CC-BY 4.0. Source Data
Extended Data Fig. 12
Extended Data Fig. 12. LXR unlinks intestinal regeneration and tumorigenesis.
Schematics showing the proposed model. Left side: intestinal tissue damage leads to increased expression of the enzyme Cyp27a1, which metabolizes oxysterol ligands for LXR. Either endogenous or synthetic (GW3965) LXR ligands act in epithelial cells to induce the EGFR ligand amphiregulin (Areg) promoting intestinal epithelial regeneration. Right side: In the context of tumour development, LXR activation amplifies anti-tumour immunity (dependent on B cells and CD8 T cells) controlling intestinal tumour growth.

References

    1. Huber, S. et al. IL-22BP is regulated by the inflammasome and modulates tumorigenesis in the intestine. Nature491, 259–263 (2012). - PMC - PubMed
    1. Oudhoff, M. J. et al. SETD7 controls intestinal regeneration and tumorigenesis by regulating Wnt/β-catenin and Hippo/YAP signaling. Dev. Cell37, 47–57 (2016). - PubMed
    1. Kim, M. J. et al. PAF-Myc-controlled cell stemness is required for intestinal regeneration and tumorigenesis. Dev. Cell44, 582–596 (2018). - PMC - PubMed
    1. Ayyaz, A. et al. Single-cell transcriptomes of the regenerating intestine reveal a revival stem cell. Nature569, 121–125 (2019). - PubMed
    1. Czarnewski, P. et al. Conserved transcriptomic profile between mouse and human colitis allows unsupervised patient stratification. Nat. Commun.10, 2892 (2019). - PMC - PubMed

MeSH terms